Observability and Dashboards
Download
Focus Mode
Font Size
Overview
The cost and performance of large models are resources that can only be controlled through continuous observation. Unlike traditional computing resources, their expenses are driven by tokens, fluctuate significantly with Prompt length and model selection, and are highly dispersed across numerous businesses, keys, and models. Without a unified metrics view, enterprises will face several typical monitoring blind spots: an inability to track consumption across business lines, an inability to determine whether caches are being effectively reused, an inability to promptly detect latency degradation, and an inability to trigger an alarm at the first sign of abnormal cost growth.
Observability is precisely what eliminates these blind spots. Its value goes beyond presenting data as charts. It aggregates scattered call behaviors into insights that support decision-making, enabling cost attribution to business lines, timely detection of performance degradation, and evidence-based scheduling optimization. This solution builds an observability system covering both usage and performance based on CMR usage details and log service dashboards. The built-in usage details in CMR meet the need for real-time observation. When long-term retention or custom dimensions are required, logs are delivered to CLS and dashboards are configured. Together, these two approaches enable enterprises to view current status in real time and to trace and analyze historical data.
Solution Value
The value of observability ultimately manifests in two outcomes: cost savings and service stability. Each dimension listed in the following table corresponds to a path from data to action.
Dimension | Customer Benefits | Decision Support |
Usage transparency | Present Token consumption by user and model dimensions, and allocate costs to business lines. | Cost allocation, budget adjustment |
Performance visibility | Observe latency, time to first token, and QPS to promptly detect performance degradation. | Capacity planning, bottleneck identification |
Anomaly alerting | Visualize error rates and rate limiting triggers, and support alarm configuration. | Proactive O&M, fault mitigation |
Architecture Description
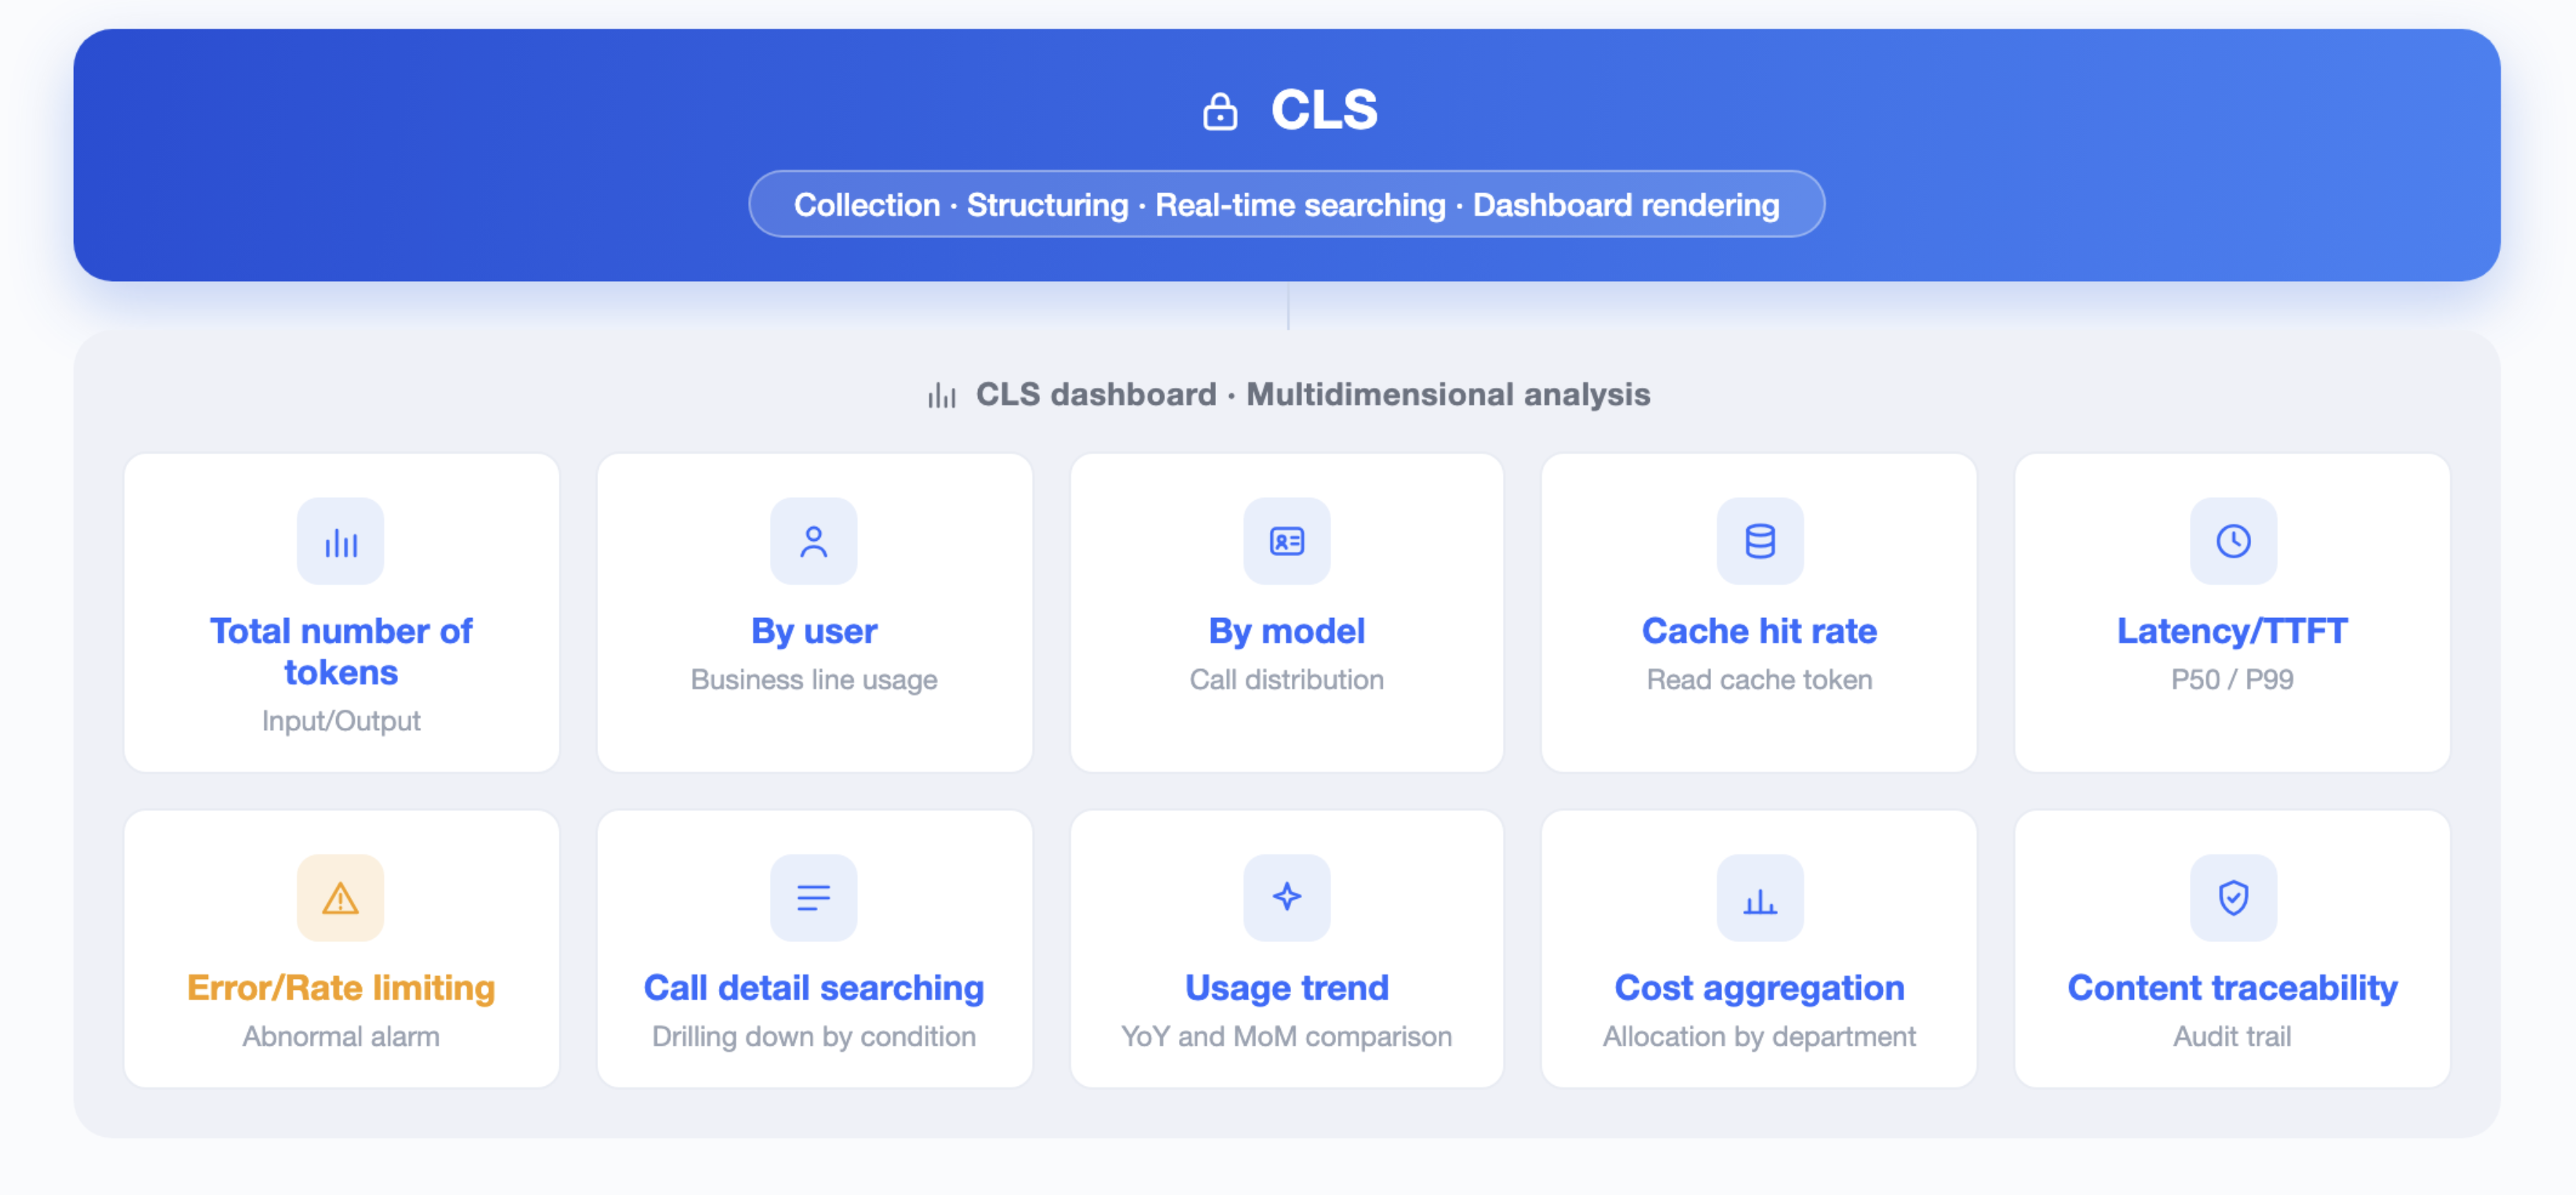
An observability pipeline is a processing flow that transforms raw logs into multi-dimensional insights. When processing each call, the CMR gateway produces call logs and metrics containing fields such as usage and latency, and delivers them to CLS. After CLS completes collection, structuring, and real-time search, it aggregates raw events into dimension-based analytical views in dashboards.
On this basis, alarms advance observability from passive viewing to proactive response. You can configure thresholds for key metrics so that when they are triggered, responsible personnel are notified via SMS and email, enabling proactive fault detection. Alarms can also be integrated with the credit budget capability to form a complete cost governance solution that covers both monitoring and cost control.
Prerequisites
1. A CMR model routing instance has been created. For detailed instructions, see Model Routing Instance Management.
2. A CMR access key has been created. For detailed instructions, see CMR Access Key.
3. A BYOK instance has been created. For detailed instructions, see Creating a BYOK Instance.
4. To control credit consumption or call rates, create the corresponding credit budget in advance. For detailed instructions, see Configuring a Credit Budget.
5. CLS has been activated, and a logset and log topics have been created. A log Topic is the basic unit for log collection, storage, search, and analysis. A logset is a category of log topics, making it easier for users to manage them.
Operation Steps
Step 1: Viewing Usage Details
1. Log in to the CMR console. On the Instance Management page, click the target instance ID to go to the Instance Management page of the target instance.
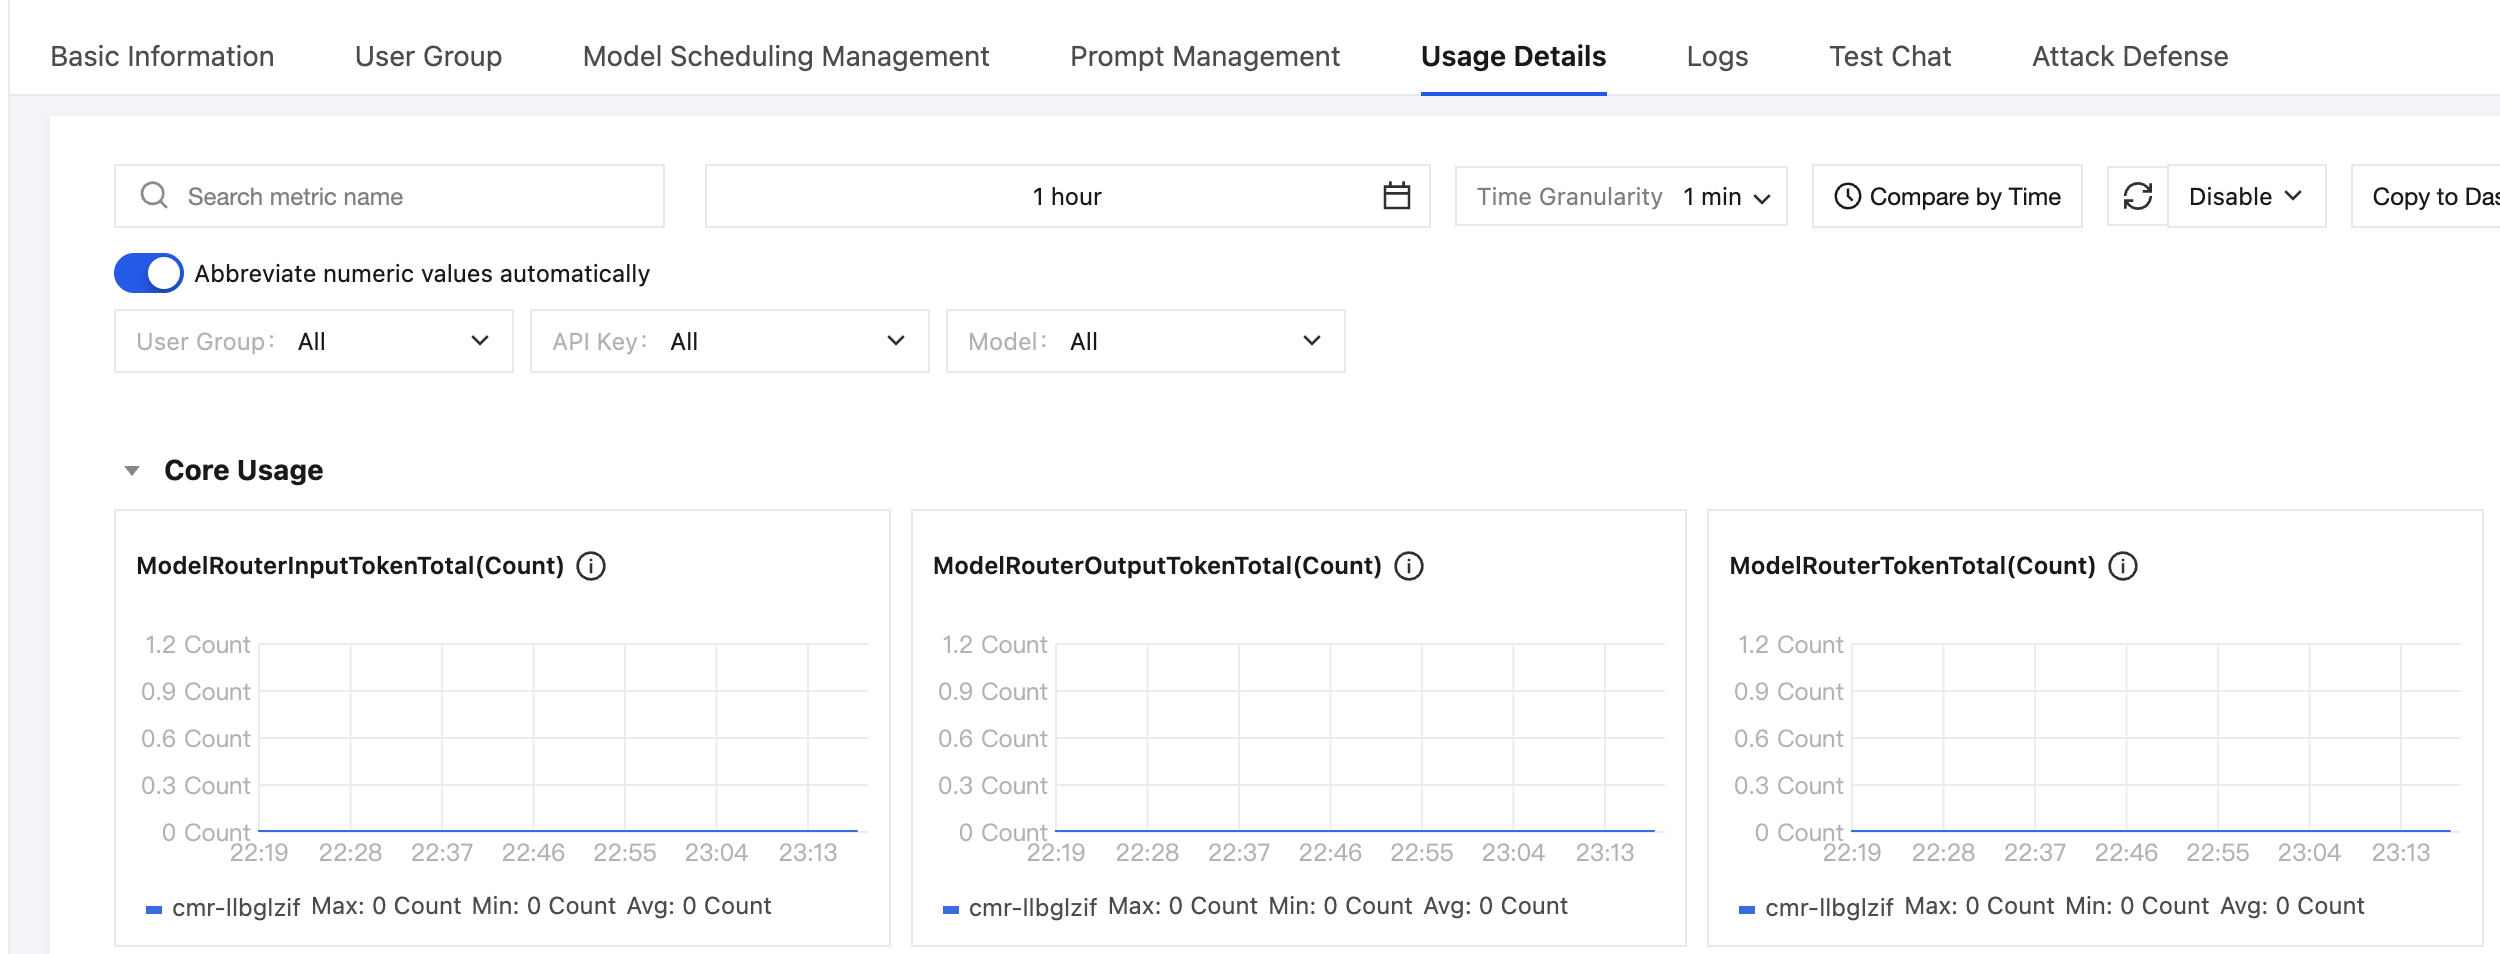
2. Switch to the Usage Details tab to view the current status, including Token consumption and latency, meeting real-time observation needs.
Step 2: Configuring CLS Log Delivery
1. On the Instance Management page of the instance, switch to the Logs tab.
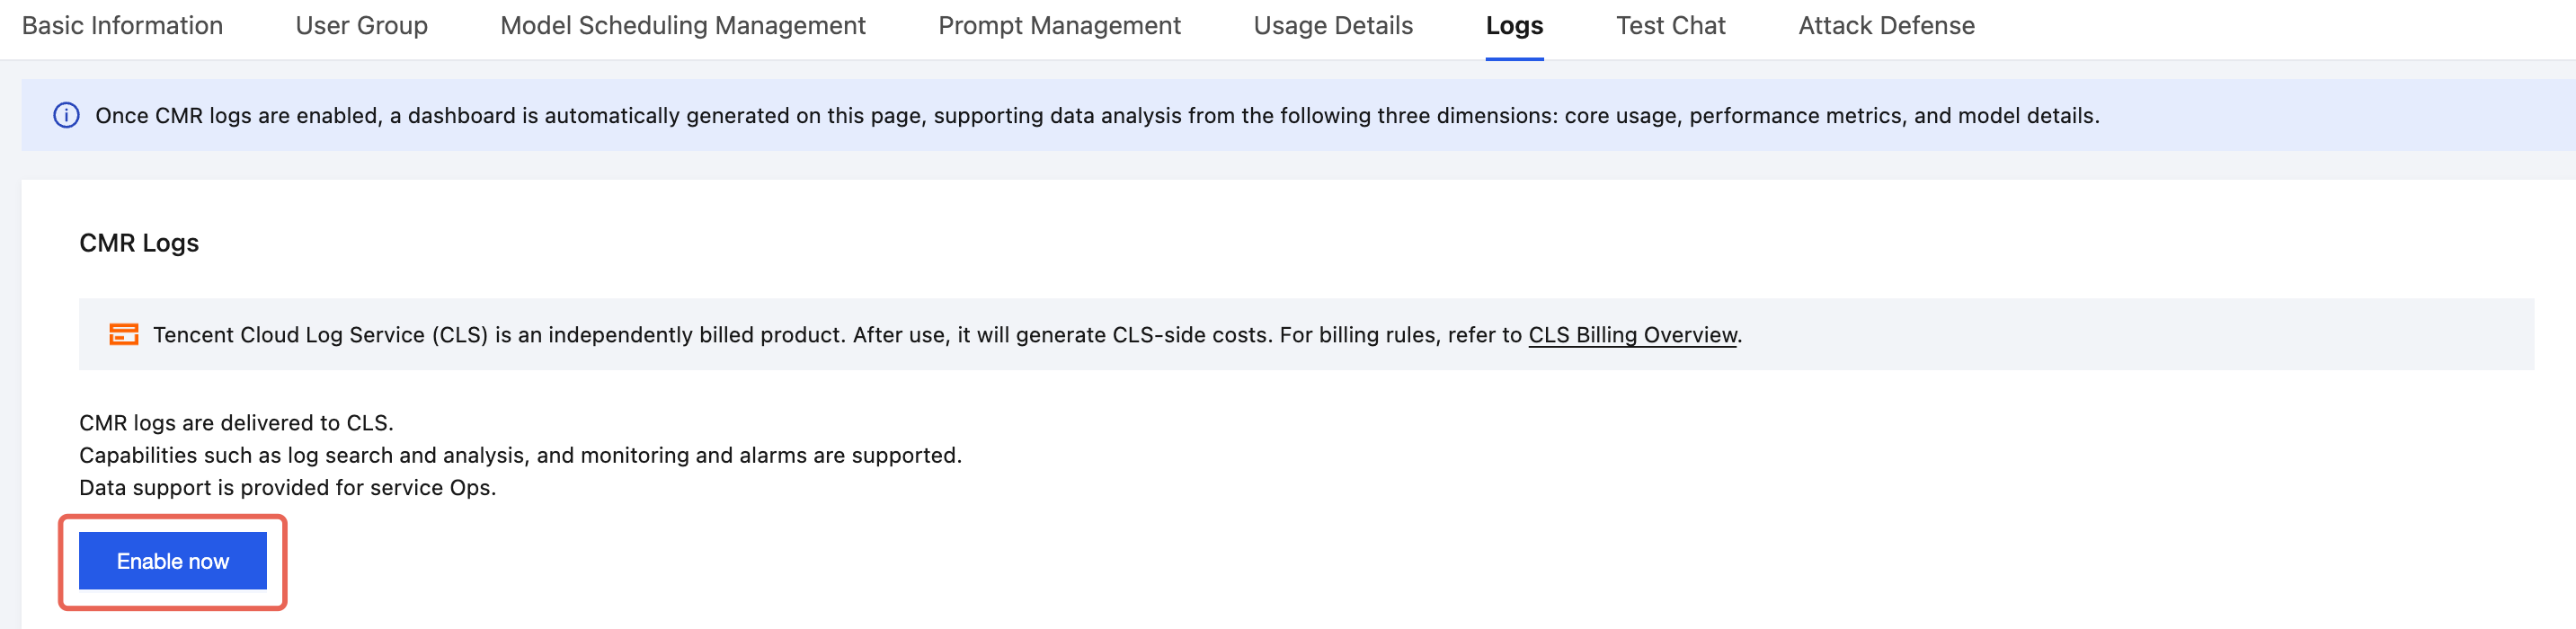
2. In CMR logs, click Enable Now.
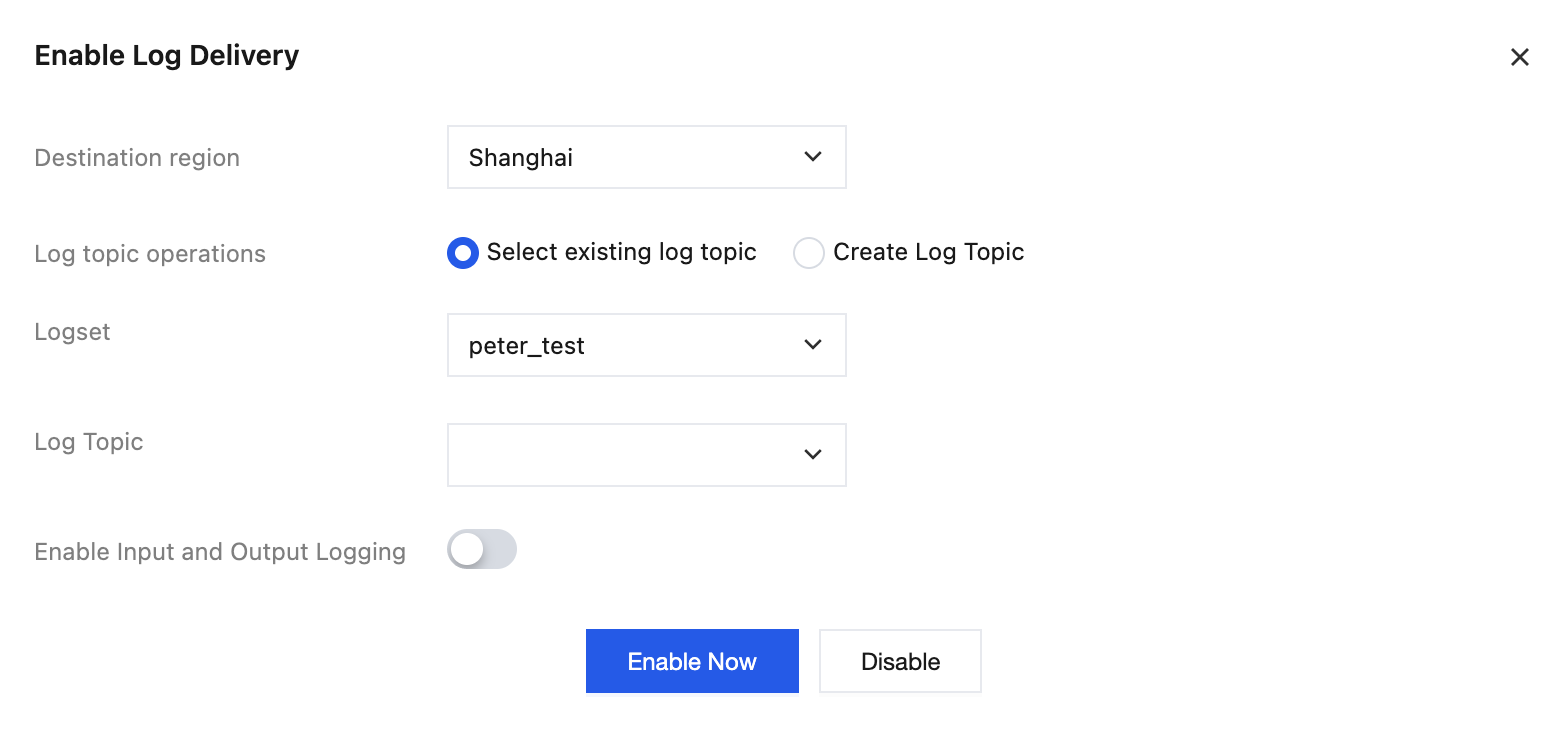
3. Select an existing log topic or create a log topic to complete the logset and log topic configuration.
Step 3: Viewing Multidimensional Dashboards
1. After you enable CLS, the console automatically creates a dashboard based on the log topic, including the following three dimensions:
Core Usage: Request usage, credit usage, and Token usage.
Performance Metrics: Latency metrics and exception metrics.
Model Details: Model call details and model request details.

Step 4: Closed-Loop Optimization
1. Review dashboards regularly and optimize management policies based on conclusions such as low cache hit rates, high tail latency, and usage surges in certain business lines.
2. It works in conjunction with the cost control capability of credit budget to form a complete cost governance loop that covers both monitoring and cost control.
References
Help and Support
Was this page helpful?
You can also Contact sales or Submit a Ticket for help.
Help us improve! Rate your documentation experience in 5 mins.
Feedback