TDMQ for RabbitMQ supports routine monitoring of the status of resources under your account. You can view monitoring data of various TDMQ for RabbitMQ resources in the console in real time to understand the health status of clusters.
Viewing the Cluster Health Status
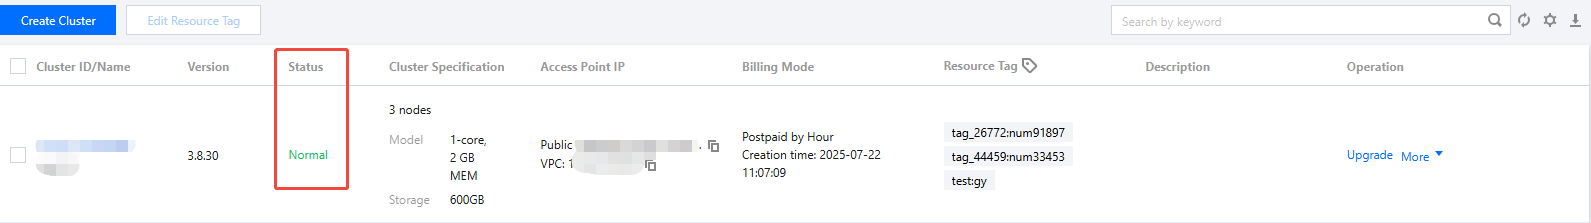
TDMQ for RabbitMQ has an inspection program configured for each cluster. This program checks metrics such as node status, disk utilization, and memory utilization of the cluster. When these metrics exceed certain thresholds, different health statuses will be triggered. If the cluster status becomes abnormal, you can view detailed monitoring metrics on the monitoring page of the console to locate issues.
2. In the left sidebar, click Cluster, select a region, and then view the health status of clusters in the Status column of the cluster list. If the cluster status is abnormal, you can click the tooltip in the Status column to view detailed prompt messages.
Viewing Node Status (Supported Only by Managed Edition)
2. In the left sidebar, choose Cluster, select a region, and click the ID of the target cluster.
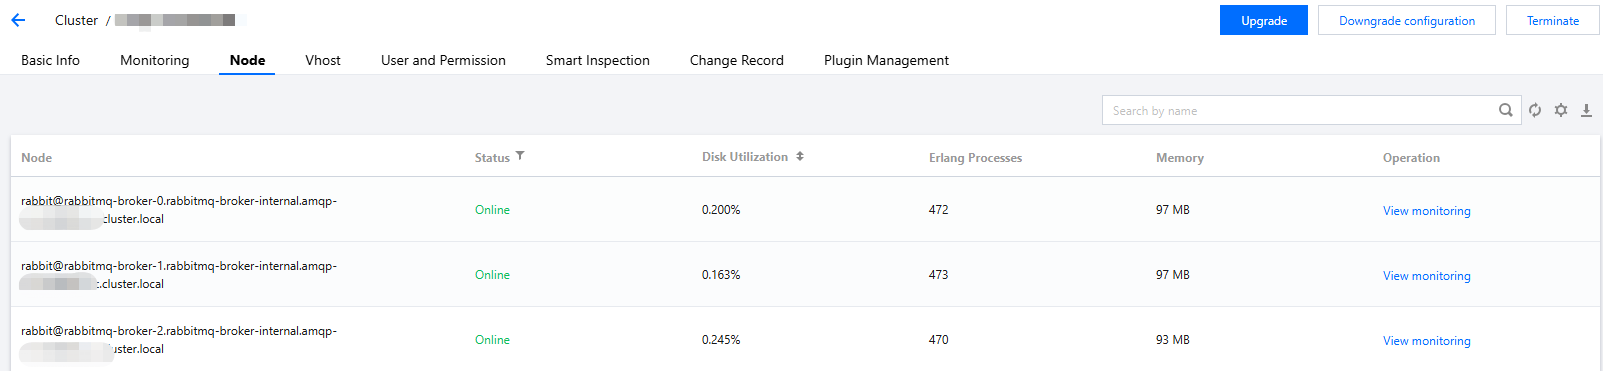
3. On the Basic Info page, select the Node tab at the top to view the node information of the current cluster.
4. On the node list page, click View Monitoring in the Operation column to view detailed monitoring information for the corresponding node. For more information about metrics, see Monitoring Metric Description. Viewing Monitoring Data
2. In the left sidebar, choose Cluster, select a region, and click the ID of the target cluster to go to the basic information page.
3. At the top of the cluster details page, click the Monitoring tab to go to the monitoring page.
4. Select the resource tab you want to view, select the resources to be monitored, set the time range, and then view the corresponding monitoring data.
Viewing Message Backlog Ranking
When a message backlog occurs in a queue (where the message production rate consistently exceeds the consumption rate), it may cause issues such as excessive disk resource usage and high memory load. The message backlog sorting feature can quickly identify high-risk queues, enabling the Ops team to address backlog issues in critical business queues promptly.
To view the message backlog ranking and monitoring data of queues, perform the following operations:
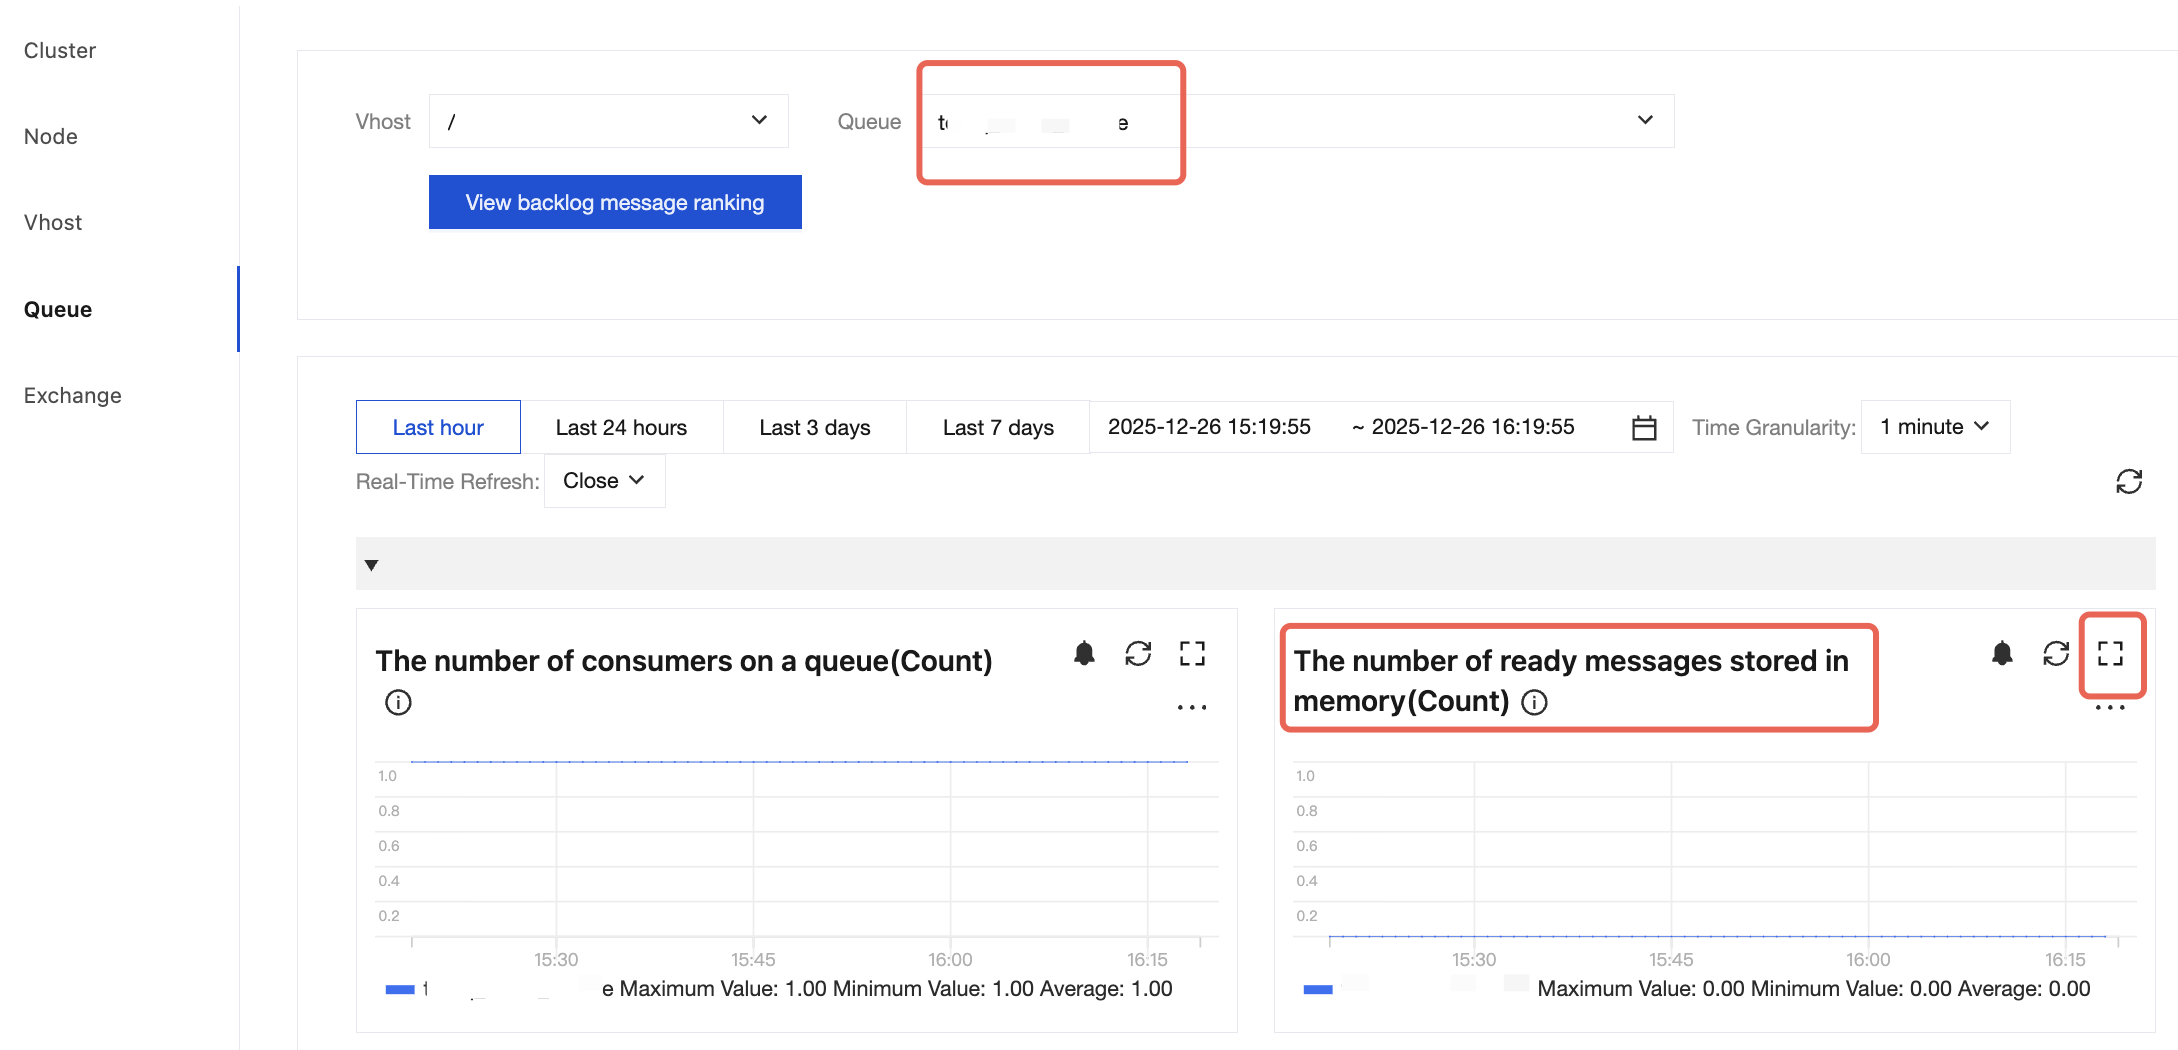
1. On the Monitoring Dashboard page, click the Queue tab, select the desired vhost, and click View Message Backlog Ranking to view the message backlog ranking of queues in the specified vhost.
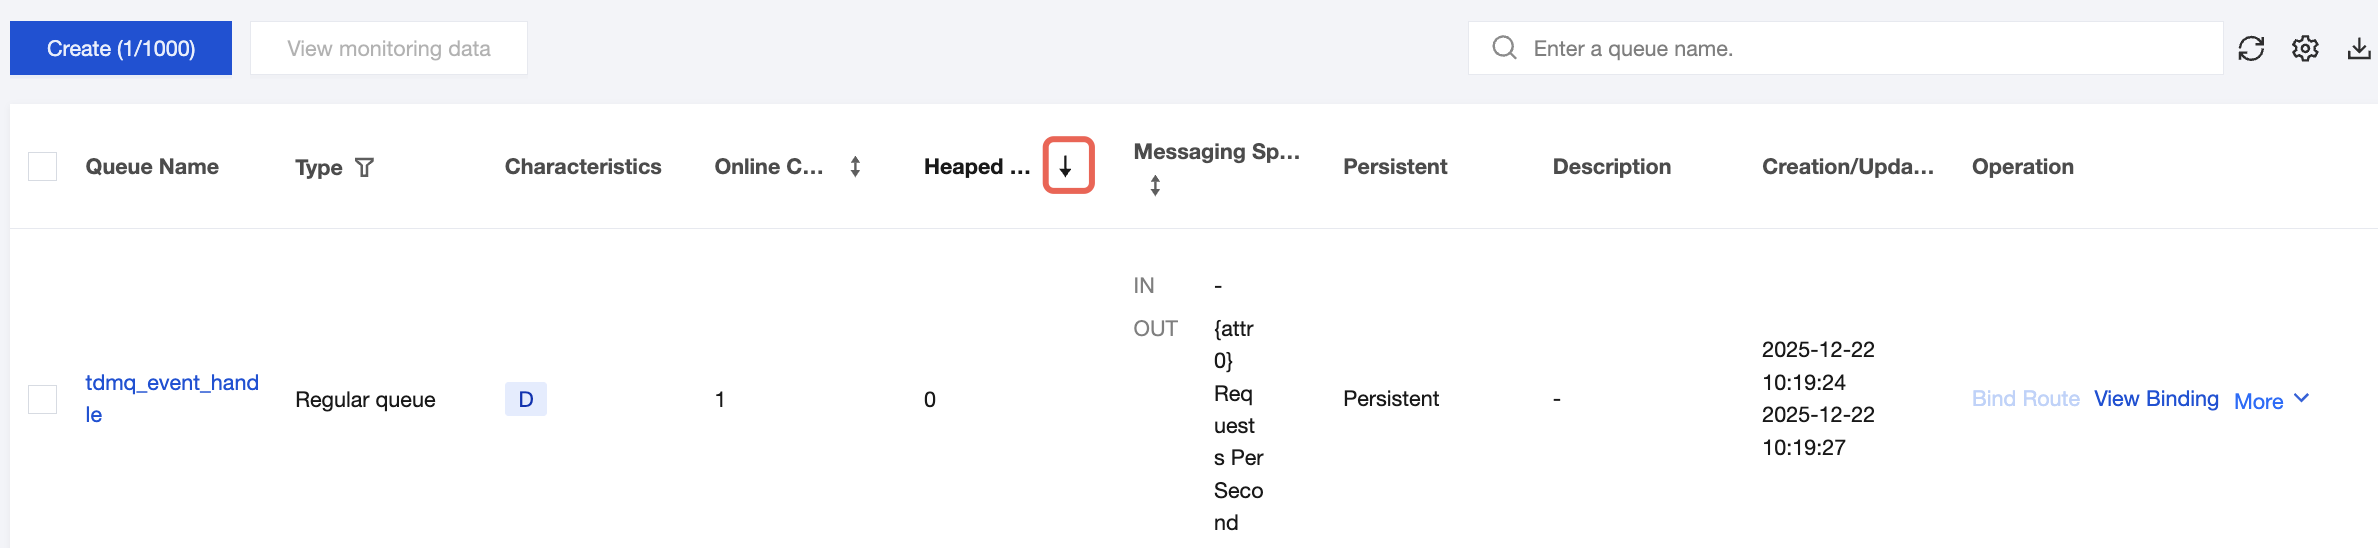
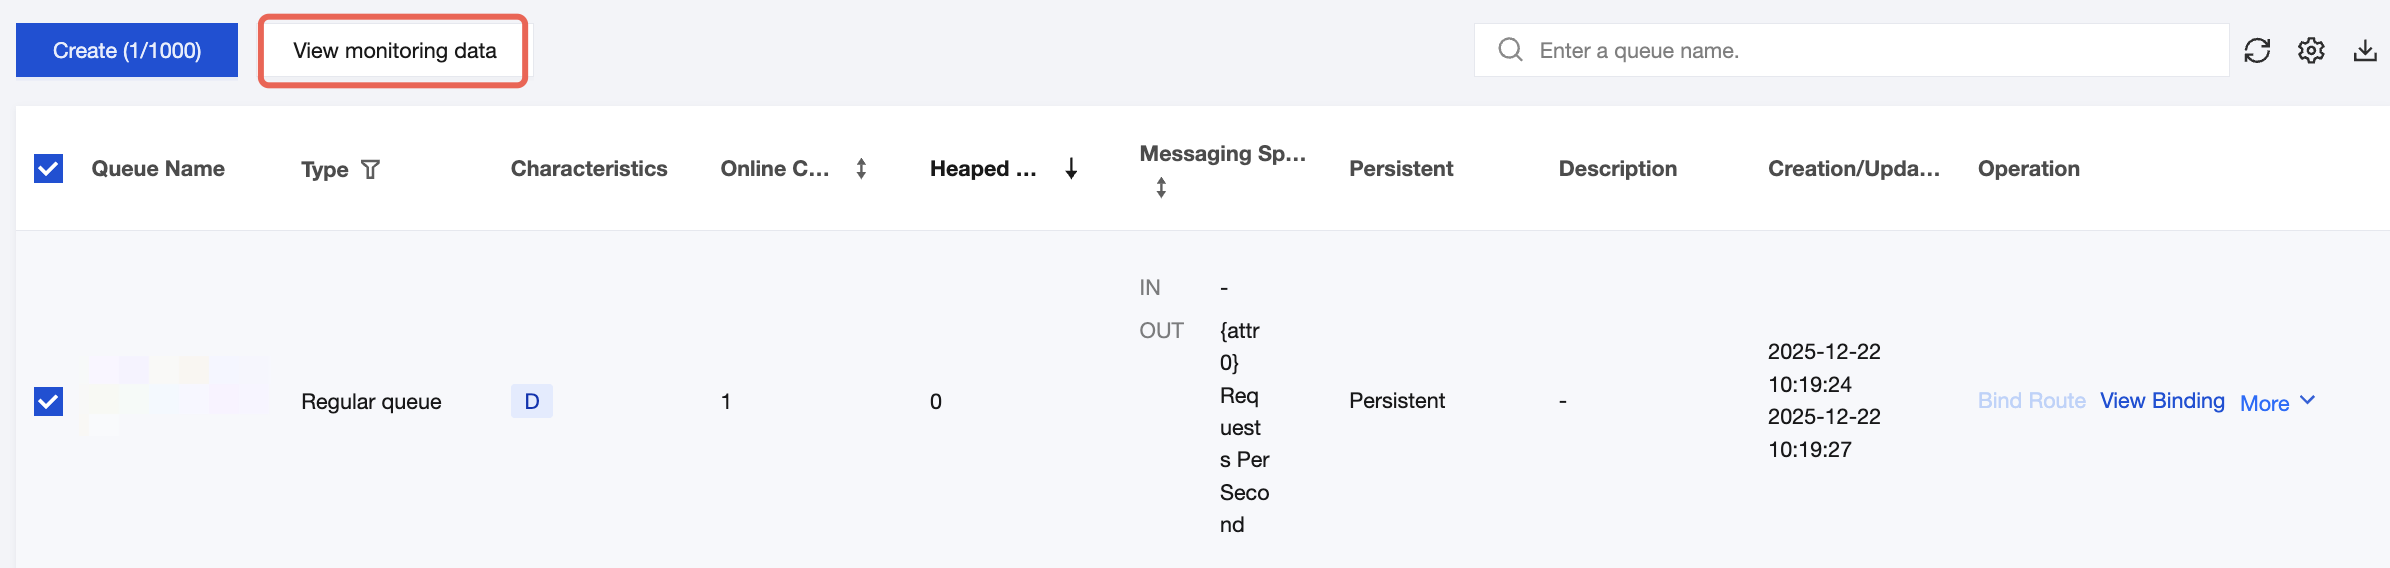
2. On the Queue List page, you can click Message Backlog Count in the column header to view the message backlog ranking of queues, with support for both ascending and descending order.
3. Select one or multiple queues (up to 5), and then click View monitoring data to redirect to the monitoring dashboard page and view monitoring data.
Time Selector Description
You can flexibly control monitoring data display through the following features: freely selecting time ranges, adjusting time granularity, and setting refresh rates.
|
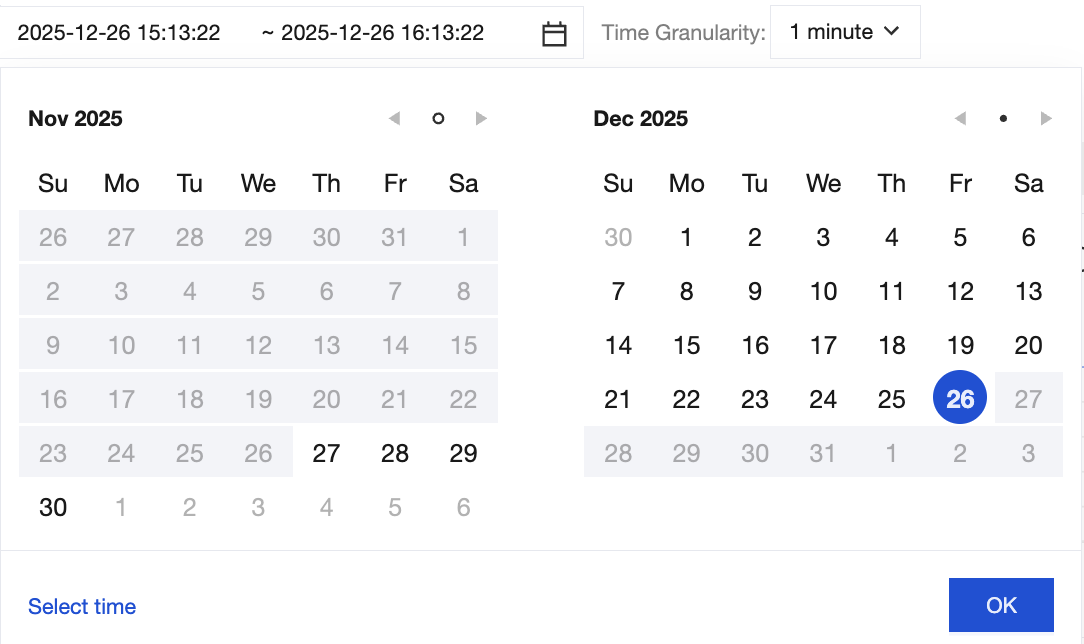
Selecting time ranges | | Click the time selection box to select the time range for displaying monitoring data in the chart. By default, data from the last hour is displayed. You can quickly select a specified time range using the shortcuts at the top. You can select a long time range through the calendar. You can click Select Time in the lower-left corner to specify a more precise range accurate to the second. |
Adjusting the time granularity | | You can select 1 minute or 5 minutes from the Time Granularity drop-down list. |
Setting refresh rates | | You can set a real-time refresh interval for charts by clicking the Real-Time Refresh drop-down list. Options include 30 seconds, 1 minute, 5 minutes, or disabled. |
Chart Icon Description
The following table describes operations that can be performed for each monitoring chart provided by TDMQ for RabbitMQ.
Operation | Icon | Description |
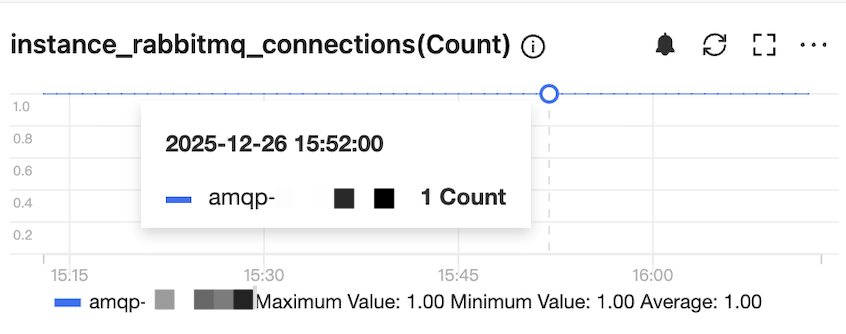
Viewing data | | You can hover the cursor over a chart to view detailed data at a time point. |
Configuring alarms | | You can click the icon to redirect to Tencent Cloud Observability Platform (TCOP) to configure alarm rules for the current monitoring metric. For specific operations, see Configuring Alarm Policies. |
Refreshing data | | You can click the icon to refresh a monitoring chart to display the latest data. |
Enabling fullscreen display | | You can click the icon to view a chart in fullscreen mode. Press Esc or click the close icon in the upper-right corner to exit the fullscreen mode. |
Exporting data | | You can click the icon to export chart data as a CSV file or as a PNG image. |