Executing a Traffic Replay Task
Download
Focus Mode
Font Size
This document describes the steps and instructions for performing a complete traffic replay task through the console.
Prerequisites
1. Preparing the Source Instance
Before executing a traffic replay task, ensure that a source instance exists. The source can be TDSQL-C for MySQL or a third-party cloud. Details are as follows:
TDSQL-C for MySQL: Ensure that the corresponding source instance has the database audit feature enabled and that its audit logs cover the time period for traffic replay. For information on how to enable database audit, see Enable the Audit Service.
Other third-party clouds: Ensure that the audit log files exported from the third-party cloud (CSV, JSON, or compressed package-tgz) contain the required fields: timestamp, nsTime, thread_id, execTime, errCode, dbName, and sql.
2. Preparing the Target Instance
You need to build a target instance for risk-free simulation testing. Details are as follows:
The clone point should be as close as possible to the replay start time to ensure that the database tables exist during the target instance's replay period.
Record the account and password used for the connection. (We recommend using the root account, which must have full read and write permissions on all databases.)
Operation Steps
Step 1: Creating a Replay Task
1. Log in to the TDSQL-C for MySQL console.
2. Select Traffic Replay in the left sidebar.
3. On the redirected page, click Create Replay Task.

4. Complete the data injection configuration, and then click Next.
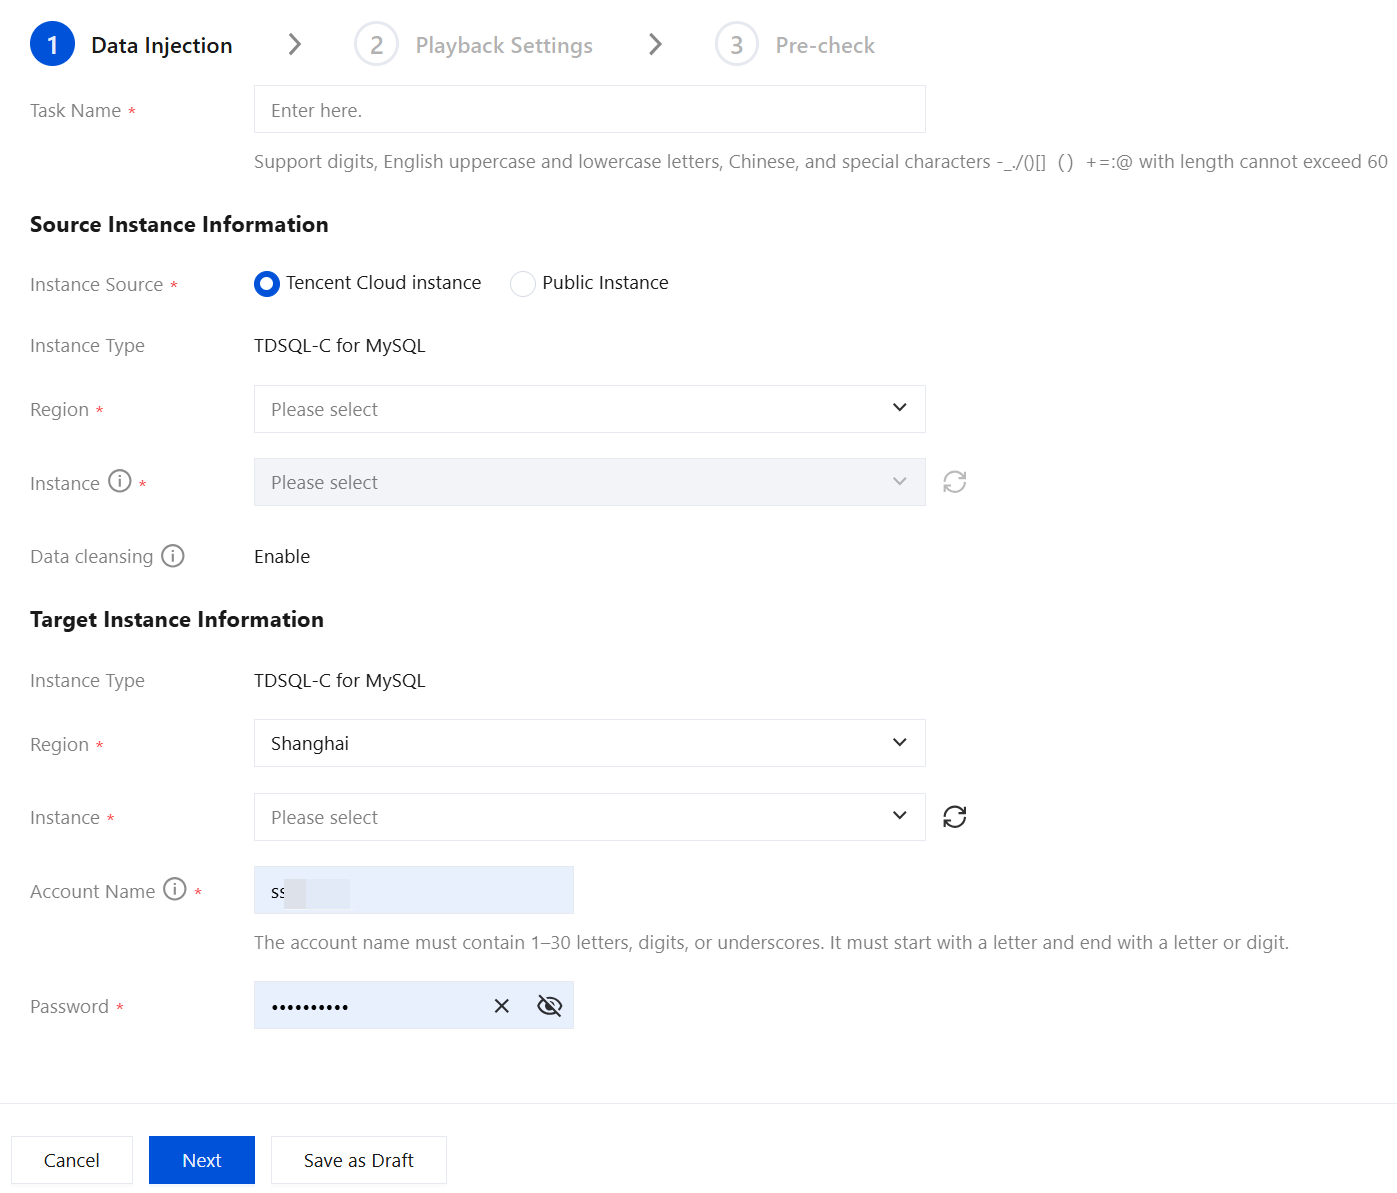
Parameter | Description |
Task Name | Enter a task name. It supports only digits, uppercase and lowercase letters, Chinese characters, and special characters: _-./()[]()+=:@, and the length cannot exceed 60. |
Instance Source | Select an instance source: Tencent Cloud instance Public Instance |
When the instance source is a Tencent Cloud instance, configure the following parameters:
Parameter | Description |
Instance Type | Default: cloud database TDSQL-C for MySQL. |
Region | Select the region of the source instance. |
Instance | Select an instance within the region of the source instance. Only instances with full audit/rule audit enabled are supported for selection. It is recommended to enable full audit. Ensure that the database audit is enabled from the start time to the end time of the replay. |
Data cleansing | Enabled by default. It cleans and filters incomplete, erroneous, or redundant data in logs, sorts the audit logs, and ensures the accuracy of traffic replay. |
When the instance source is an external instance, configure the following parameters:
Note:
Traffic replay for external instances depends on the instance's audit logs, which must be stored in COS in advance. The operating account must have the CynosDB_QCSLinkedRoleInAuditReplayForCos permission (used to authorize TDSQL-C for MySQL to access COS resources and obtain the traffic replay source files). If this is your first operation and authorization has not been granted, click Go to Authorize, navigate to the CAM platform, and click Agree to Authorize.
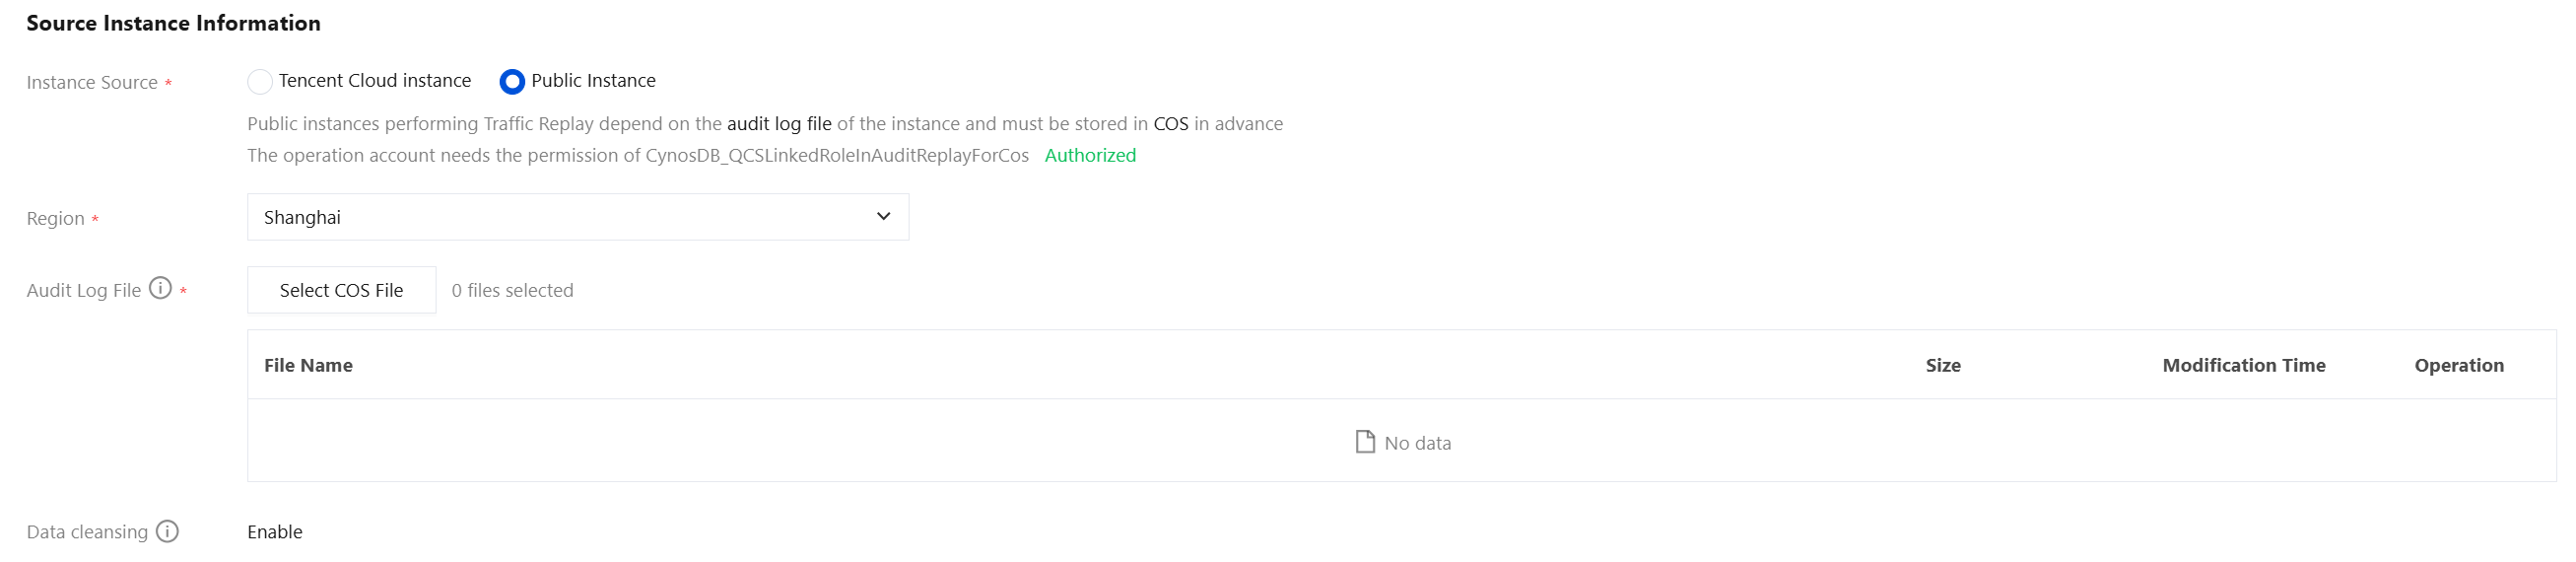
Parameter | Description |
Region | Select the region for external instance replay, which refers to the region where the COS bucket is located. The files involved in the replay are the audit logs stored in the COS bucket of the specified region. |
Audit Log File | After you have the CynosDB_QCSLinkedRoleInAuditReplayForCos permission, you can click Select COS File to choose the audit log file. |
Data cleansing | Enabled by default. It cleans and filters incomplete, erroneous, or redundant data in logs, sorts the audit logs, and ensures the accuracy of traffic replay. |
After the instance source is configured, you can configure the target instance:
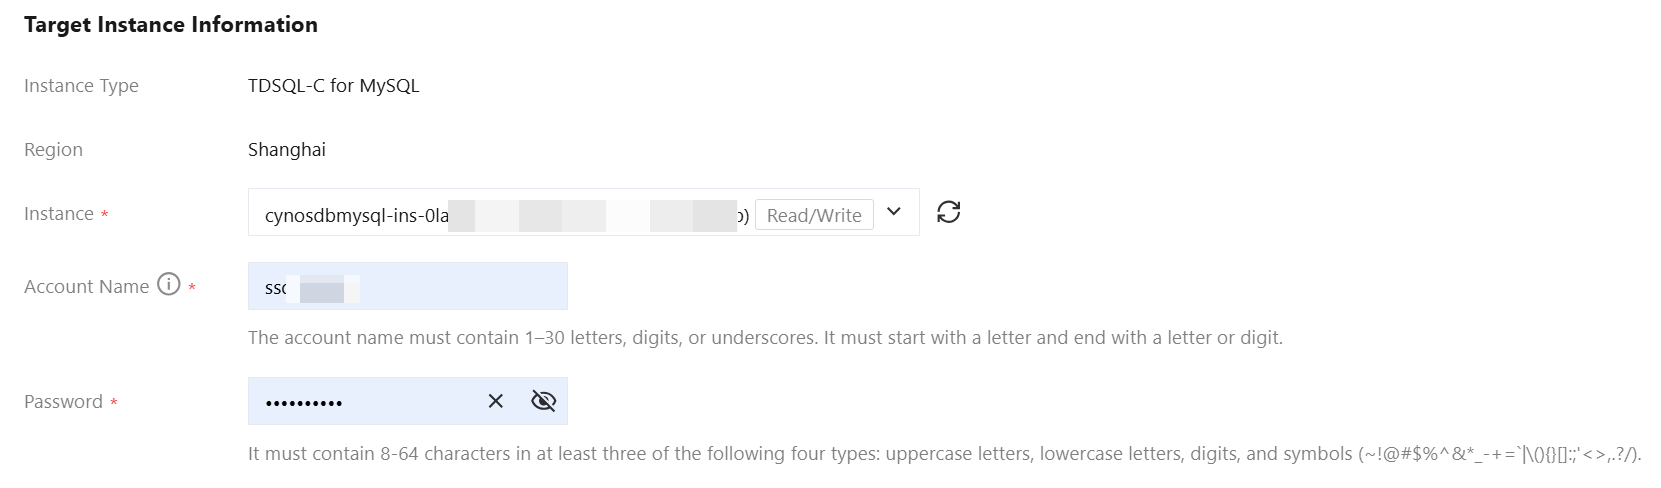
Parameter | Description |
Instance Type | Set the instance type for the target instance. Default: cloud database TDSQL-C for MySQL. |
Region | Select the region of the target instance. |
Instance | Select the target instance within the selected region. |
Account Name | Enter the account name for the connection. Note: The target account must have the highest privileges. |
Password | Enter the password for the connection account. |
5. Complete the replay configuration, and then click Next.
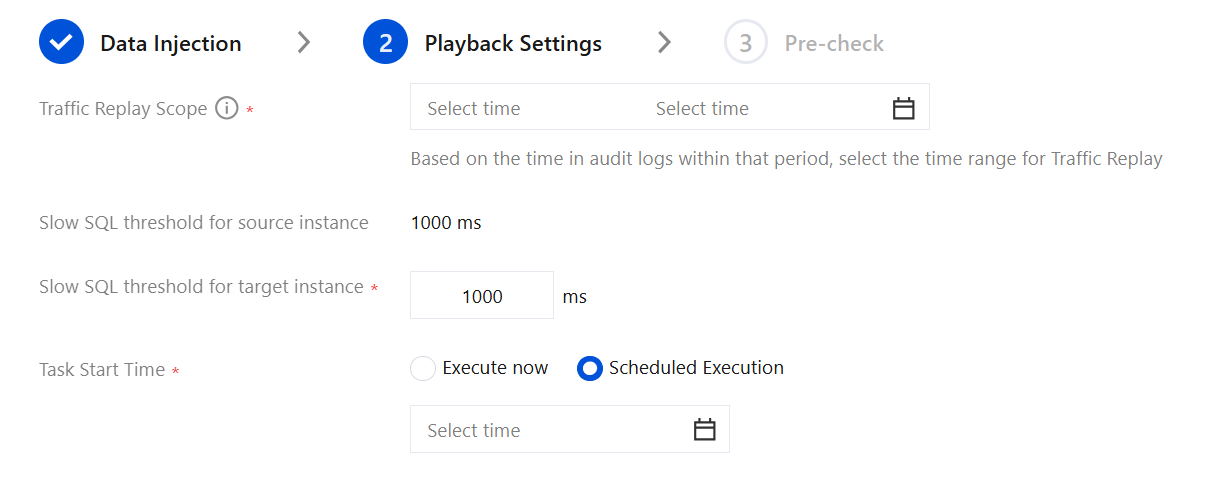
Parameter | Description |
Traffic Replay Scope | Select the time range for traffic replay based on the time within the audit log cycle. The replay is supported from the first audit log to the last. If there are missing logs in between, they are automatically skipped during replay, requiring no manual handling. First, select the date range, and then set the specific time. Ensure that the database audit is enabled from the start time to the end time of the replay. |
Slow SQL threshold for source instance | When the source instance is TDSQL-C for MySQL, the system automatically obtains the source instance's slow SQL threshold. When the source instance is an external instance, there is no slow SQL threshold for the source instance. |
Slow SQL threshold for target instance | Set the slow SQL threshold for the target instance. You can customize the value. Unit: millisecond. This setting affects the statistical scope of slow SQL statements in the report. |
Task Start Time | Execute now: Execute immediately after creation. Scheduled Execution: Set a future time point to automatically trigger task execution. It is recommended to schedule this during off-peak hours. |
6. Complete the pre-check, and then click Enable.
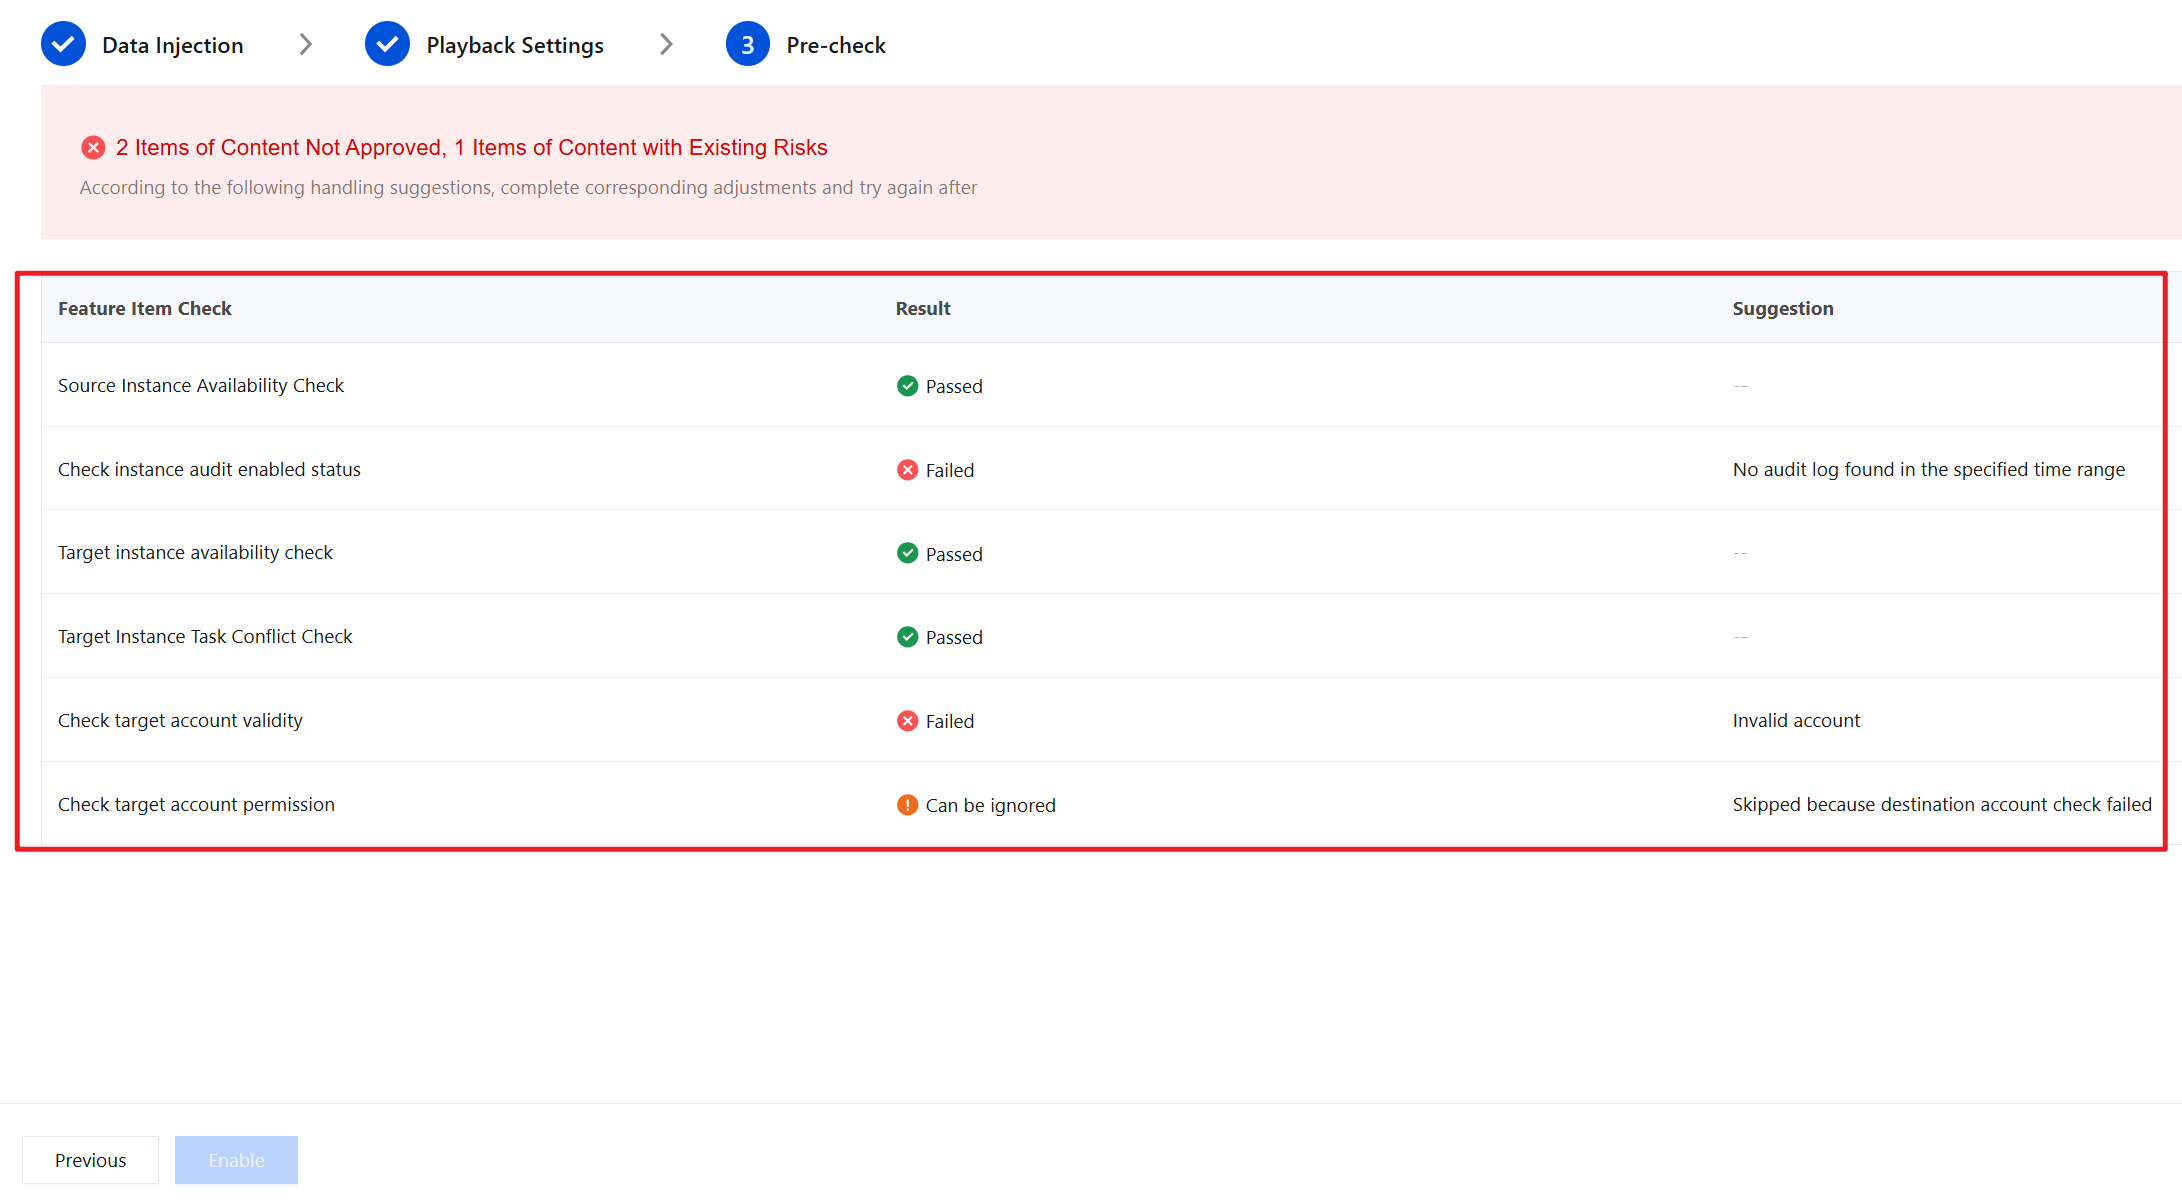
The pre-check is performed automatically by the system. You can wait for the system to complete the execution and then perform the corresponding operation.
When the instance source is TDSQL-C for MySQL, the system checks both the source instance and the target instance.
Check Item | Check Content | Action on Failure |
Source Instance Availability Check | Check whether the source instance is in a running state. Check whether the IP address port of the source instance is accessible. | Confirm that the instance status is normal. |
Check instance audit enabled status | Check whether full audit/rule audit is enabled for the source instance. Check whether audit logs can be found within the specified time range. | Confirm that auditing is enabled and logs are not expired. |
Target instance availability check | Check whether the target instance is successfully built and its status is Running. Check whether the IP address port of the target instance is accessible. Check whether the auto-pause feature is enabled for the target Serverless instance. If it is enabled, the pre-check will fail. | Confirm that the instance status is normal and ensure that auto-pause is disabled for the Serverless instance. |
Target Instance Task Conflict Check | Whether other conflicting tasks exist on the target instance. | Complete other conflicting tasks before retrying. |
Check target account validity | Check whether the target account can be logged into correctly. Check whether the target account is valid. | Check whether the connection account and password are correct. Check whether the connection account has been created. |
Check target account permission | Whether the target account has the highest permissions (with full database read/write capabilities). | Switch to an account with higher permissions or grant permissions to the current account. |
When the instance source is an external instance, the system checks the fields in the external audit logs.
Note:
For mandatory fields, the replay is blocked if any one of them is missing.
For optional fields, their absence does not affect the replay result or block the process. If a warning is generated due to a missing optional field, you can ignore it and proceed.
Mandatory Field Name | Description |
timestamp | SQL statement execution timestamp (microseconds) |
nsTime | SQL statement execution timestamp (microseconds, for precise ordering) |
threadId | Thread ID, the basis for transaction association |
execTime | SQL statement execution time (microseconds) |
errCode | Original execution error code |
dbName | Database name where the SQL statement resides |
sql | Complete SQL statement |
Optional Field Name | Description |
checkRows | Scanned rows, reflecting index usage efficiency |
affectRows | Affected rows, reflecting the scope of DML operations |
sentRows | Returned rows, reflecting the size of the result set |
lockWaitTime | Lock waiting time (microseconds), reflecting lock contention |
cpuTime | CPU execution time (nanoseconds) |
ioWaitTime | IO waiting time (microseconds) |
trxLivingTime | Transaction duration (microseconds) |
sqlType | SQL operation type (SELECT, INSERT, UPDATE, and so on) |
Check Result Status and Description
Status | Description | Solution |
Passed. | The check is normal. | No action required |
Missing but ignorable | Optional fields are missing, but this does not affect playback. | Proceed directly |
Failed | Blocking issues exist. | Fix according to the handling suggestion, and then click Recheck. |
7. After all pre-checks pass, the traffic replay task can be queued for execution.
Step 2: Viewing Task Execution Status
After a traffic replay task is created, you can click its task ID in the task list to go to the task details page. On the task details page, you can view information such as the task completion progress, start time, and duration.
Step 3: Viewing the Replay Report
After a traffic replay task is executed, you can view the replay report on the task details page. You can view the three sections - Report Overview, Performance Trend Comparison, and Exception Report - separately.
The Report Overview page provides you with overall conclusive data, including parameter comparison, performance data comparison, and more.
The Performance Trend Comparison page displays a comparison of performance metrics between the source instance and the target instance.
The Exception Report page displays the SQL statements that failed to execute on the target instance and supports downloading the exception report.
Help and Support
Was this page helpful?
You can also Contact sales or Submit a Ticket for help.
Help us improve! Rate your documentation experience in 5 mins.
Feedback