Viewing Audit Logs
Baixar
Modo Foco
Tamanho da Fonte
This document describes how to view database audit logs and the fields in the related audit log list.
Note:
If the audit mode is rule-based audit, log parsing errors may occur when an SQL statement contains non-ASCII binary characters or special characters. Log parsing is normal if the audit mode is full audit.
When an SQL statement exceeds 32 KB in length, the SQL statement recorded in the log may be truncated, and log parsing errors may occur due to the truncation.
Audit logs do not record SQL statements executed through functions or stored procedures.
A new audit log page was released on July 12, 2023. The audit log search field Scanned Rows is a newly added field. For audit logs generated before this date, the data in this field is displayed as "-" in the console and as "-1" in downloaded files and API responses.
Uniformly changed the unit of the audit log field Execution Time to microseconds in both the console and downloaded audit log files.
Uniformly changed the unit of the audit log field CPU Time to microseconds in both the console and downloaded audit log files.
Added the display of the millisecond-level time for the unit of the Timestamp field in audit log files.
When audit logs are searched, the character used to separate multiple search terms is changed from comma to line break.
After you enable database audit, the regions where audit log files are stored for instances in the Tianjin, Taipei (China), and Shenzhen regions differ. For the corresponding storage regions, see the following table.
Instance Region | Audit Log Storage Region |
Tianjin | Beijing |
Taipei (China) | Hong Kong (China) |
Shenzhen | Guangzhou |
Prerequisites
Viewing Audit Logs
Note:
The display time in audit logs is extended to the millisecond level, enabling more precise sorting and problem analysis of SQL statements.
1. Log in to the TDSQL-C for MySQL console.
2. In the left sidebar, select SQL Insight (Database Audit).
3. After selecting a region at the top, go to the Audit Instance page. Click Audit Log Storage Status and select Enabled to filter out instances with audit enabled.
4. Locate the target instance in the audit instance list (you can also quickly find it by filtering with resource attributes in the search box). In its operation column, click View Audit Log to go to the audit logs page, where you can view the audit logs for the corresponding instance.
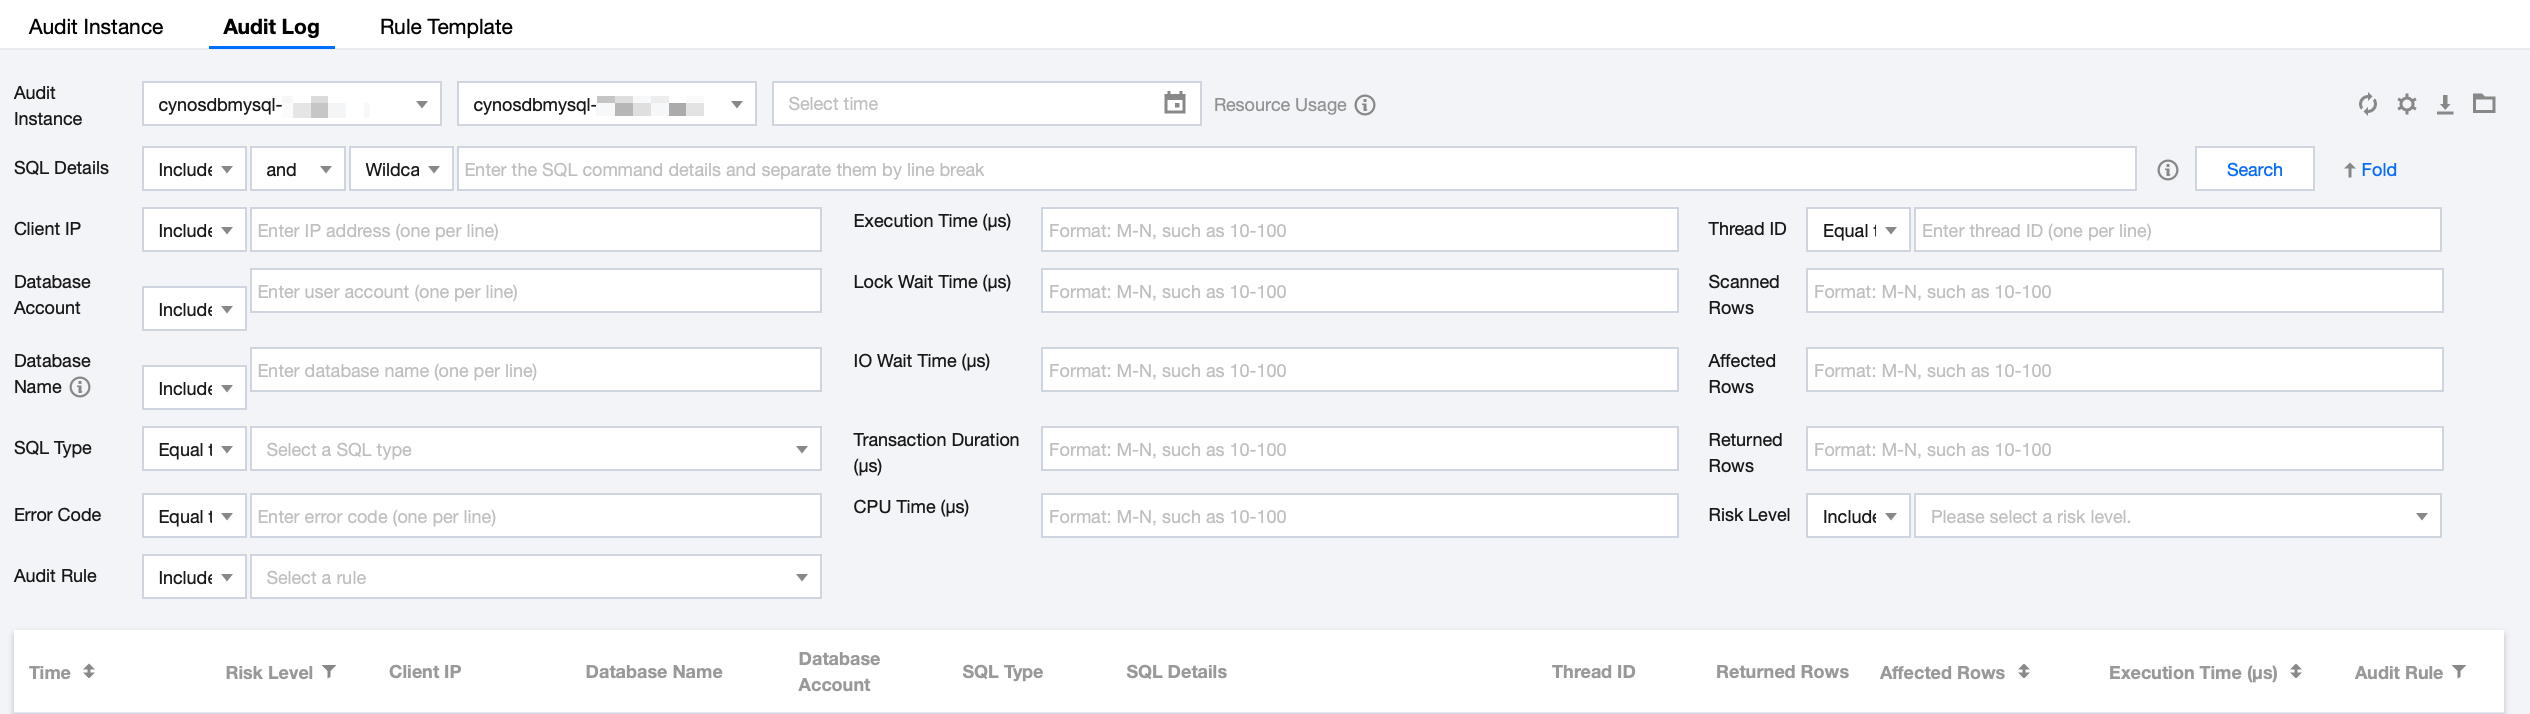
Tool List
Tool | Description |
Refreshing | Click  |
Customize List Fields | Click  |
Download | Click  |
File List | Click  Currently, only Tencent Cloud private network addresses are provided for downloading log files. You can download files via a Tencent Cloud CVM instance in the same region. (For example, to download the audit logs of a database instance in the Beijing region, use a CVM instance in the Beijing region.) Log files are valid for 24 hours. You should download them promptly. The number of log files for each database instance should not exceed 30. You need to delete the log files after download. If the displayed status is Failed, there may be too many logs. You can narrow the time range to download log files in batches. |
Filtering and Search Conditions
In the Audit Instance Filter box, you can select and switch to other audit instances that have the audit service enabled.
In the Time box, the last 1 hour is selected by default. You can quickly select other time ranges (such as the last 3 hours, 24 hours, or 7 days) or customize a time period. You can then view the related audit logs for the selected time period.
Note:
The search function allows you to select any time period for which data exists. A maximum of the first 60,000 matching records are displayed.
In the search box, select search conditions, such as SQL command details, client IP address, user account, database name, table name, error code, SQL type, risk level, execution time (μs), lock wait time (μs), I/O wait time (ns), transaction duration (μs), CPU time (μs), audit rule, thread ID, transaction ID, number of scanned rows, number of affected rows, and number of returned rows, and perform search to view related audit logs. Separate multiple keywords by line breaks.
Search Field | Matching Item | Description |
SQL Details | Include-OR-Segment | Rule Description Enter the SQL command details. Separate multiple keywords by line breaks. The matching items in the SQL command details search box are divided into three layers. The first layer sets the positive/negative matching mode (include, exclude). The second layer sets the logical relationship between keywords (OR, AND). The third layer sets the matching mode for each keyword (word segmentation, wildcard). Attention: The search for SQL command details is case-insensitive. It supports two positive/negative matching modes: "include" and "exclude". The search supports two logical operators between keywords: OR and AND. The OR operator represents a union relationship between different keywords, while the AND operator represents an intersection relationship. Each keyword supports two matching modes: word segmentation and wildcard. Word segmentation means each keyword in the SQL command details must be matched exactly, while wildcard means each keyword can be matched with a fuzzy pattern. Example Description Assume that the SQL command details are: SELECT * FROM test_db1 join test_db2 LIMIT 1; In the "include (word segmentation)" search mode, you can search using word segmentation keywords such as "SELECT", "select * from", "*", "SELECT * FROM test_db1 join test_db2 LIMIT 1;", and "from Test_DB1". However, you cannot search using wildcard keywords such as "SEL", "sel", and "test". In the "include (wildcard)" search mode, you can search using wildcard keywords such as "SEL", "sel", "test", and "DB". In the "include (AND)" search mode, the relationship between multiple keywords is AND. For example, if you enter keywords such as "SELECT" and "test_db", you can query all SQL commands that contain both "SELECT" and "test_db". In the "include (OR)" search mode, the relationship between multiple keywords is OR. For example, if you enter keywords such as "test_db1" and "test_db2", you can query all SQL commands that contain either "test_db1" or "test_db2". |
| Include-AND-Segment | |
| Exclude-AND-Segment | |
| Include-OR-Wildcard | |
| Include-AND-Wildcard | |
| Exclude-AND-Wildcard | |
Client IP | Include Exclude Equal to Not equal to | Enter the client IP address. Separate multiple keywords with line breaks. The asterisk (*) can be used as a wildcard for filtering IP addresses. For example, if you search for client IP address: 9.223.23.2*, it will match IP addresses starting with 9.223.23.2. |
User Account | IncludeExcludeEqual toNot equal to | Enter the user account. Separate multiple keywords with line breaks. |
Database Name | IncludeExcludeEqual toNot equal to | Enter the database name. Separate multiple keywords with line breaks. Note: The search for database names is case-insensitive. |
Table Name | Equal to Not equal to | Enter the table name. The search instructions for the table name are as follows: It is case-insensitive. The search format is DbName.TableName. For example, the database test_db contains a table named test_table. To search for the table test_table, you need to enter: Table Name Equals test_db.test_table. Note: A maximum of 64 table names can be recorded. The field "Table Name" is supported in TXSQL 2.1.13 and later versions, as well as TXSQL 3.1.15 and later versions. It is not supported in other versions. If you need this support, upgrade to a supported version. |
Error Code | Equal to Not equal to | Enter the error code. Separate multiple keywords with line breaks. |
SQL Type | Equal to Not equal to | Select an SQL type from the drop-down list. Available types: ALTER, CHANGEUSER, CREATE, DELETE, DROP, EXECUTE, INSERT, LOGOUT, OTHER, REPLACE, SELECT, SET, UPDATE, and PREPARE. Multiple types can be selected at the same time. Note: The SQL type "PREPARE" is supported only in TXSQL 5.7 2.1.11 and later versions, as well as TXSQL 8.0 3.1.11 and later versions. You can upgrade to supported versions if needed. |
Risk Level | Include Exclude | Select Low, Medium, or High risk to filter audit logs that match the risk level configured in the rule template. It also supports leaving the input blank, which filters historical audit logs that are not tagged with a risk level. |
Execution Time (microseconds) | Range format | Enter the execution time in the format M-N, for example, 10-100 or 20-200. |
Lock Waiting Time (microseconds) | Range format | Enter the lock waiting time in the format M-N, for example, 10-100 or 20-200. |
I/O Waiting Time (nanoseconds) | Range format | Enter the IO waiting time in the format M-N, for example, 10-100 or 20-200. |
Transaction Duration (microseconds) | Range format | Enter the transaction duration in the format M-N, for example, 10-100 or 20-200. |
CPU Time (microseconds) | Range format | Enter the CPU time in the format M-N, for example, 10-100 or 20-200. |
Audit Rule | Include Exclude | Displays the template ID and name for each rule template in the selected region. You can filter audit logs to show only those that match a specific rule template. It also supports leaving the input blank, which filters historical audit logs that are not tagged with an audit rule and all audit logs that do not match any rule. Audit rules can be searched by rule template ID or name. Multiple rule templates can be selected simultaneously. |
Thread ID | Equal to Exclude | Enter the thread ID. Separate multiple keywords with line breaks. |
Transaction ID | Equal to Not equal to | Enter the transaction ID. Separate multiple keywords with line breaks. Note: The field "Transaction ID" is supported in TXSQL 2.1.11 and later versions, as well as TXSQL 3.1.15 and later versions. It is not supported in other versions. If you need this support, upgrade to a supported version. A transaction ID is generated only after INSERT, UPDATE, or DELETE operations are performed within an explicit transaction. Implicit transactions do not have transaction IDs. |
Scanned Rows | Range format | Enter the number of scanned rows in the format M-N, for example, 10-100 or 20-200. |
Affected Rows | Range format | Enter the number of affected rows in the format M-N, for example, 10-100 or 20-200. |
Returned Rows | Range format | Enter the number of returned rows in the format M-N, for example, 10-100 or 20-200. |
Audit Fields
The audit logs of TDSQL-C for MySQL support the following fields.
No. | Field Name | Supported Kernel Version | Field Description |
1 | Time | TXSQL 5.7 ≥ 2.0.15 TXSQL 8.0 ≥ 3.0.1 | Records the start time of the operation (SQL statement execution). |
2 | Risk Level | - | Indicates the risk level of the operation, which is categorized as low, medium, or high. For full auditing, logs that do not hit any audit rule will display a risk level of "-". |
3 | Client IP | TXSQL 5.7 ≥ 2.0.15 TXSQL 8.0 ≥ 3.0.1 | The IP address of the client that initiates database operations. |
4 | Database Name | TXSQL 5.7 ≥ 2.0.15 TXSQL 8.0 ≥ 3.0.1 | Name of the database involved in the operation. |
5 | User Account | TXSQL 5.7 ≥ 2.0.15 TXSQL 8.0 ≥ 3.0.1 | User account that performs the operation. |
6 | SQL Type | TXSQL 5.7 ≥ 2.0.15 TXSQL 8.0 ≥ 3.0.1 | Type of the SQL statement, such as SELECT, INSERT, UPDATE, DELETE, and so on. |
7 | SQL Details | TXSQL 5.7 ≥ 2.0.15 TXSQL 8.0 ≥ 3.0.1 | The specific text of the executed SQL command. |
8 | Error Code | TXSQL 5.7 ≥ 2.0.15 TXSQL 8.0 ≥ 3.0.1 | When an error is encountered during SQL statement execution, an error code is generated. The error code is an integer used to identify a specific error type, where 0 indicates success. |
9 | Thread ID | TXSQL 5.7 ≥ 2.0.15 TXSQL 8.0 ≥ 3.0.1 | Each client connected to the database has a unique thread ID. This ID is used to identify which client performed a specific operation. |
10 | Transaction ID | TXSQL 5.7 ≥ 2.1.13 TXSQL 8.0 ≥ 3.1.15 | In a storage engine that supports transactions (such as InnoDB), each transaction has a unique transaction ID. This ID is used to identify a specific transaction. |
11 | Scanned Rows | TXSQL 5.7 ≥ 2.0.15 TXSQL 8.0 ≥ 3.0.1 | The number of rows scanned by the database during query execution. This number helps you understand the efficiency of the query. |
12 | Returned Rows | TXSQL 5.7 ≥ 2.0.15 TXSQL 8.0 ≥ 3.0.1 | The number of rows returned by the query result. This number helps you understand the size of the query result set. |
13 | Affected Rows | TXSQL 5.7 ≥ 2.0.15 TXSQL 8.0 ≥ 3.0.1 | The number of rows actually affected when modification operations are performed (such as INSERT, UPDATE, DELETE) on a data table. This number helps you understand the scope of impact of the operation. |
14 | Execution Time (μs) | TXSQL 5.7 ≥ 2.0.15 TXSQL 8.0 ≥ 3.0.1 | The time taken for an SQL statement to execute from start to finish, measured in microseconds. This number helps you understand the performance of the query. |
15 | CPU Time (μs) | TXSQL 5.7 ≥ 2.0.15 TXSQL 8.0 ≥ 3.0.1 | The time consumed by an SQL statement executing on the CPU, measured in microseconds. This number helps you understand the CPU usage of the query. |
16 | Lock Wait Time (μs) | TXSQL 5.7 ≥ 2.0.15 TXSQL 8.0 ≥ 3.0.1 | The time spent waiting to obtain a database lock, measured in microseconds. This number helps you understand the lock contention of the query. |
17 | IO Wait Time (ns) | TXSQL 5.7 ≥ 2.0.15 TXSQL 8.0 ≥ 3.0.1 | The time spent waiting for I/O operations to complete, measured in nanoseconds. This number helps you understand the I/O performance of the query. |
18 | Transaction Duration (μs) | TXSQL 5.7 ≥ 2.0.15 TXSQL 8.0 ≥ 3.0.1 | The total time taken for a transaction from start to commit or rollback, measured in microseconds. This number helps you understand the performance of the transaction. |
19 | Audit Rule | TXSQL 5.7 ≥ 2.0.15 TXSQL 8.0 ≥ 3.0.1 | Shows which rule template the audit log matches. Click the corresponding rule template to view its detailed information, including basic information, parameter settings, and modification history. For historical audit logs, the value of the audit rule is displayed as "-". For audit logs that do not match any rule, the value of the audit rule is displayed as "-". |
20 | Table Name | TXSQL 5.7 ≥ 2.1.13 TXSQL 8.0 ≥ 3.1.15 | Names of specific data tables involved in the operation (if any). |
21 | Client Port | TXSQL 5.7 ≥ 2.1.13 TXSQL 8.0 ≥ 3.1.16 | The port number of the client that initiates database operations. |
Relationship Between SQL Statement Types and SQL Statement Mapping Objects
No. | SQL Statement Type | SQL Statement Mapping Object |
0 | OTHER | All SQL statement types except those listed below. |
1 | SELECT | SQLCOM_SELECT |
2 | INSERT | SQLCOM_INSERT,SQLCOM_INSERT_SELECT |
3 | UPDATE | SQLCOM_UPDATE,SQLCOM_UPDATE_MULTI |
4 | DELETE | SQLCOM_DELETE,SQLCOM_DELETE_MULTI,SQLCOM_TRUNCATE |
5 | CREATE | SQLCOM_CREATE_TABLE,SQLCOM_CREATE_INDEX,SQLCOM_CREATE_DB,SQLCOM_CREATE_FUNCTION,SQLCOM_CREATE_USER,SQLCOM_CREATE_PROCEDURE,SQLCOM_CREATE_SPFUNCTION,SQLCOM_CREATE_VIEW,SQLCOM_CREATE_TRIGGER,SQLCOM_CREATE_SERVER,SQLCOM_CREATE_EVENT,SQLCOM_CREATE_ROLE,SQLCOM_CREATE_RESOURCE_GROUP,SQLCOM_CREATE_SRS |
6 | DROP | SQLCOM_DROP_TABLE,SQLCOM_DROP_INDEX,SQLCOM_DROP_DB,SQLCOM_DROP_FUNCTION,SQLCOM_DROP_USER,SQLCOM_DROP_PROCEDURE,SQLCOM_DROP_VIEW,SQLCOM_DROP_TRIGGER,SQLCOM_DROP_SERVER,SQLCOM_DROP_EVENT,SQLCOM_DROP_ROLE,SQLCOM_DROP_RESOURCE_GROUP,SQLCOM_DROP_SRS |
7 | ALTER | SQLCOM_ALTER_TABLE,SQLCOM_ALTER_DB,SQLCOM_ALTER_PROCEDURE,SQLCOM_ALTER_FUNCTION,SQLCOM_ALTER_TABLESPACE,SQLCOM_ALTER_SERVER,SQLCOM_ALTER_EVENT,SQLCOM_ALTER_USER,SQLCOM_ALTER_INSTANCE,SQLCOM_ALTER_USER_DEFAULT_ROLE,SQLCOM_ALTER_RESOURCE_GROUP |
8 | REPLACE | SQLCOM_REPLACE,SQLCOM_REPLACE_SELECT |
9 | SET | SQLCOM_SET_OPTION,SQLCOM_RESET,SQLCOM_SET_PASSWORD,SQLCOM_SET_ROLE,SQLCOM_SET_RESOURCE_GROUP |
10 | EXECUTE | SQLCOM_EXECUTE |
11 | LOGIN | Database login behavior, not constrained by audit rules, with login behavior recorded by default. |
12 | LOGOUT | Database logout behavior, not constrained by audit rules, with logout behavior recorded by default. |
13 | CHANGEUSER | User change behavior, not constrained by audit rules, with user change behavior recorded by default. |
14 | PREPARE | - |
Ajuda e Suporte
Esta página foi útil?
Você também pode entrar em contato com a Equipe de vendas ou Enviar um tíquete em caso de ajuda.
comentários