This document introduces data query operations using the Kibana and Curl command line methods.
Access Control
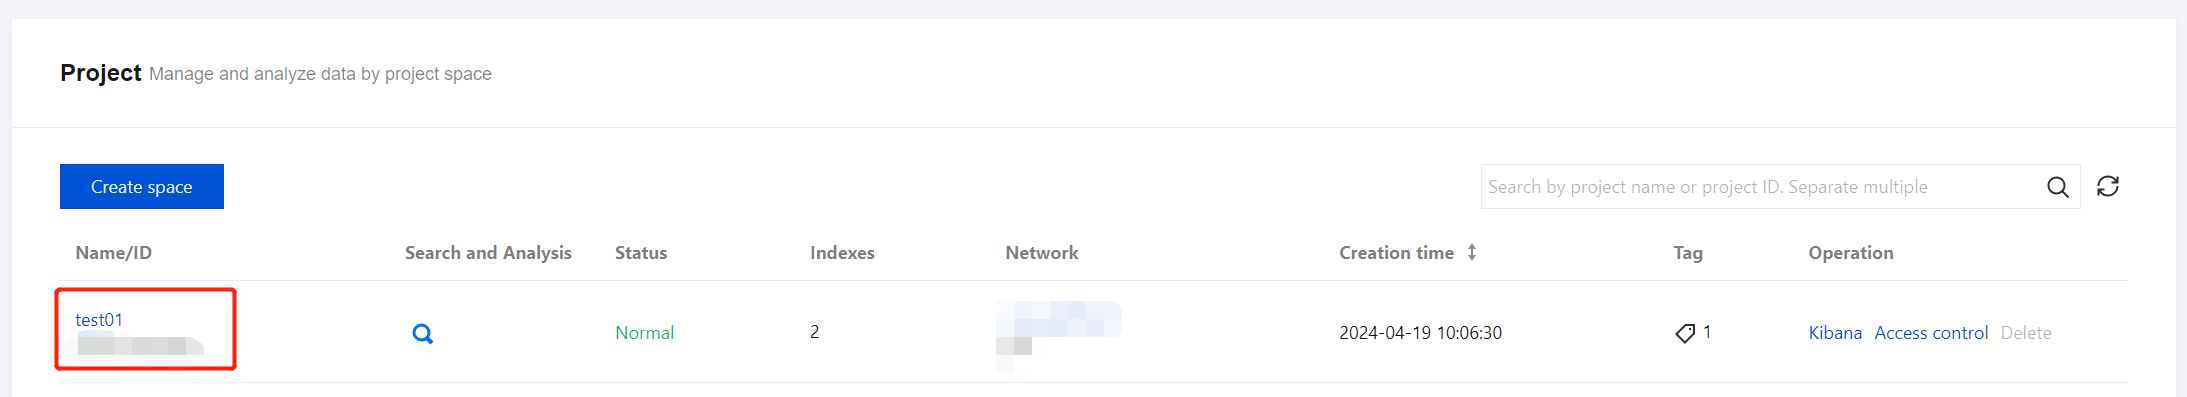
1. In the space list, click the corresponding Project Name/ID to enter the Basic Info page.
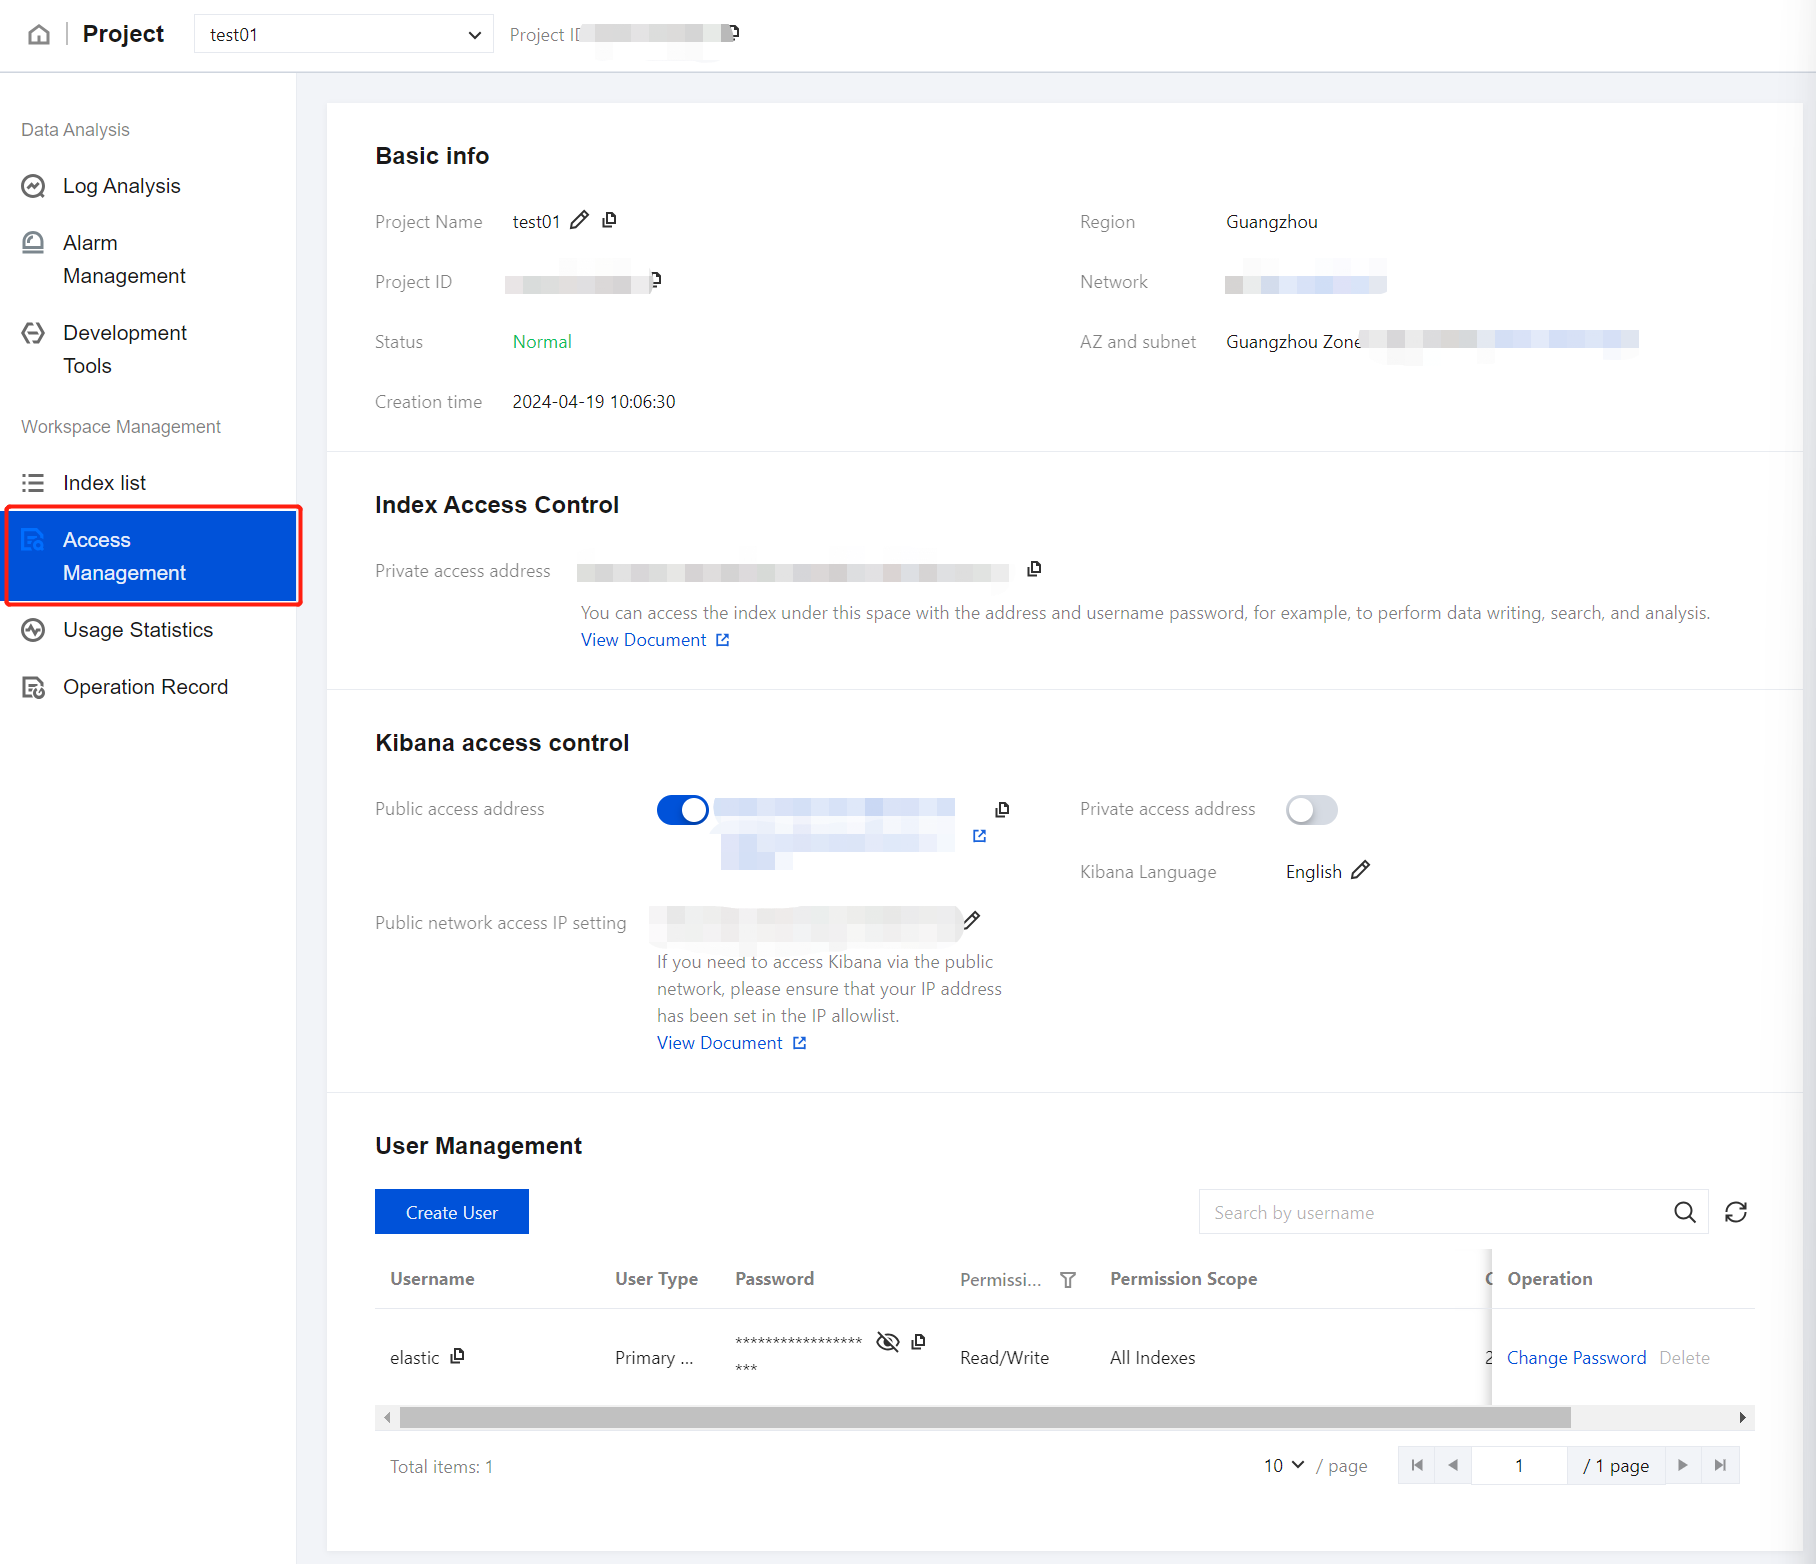
2. In the Index Access Control module, you can view the sub-user information (username, password, and permissions), private network access address, Kibana private network access address, and Kibana public network access address. You can also configure the Kibana public network access policy.
3. Access Kibana: The Discover and Dev Tools features of Kibana are embedded in the Tencent Cloud console, allowing you to use retrieval and analysis capabilities directly within the console or access Kibana via an external link.
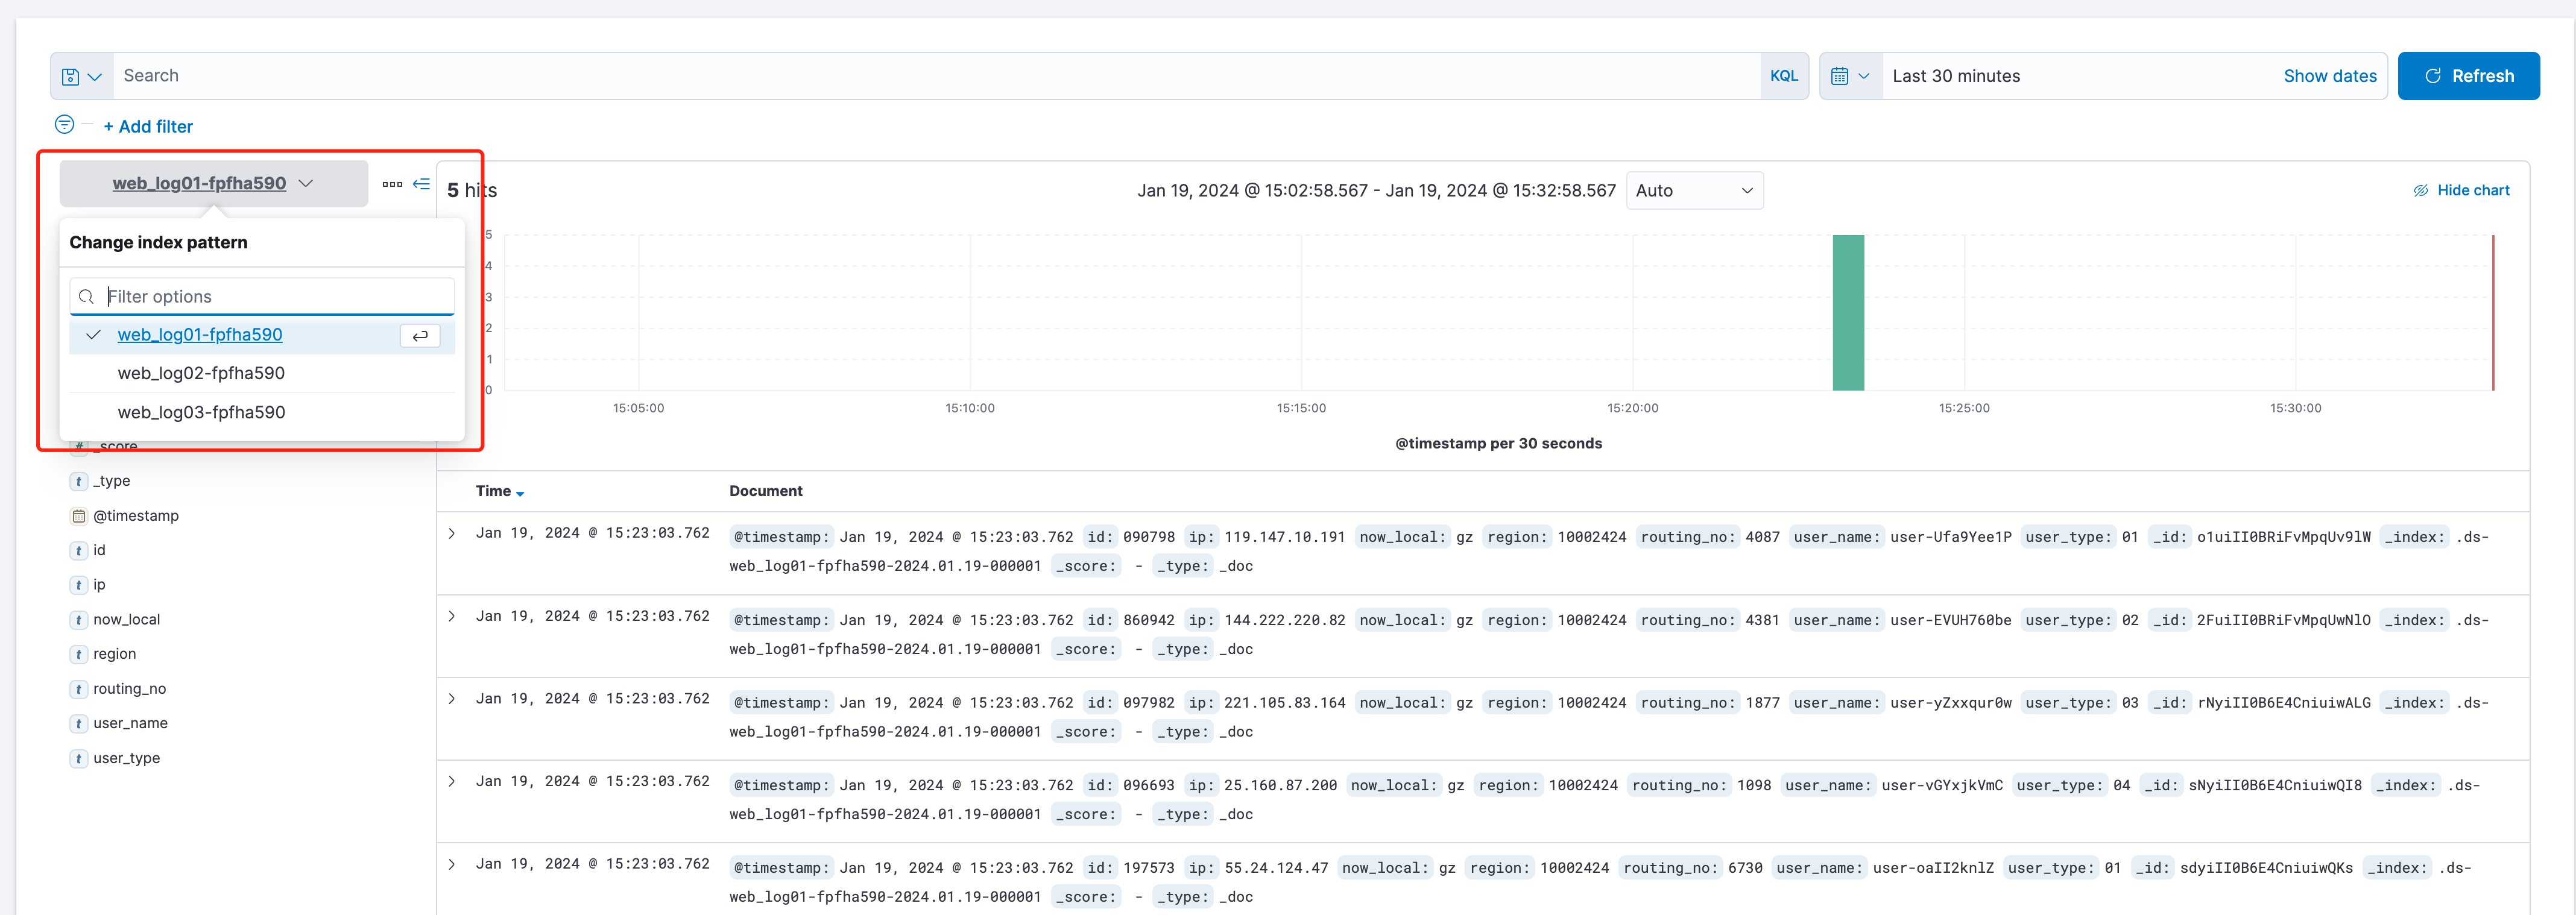
Via Console: Click Search and Analysis in the sidebar to enter the relevant page. You can switch between index views by clicking the index pattern dropdown on the left side. Log Search corresponds to Discover, and Development Tools corresponds to Dev Tools.
Note:
Embedded features require third-party cookies to be enabled in your browser. If you encounter any issue, please enable third-party cookie settings in your browser settings.
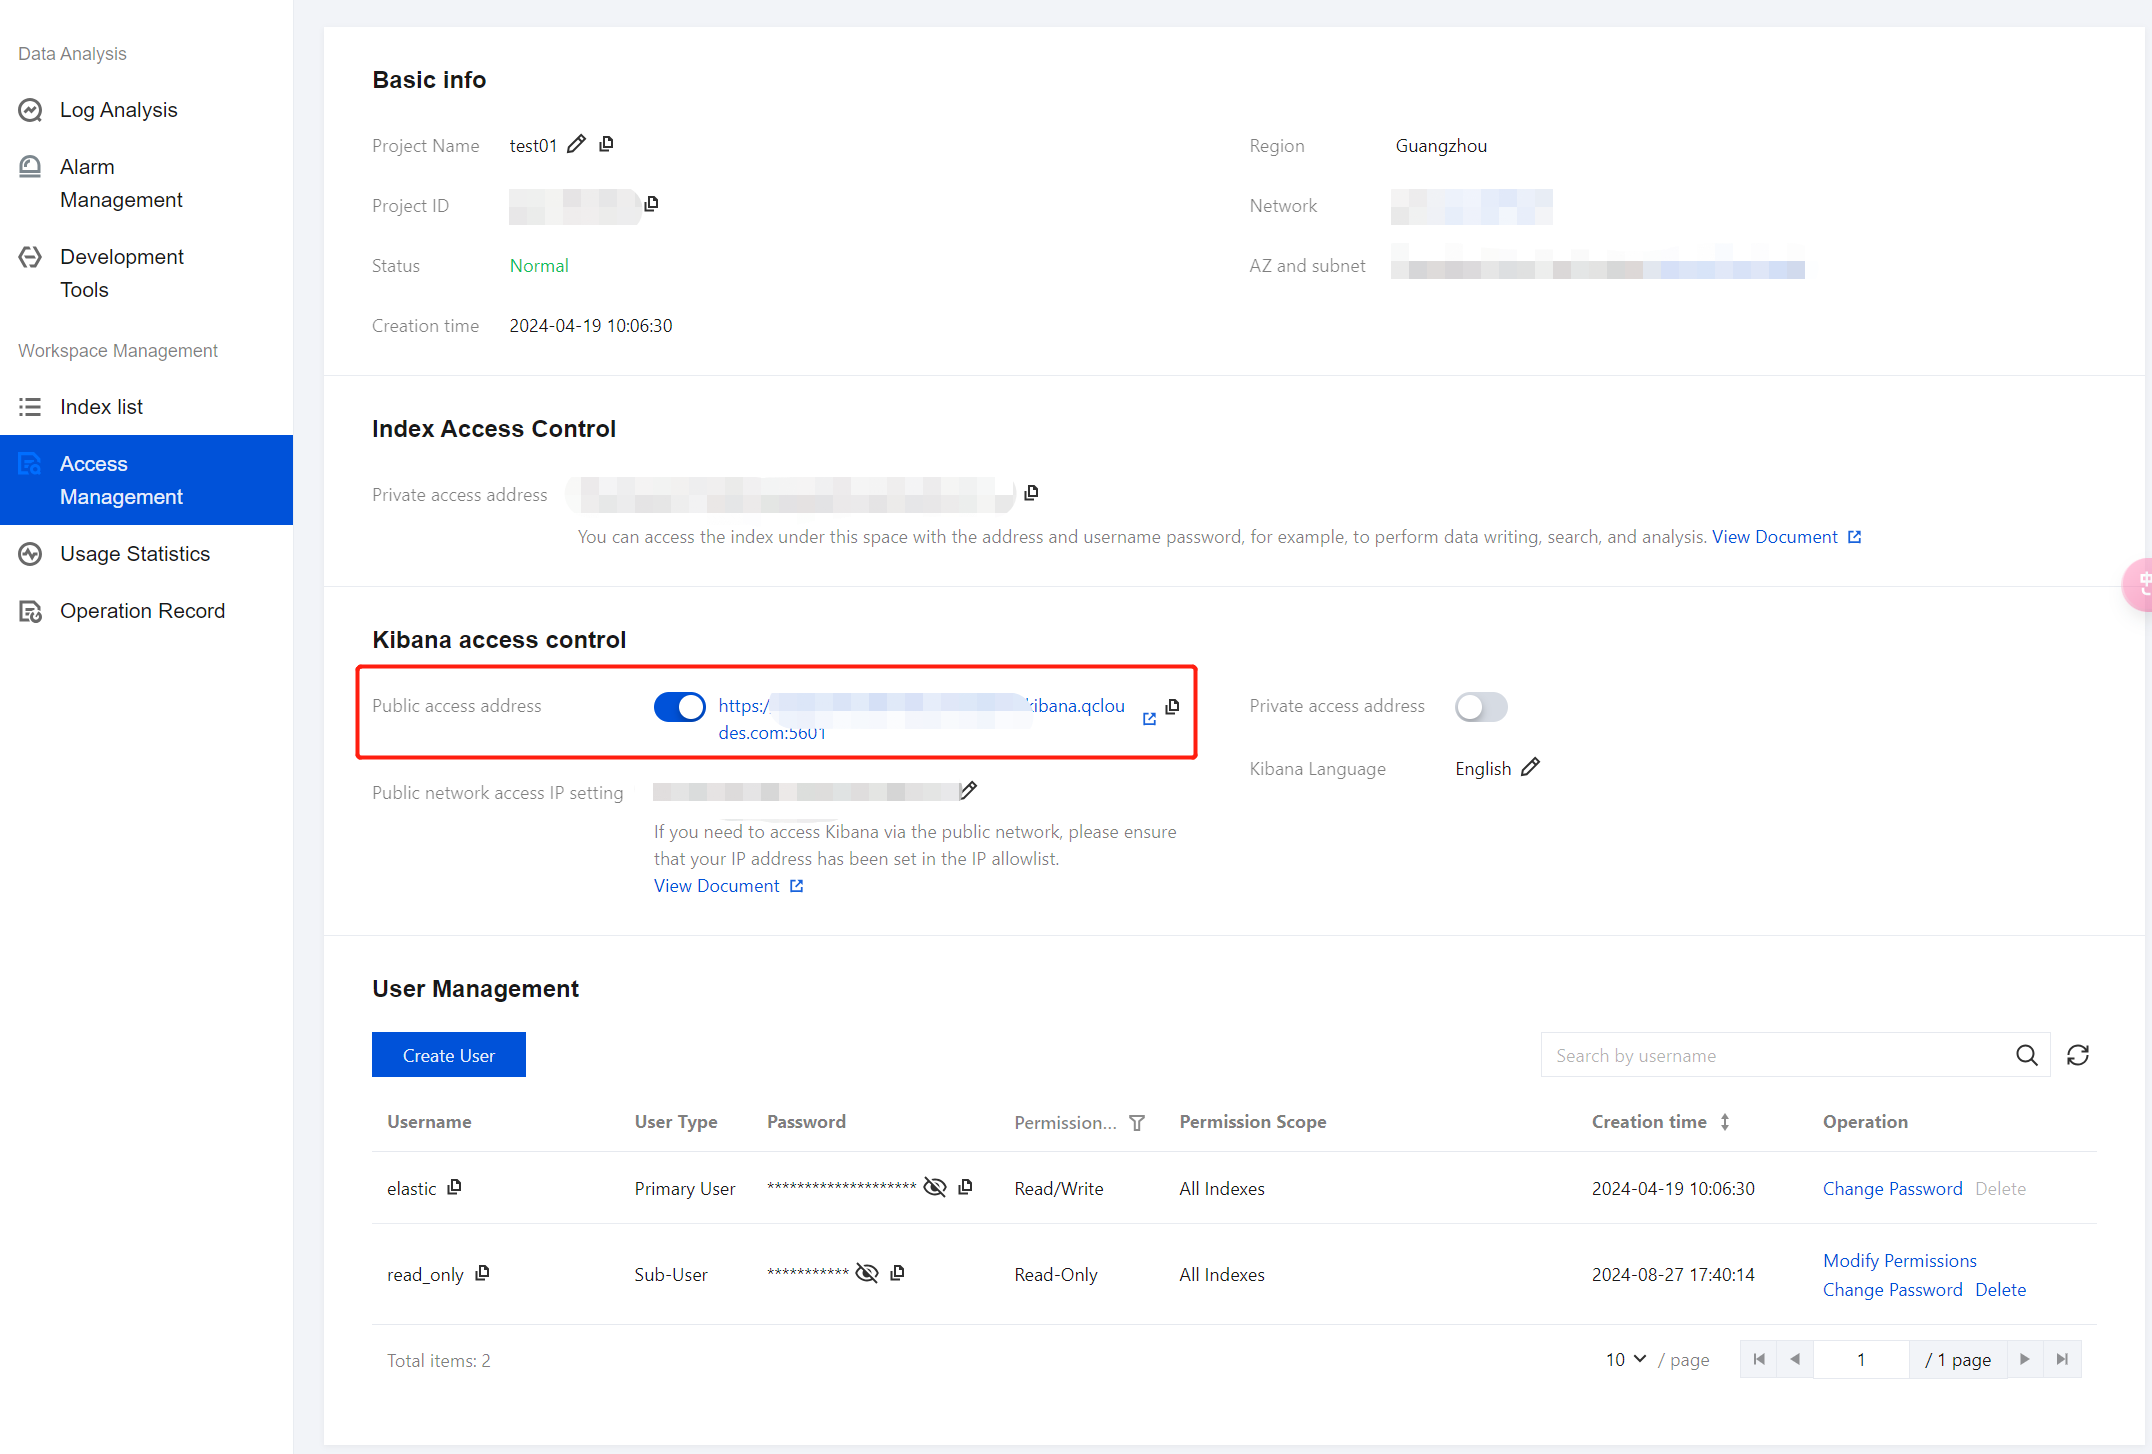
Via Kibana Public Access Address: Click Kibana public access address to enter the Kibana page.
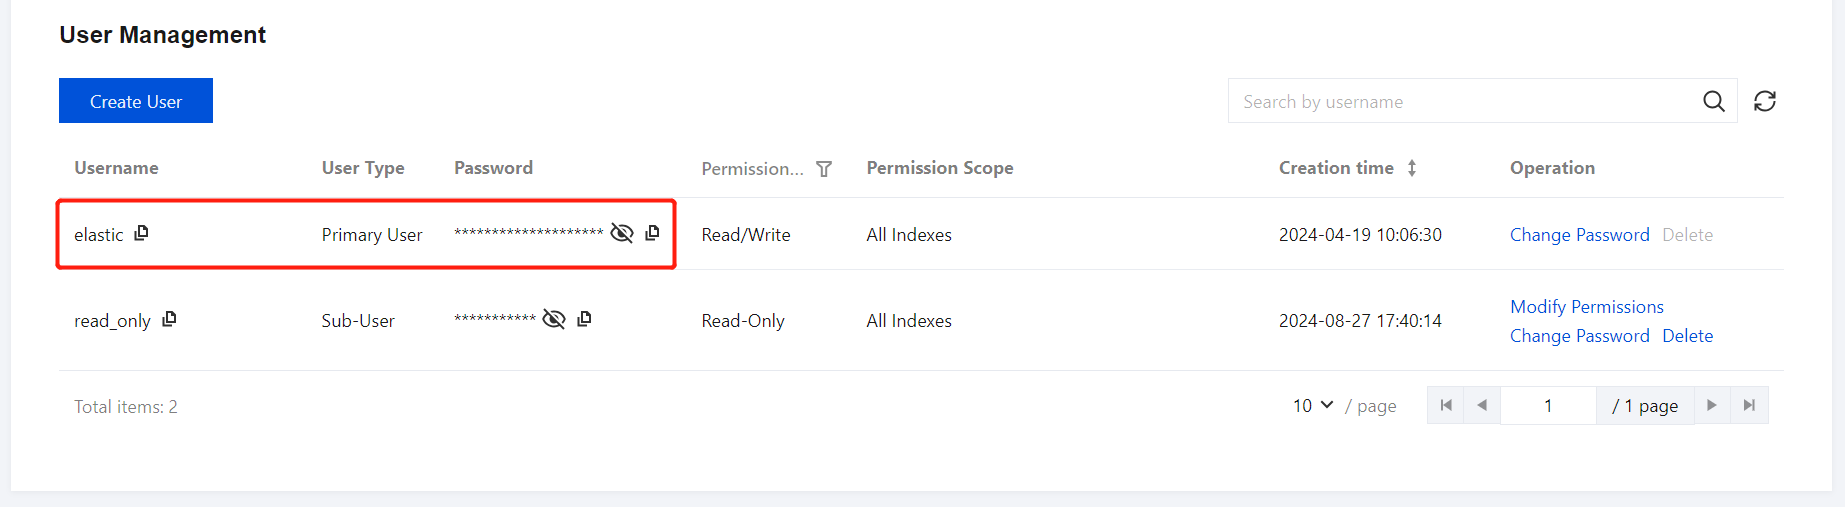
On the Kibana login page, enter the username and password, which can be copied directly from the user management page.
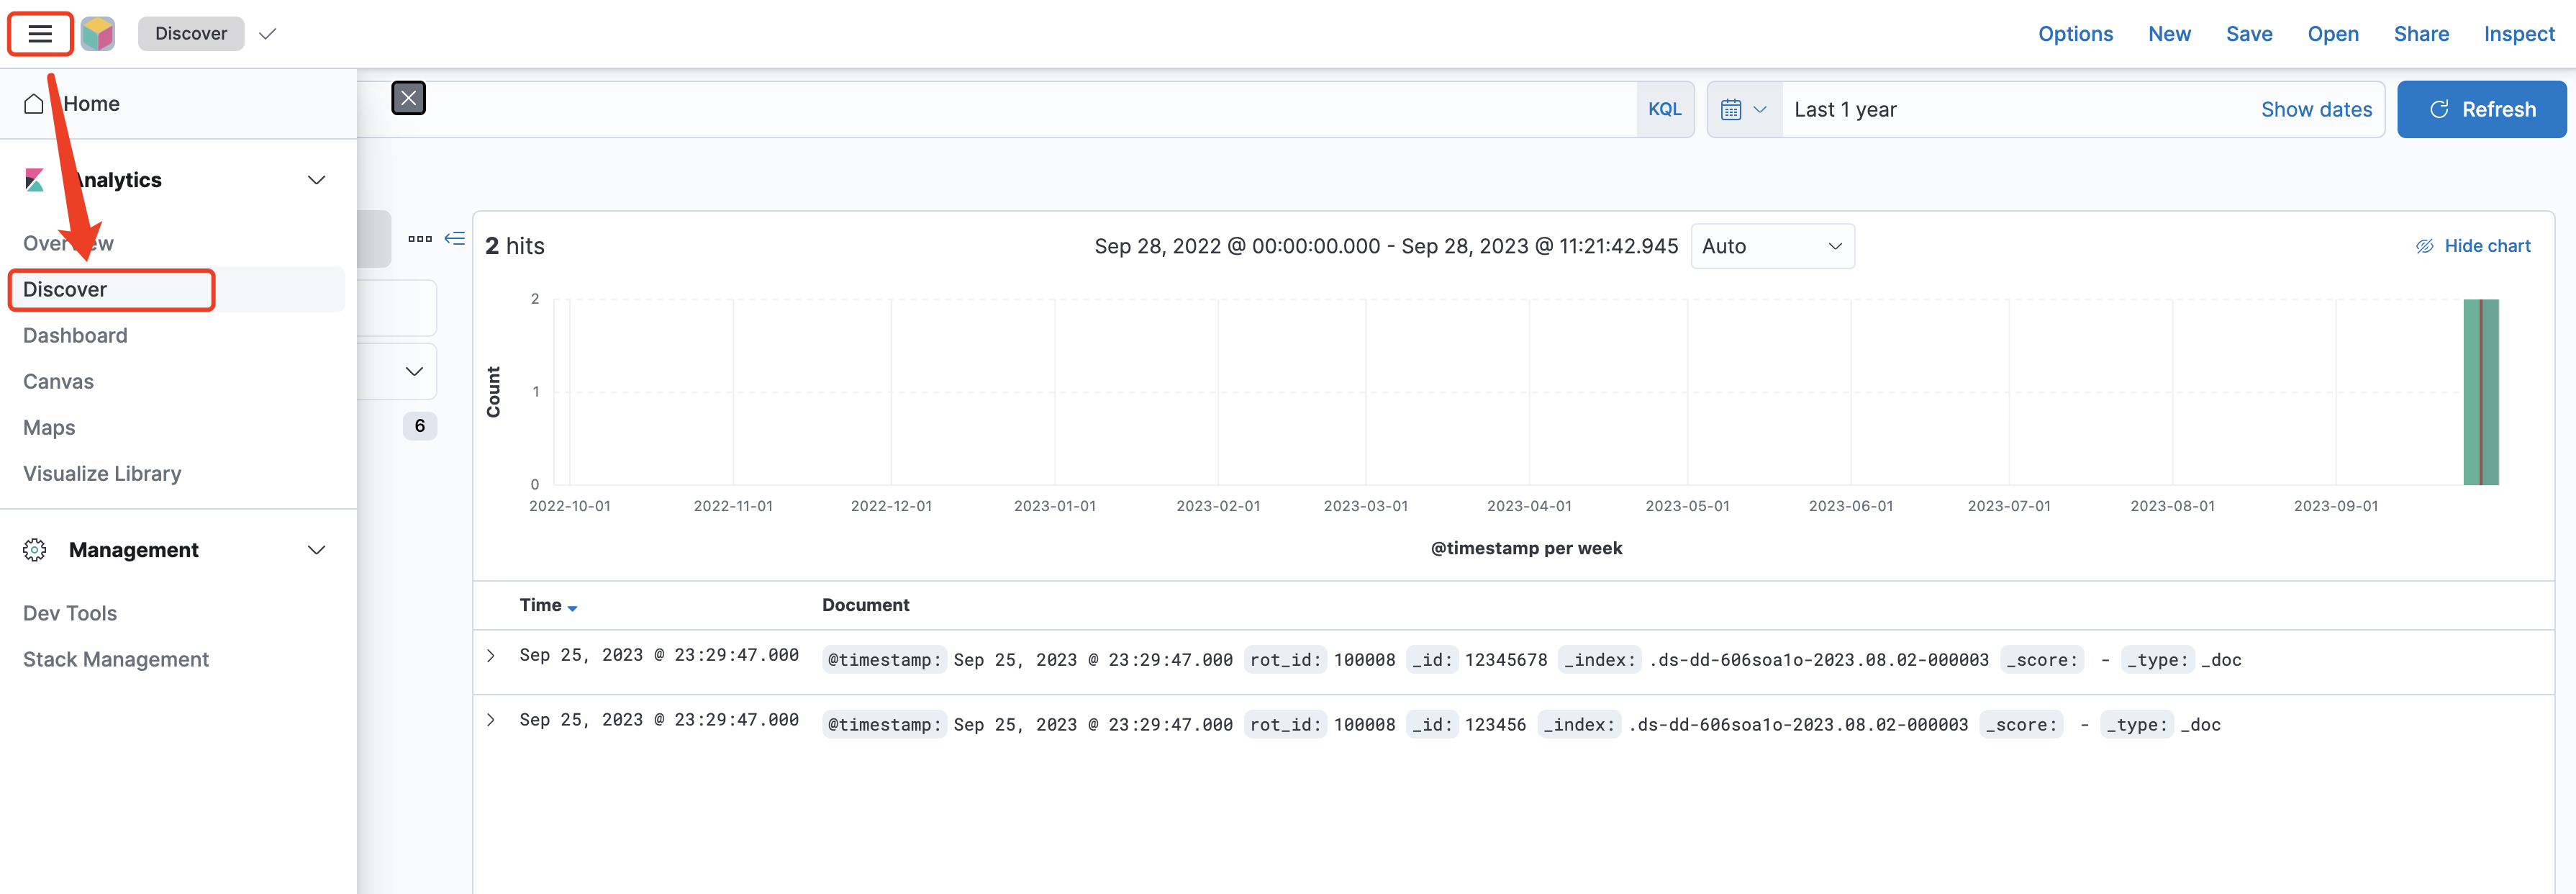
After entering the Kibana page, click the three-bar icon in the upper right corner, and select Discover to access the search and analysis page.
Note:
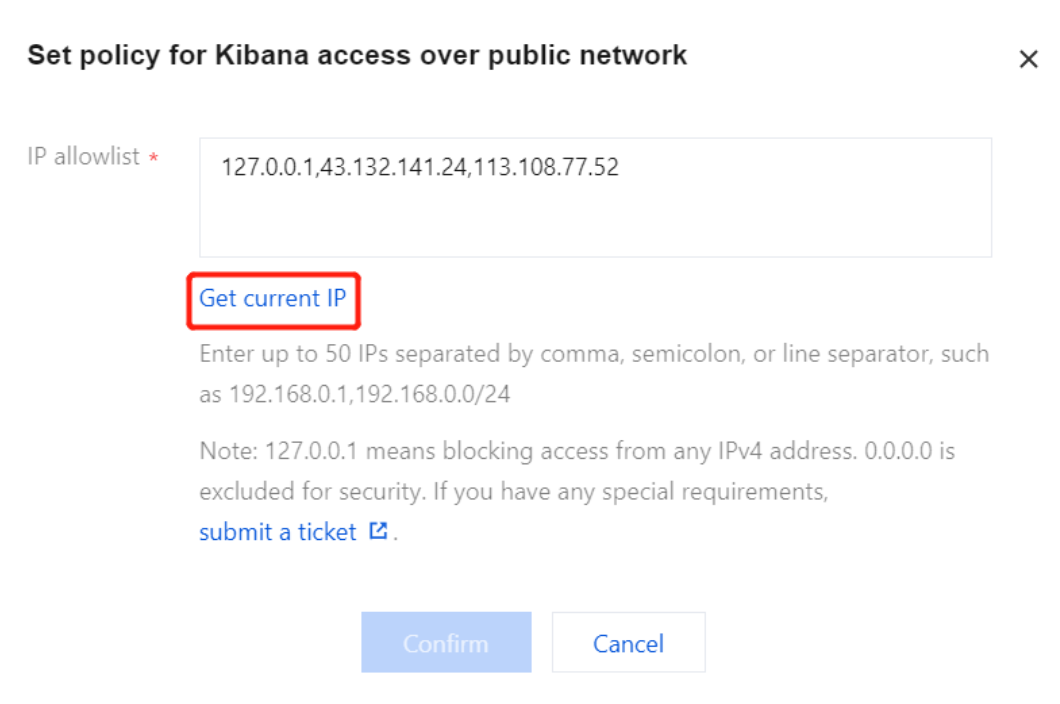
Kibana public network access includes an allowlist mechanism, meaning that IP addresses not included in the access policy cannot access Kibana, enhancing access security. If the page displays Sorry, you do not have permissions to access, you can click Kibana public network access policy as shown above. In the pop-up window, click Get current IP to enter your current IP address to the allowlist.
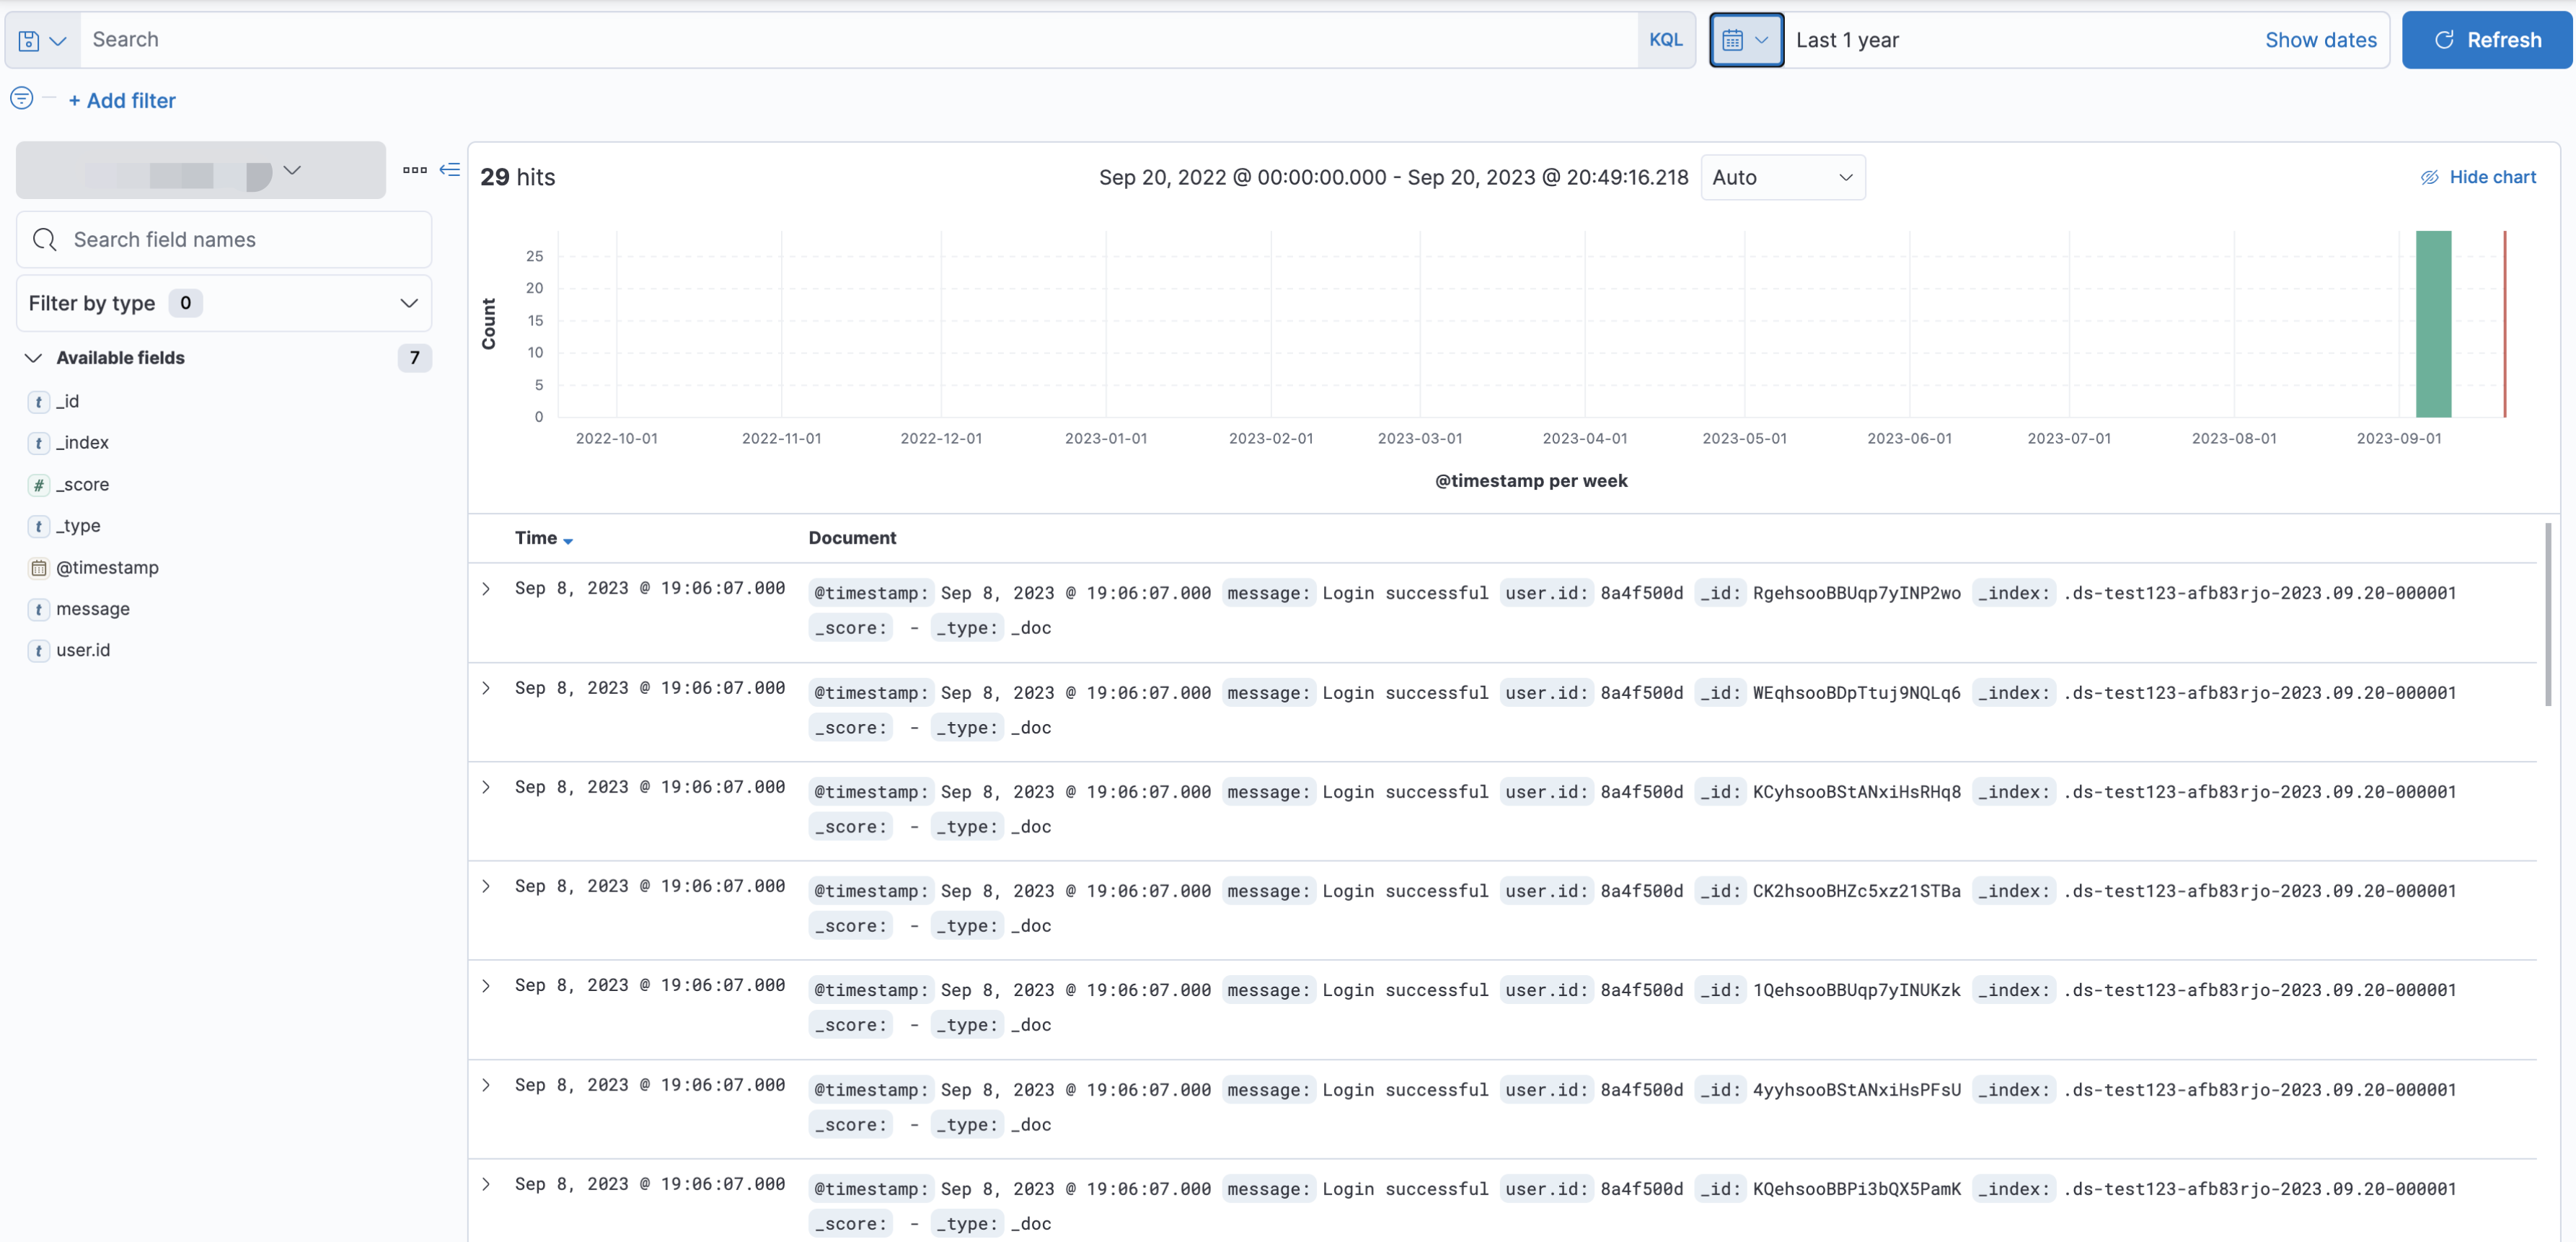
On the Discover page, you can perform time filtering, keyword searches, and other operations:
Via Dev Tools
Perform data queries using DSL. An example is as follows:
GET /index_name/_search
{
"query":{
"term":{
"user.id":"kimchy"
}
}
}
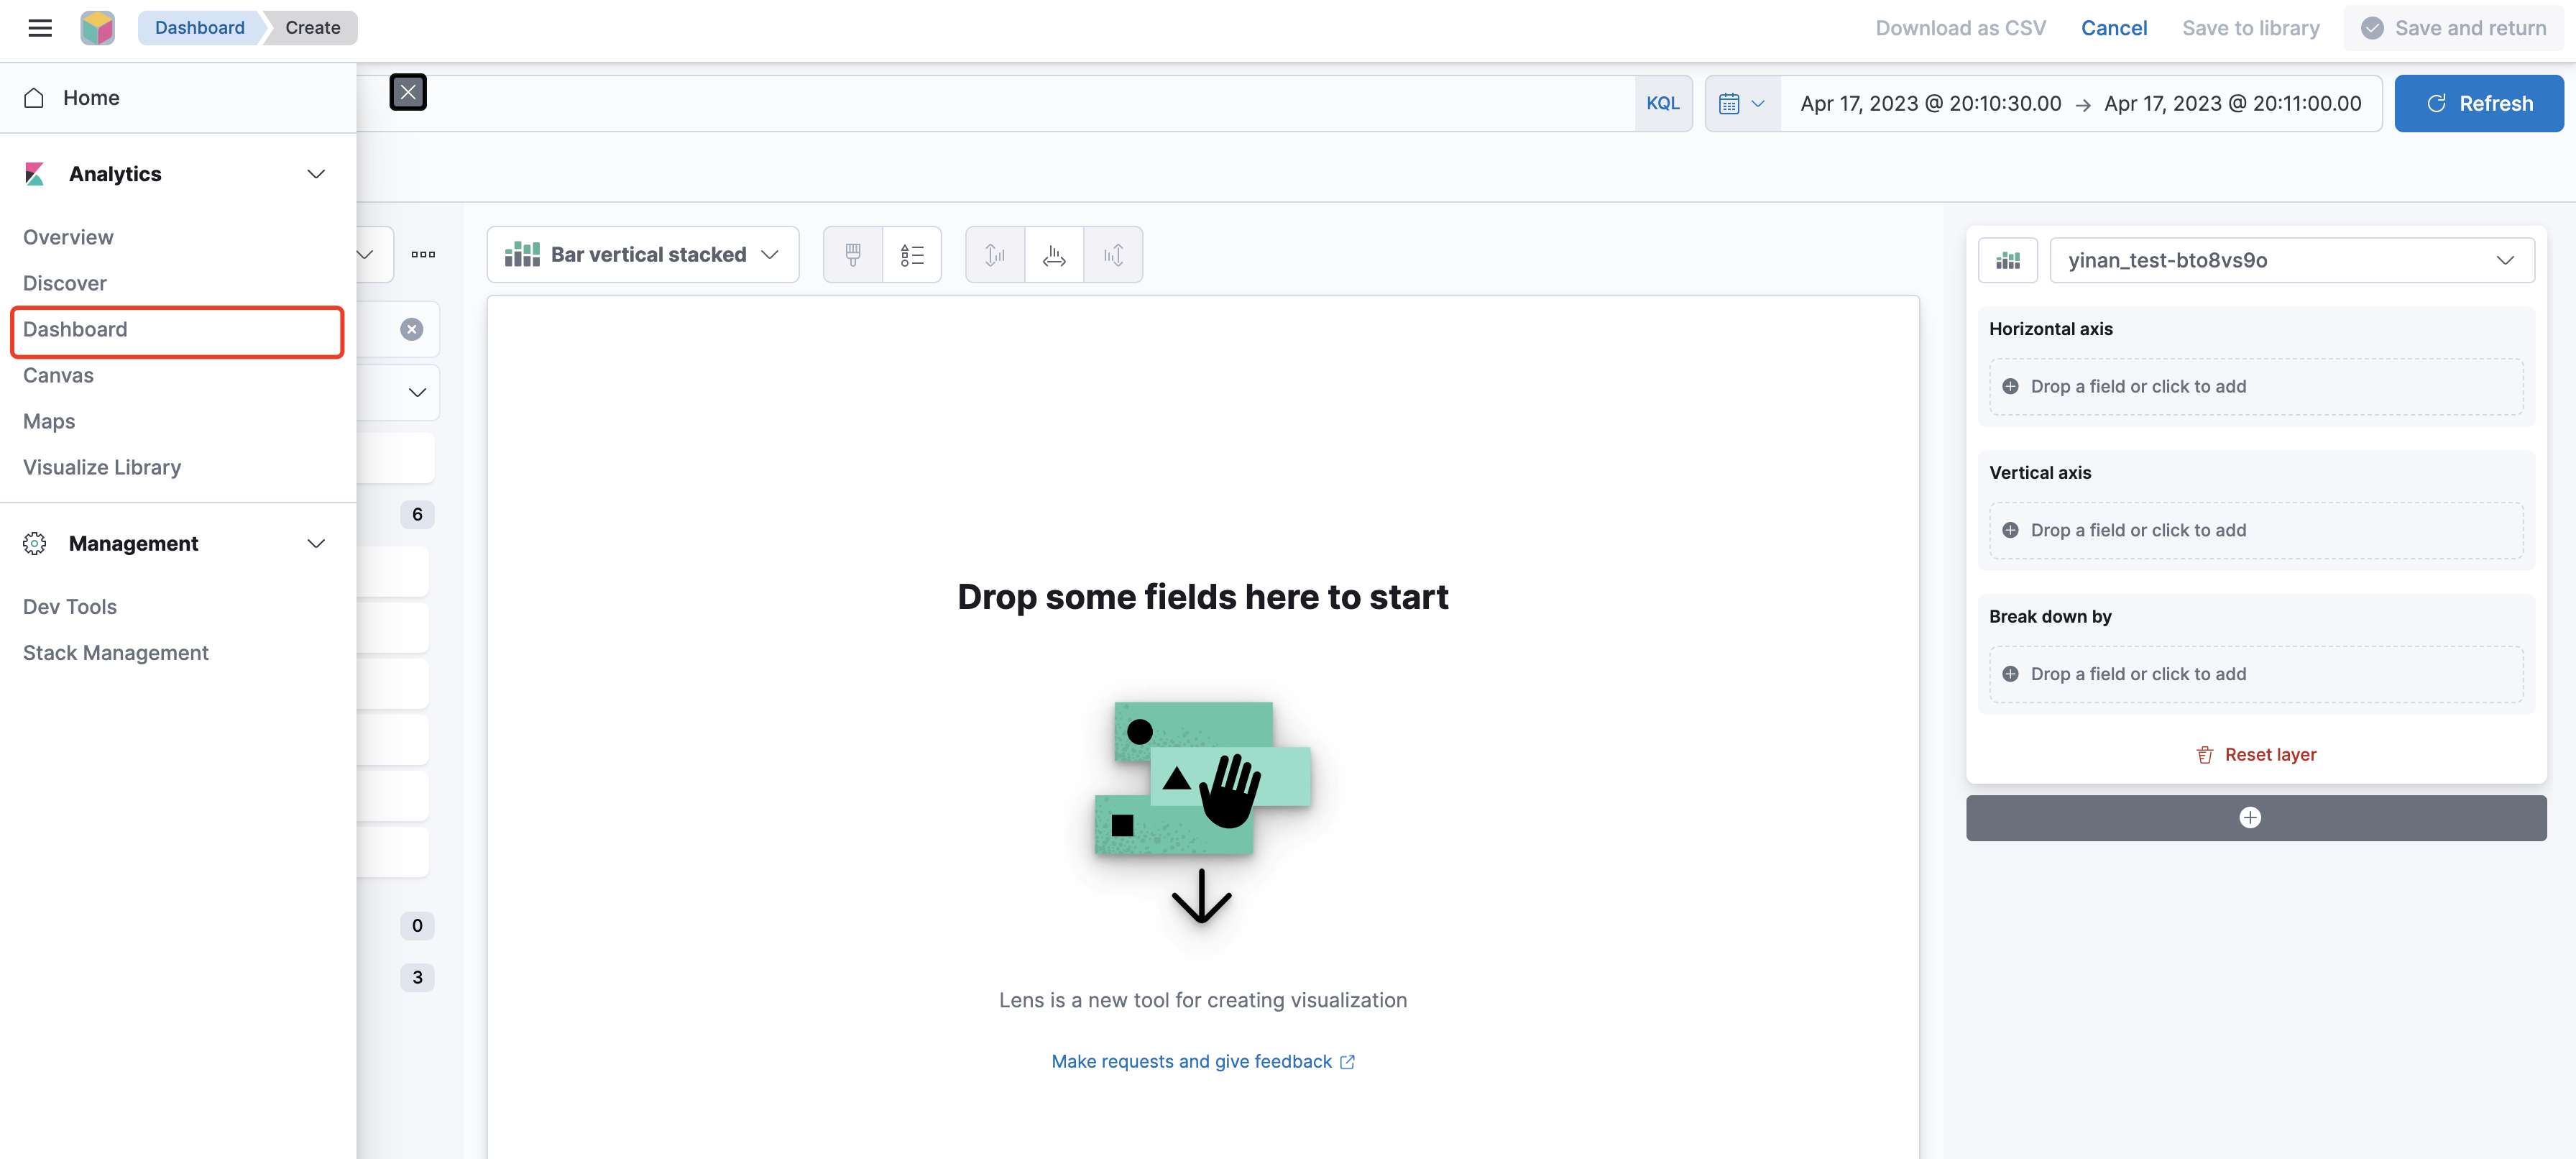
Via Kibana Dashboard
After entering Kibana, select Dashboard in the left sidebar to start data visualization. You can quickly create charts by dragging and dropping elements.