ES supports configuring alarms for key metrics, which can help you identify cluster problems and address them in a timely manner. This document describes how to configure alarms in the console.
Directions
Check whether alarms have been configured for a cluster
1. Log in to the ES Console and click a cluster ID/name in the cluster list to enter the cluster details page.
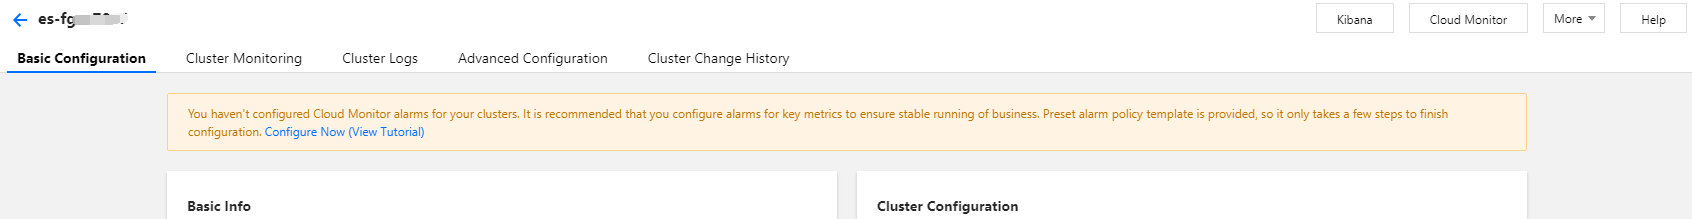
2. Select Cluster Monitoring. In the Alarm Configuration section, you can check whether alarms have been configured for the cluster. If not, you are recommended to configure an alarm policy to get notified of and address exceptions and risks in cluster running in a timely manner and ensure service stability.
Note:
You can also log in to the Cloud Monitor Console and check whether an alarm policy has been configure for a cluster in Alarm Configuration > Alarm Policy.
Customize alarm configuration
1. Log in to the Cloud Monitor Console and click Create on the Alarm Policy page.
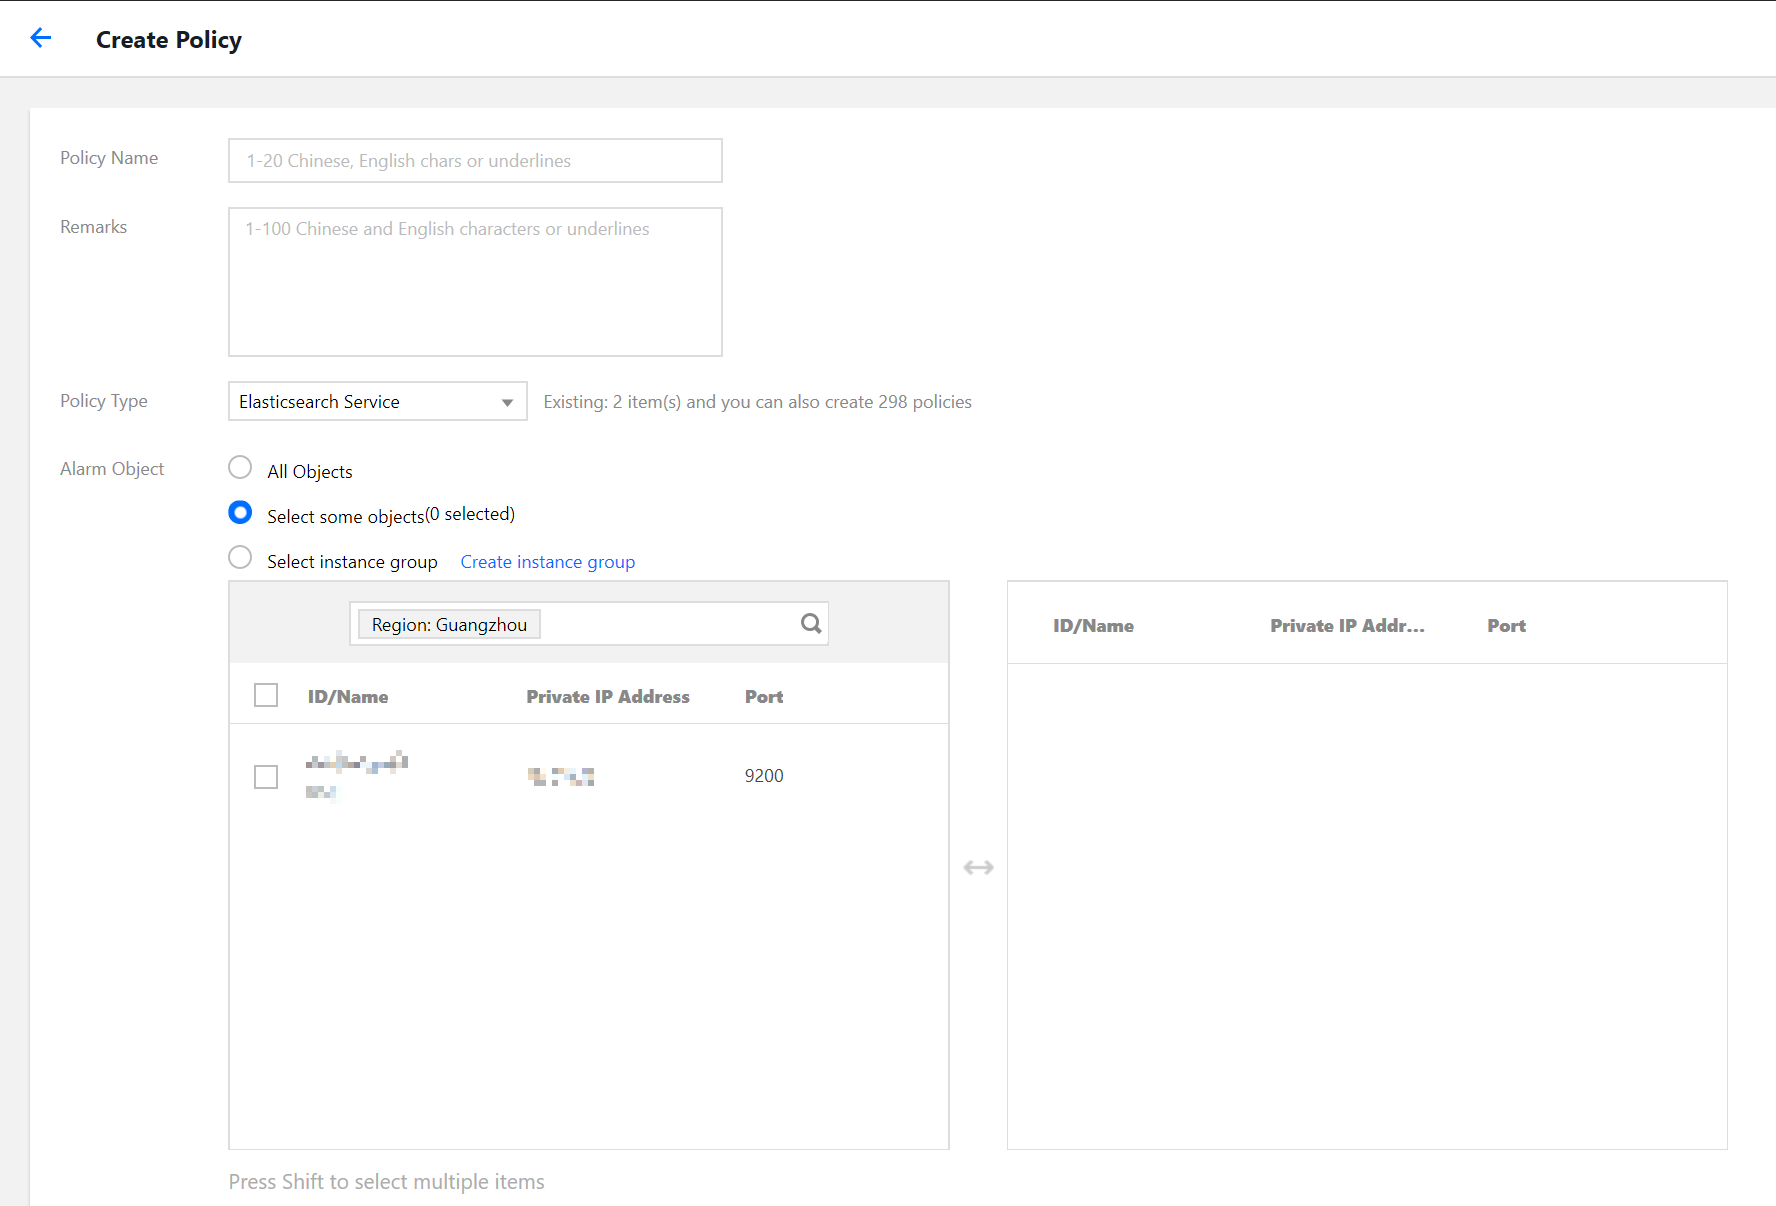
2. On the policy creating page, configure the policy parameters.
Policy Type: Select Elasticsearch Service.
Alarm Object: Select the cluster for which to configure the alarm policy.
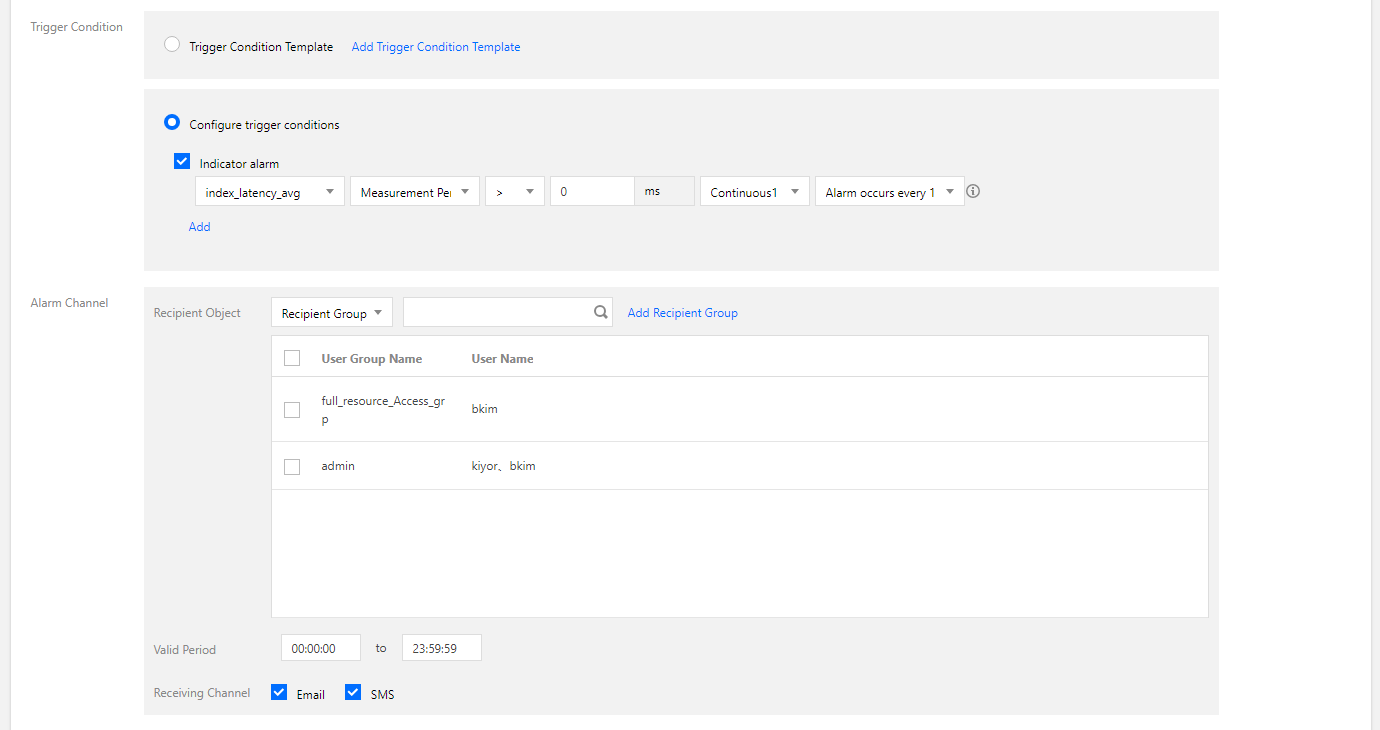
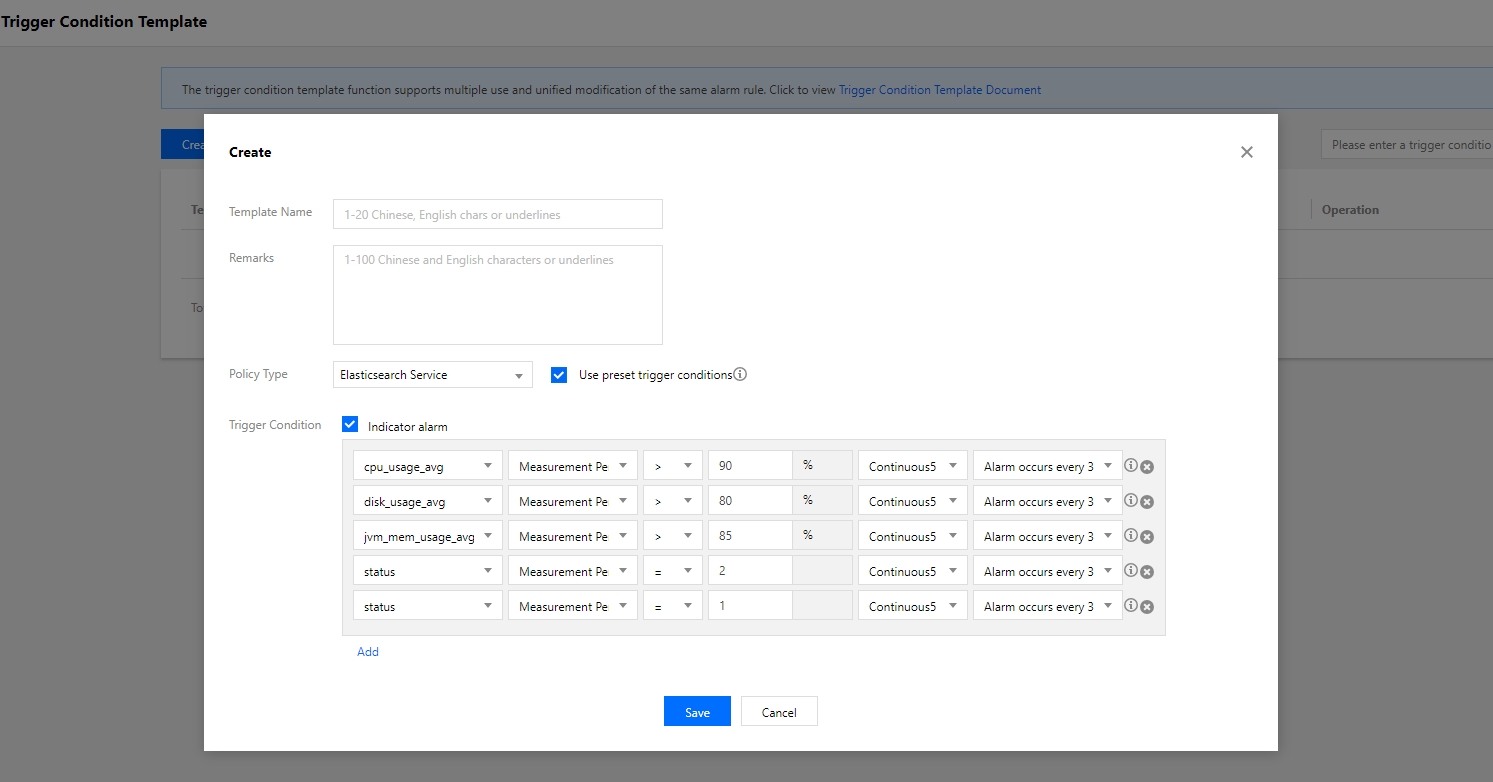
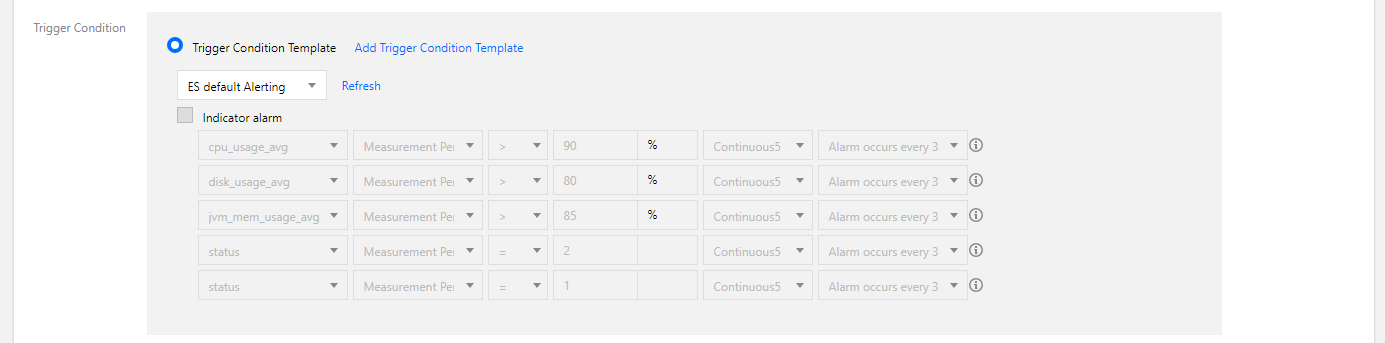
Trigger: Trigger template and Configure a trigger are supported. The latter is selected by default. For more information about custom configuration, see the description below. For more information about how to create a template, see the Create a trigger template section below.
Note:
Metric: For example, "CPU utilization". The statistical period is 1 minute or 5 minutes. All the metrics of an ES cluster are collected once per minute. If the statistical period is 1 minute, an alarm will be triggered as soon as a threshold is exceeded in the cluster. If 5 minutes is selected as the statistical period, an alarm will be triggered only when the threshold is continuously exceeded within 5 minutes.
Alarm frequency: For example, "Alarm once every 30 minutes" means that there will be only one alarm triggered every 30 minutes if a metric exceeds the threshold in several consecutive statistical periods. Another alarm will be triggered only if the metric exceeds the threshold again in the next 30 minutes.
Alarm Channel: Select the recipient group, valid time period, and receiving channel. For more information about the configuration method, see Creating and Managing an Alarm Recipient Group.
3. After the configuration is completed, click Finish. Return to the Alarm Policy list and you can see the alarm policy just configured.