Health Check
Download
Focus Mode
Font Size
Overview
Health check detects the service connectivity on a regular basis to monitor the service health, helping you stay up to date with the service health in real time and promptly discover exceptions to improve the SLA.
Directions
1. Log in to the TMP console.
2. In the instance list, select the corresponding TMP instance.
3. Enter the instance details page and click Integration Center.
4. Select Health Check in Integration Center to configure the detection of the corresponding service.
Detection description
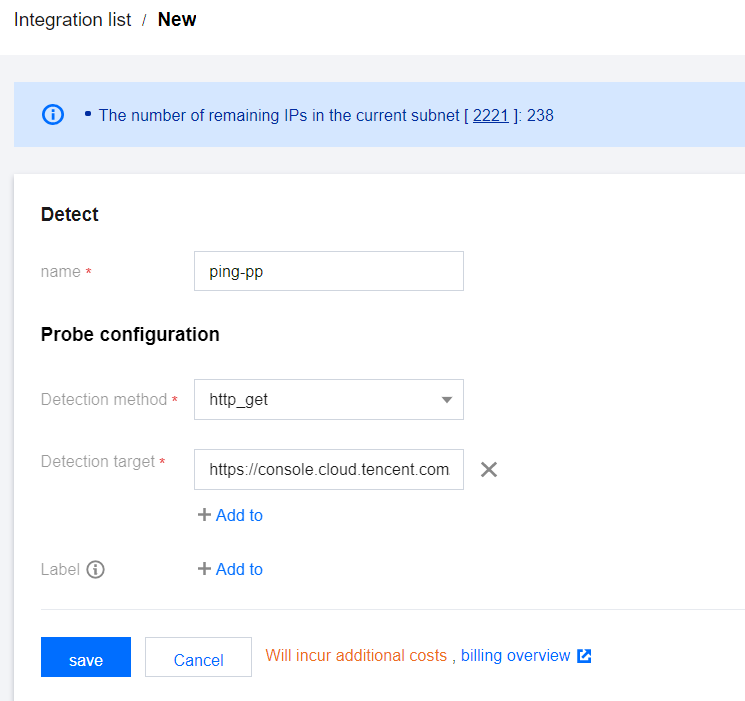
Parameter | Description |
Name | Unique detection task name, which corresponds to the detection group on the Grafana monitoring dashboard |
Detection Method | Currently, the following detection methods are supported: http_get http_post tcp ssh ping |
Detection Target | Address of the service to be detected |
Label | Label with business meaning, which will be automatically added to Prometheus labels |
Viewing monitoring information
You can clearly view the following status on the monitoring dashboard:
1. Service access latency and health status.
2. Latency in each processing phase of service access.
3. Expiration time of certificate in case of HTTPS
4. Status of various detection types.

Help and Support
Was this page helpful?
You can also Contact sales or Submit a Ticket for help.
Help us improve! Rate your documentation experience in 5 mins.
Feedback