安全组开放说明
Download
聚焦模式
字号
概述
托管集群
托管集群安全组由 Prometheus 监控服务创建,一般情况下不需要修改。
安全组
规则 | 协议端口 | 策略 |
入站规则 | TCP:9093,9090,10901,10902,9990,3000,8080,8008 | 允许 |
入站规则 | TCP:8100-8200 | 允许 |
出站规则 | ALL | 允许 |
端口说明
端口 | 作用 | 备注 |
TCP:8008 | proxy-server 监听 proxy-agent 连接端口 | - |
TCP:8080 | 集群内部接口调用端口 | - |
TCP:3000 | grafana 代理端口 | - |
TCP:9990 | cm-notify 同步端口 | 即将下线 |
TCP:10901,10902 | thanos sidecar 监听地址 | - |
TCP:9090 | 配置 reload 端口,采集数据查询接口 | - |
TCP:9093 | 告警用端口 | - |
TCP:8100-8200 | proxy-server 监听采集用端口 | 由于采集端口范围为100个,所以关联集群最多不能超过100个 |
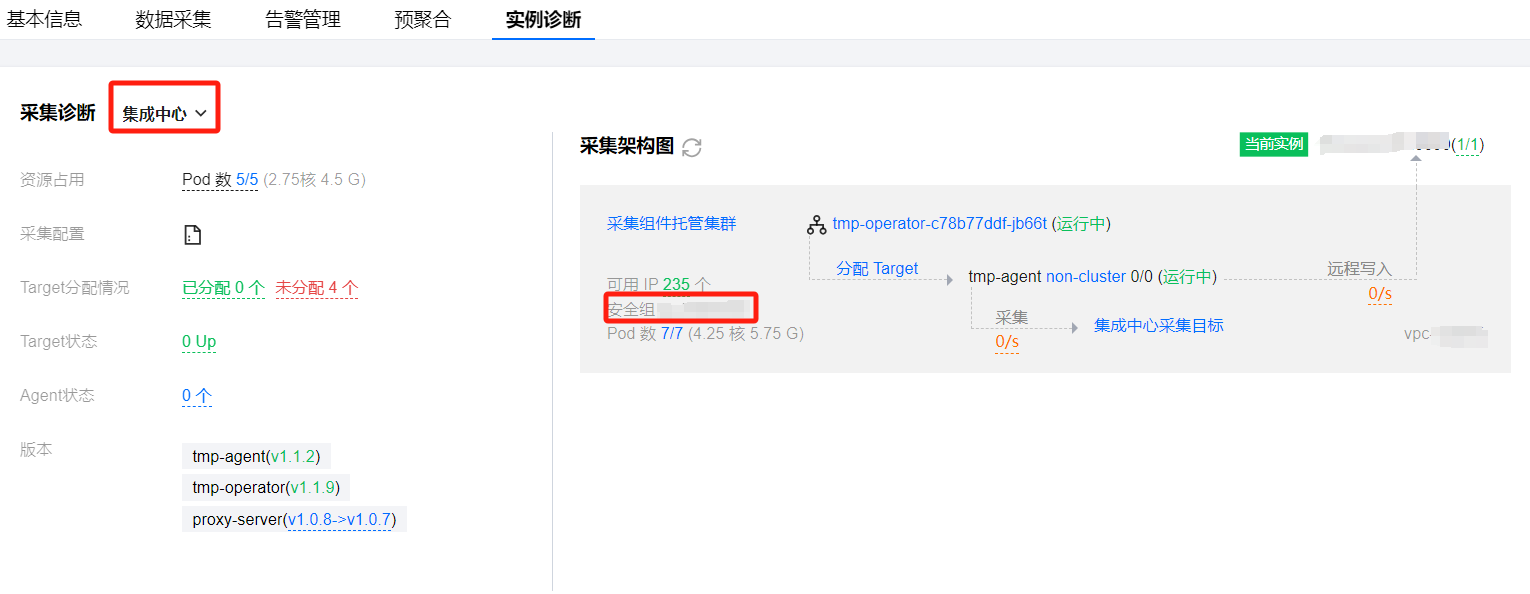
查看方式
用户集群
用户集群安全组在用户创建节点时指定,若不指定则为默认安全组。
安全组
规则 | 集群类型 | 协议端口 | 策略 | 说明 |
出站规则 | - | TCP:8008 | 允许 | 保证 proxy-agent 与 proxy-server 能够建立连接 |
入站规则 | 标准集群 | - | | 标准集群无需开放端口 |
入站规则 | 独立集群 | TCP:9092,8180,443,10249,9100,60002,10252,10257,10259,10251等 | 允许 | 独立集群需额外开放 master 节点相关端口,保证 proxy-agent 能够拉取 master 节点相关监控数据 |
查看方式
原生节点
点击节点管理 > Worker 节点 > 节点池,点击节点池 id,在详情页即可看到安全组,在腾讯云安全组按安全组 id 进行搜索,查看具体规则即可。
普通节点
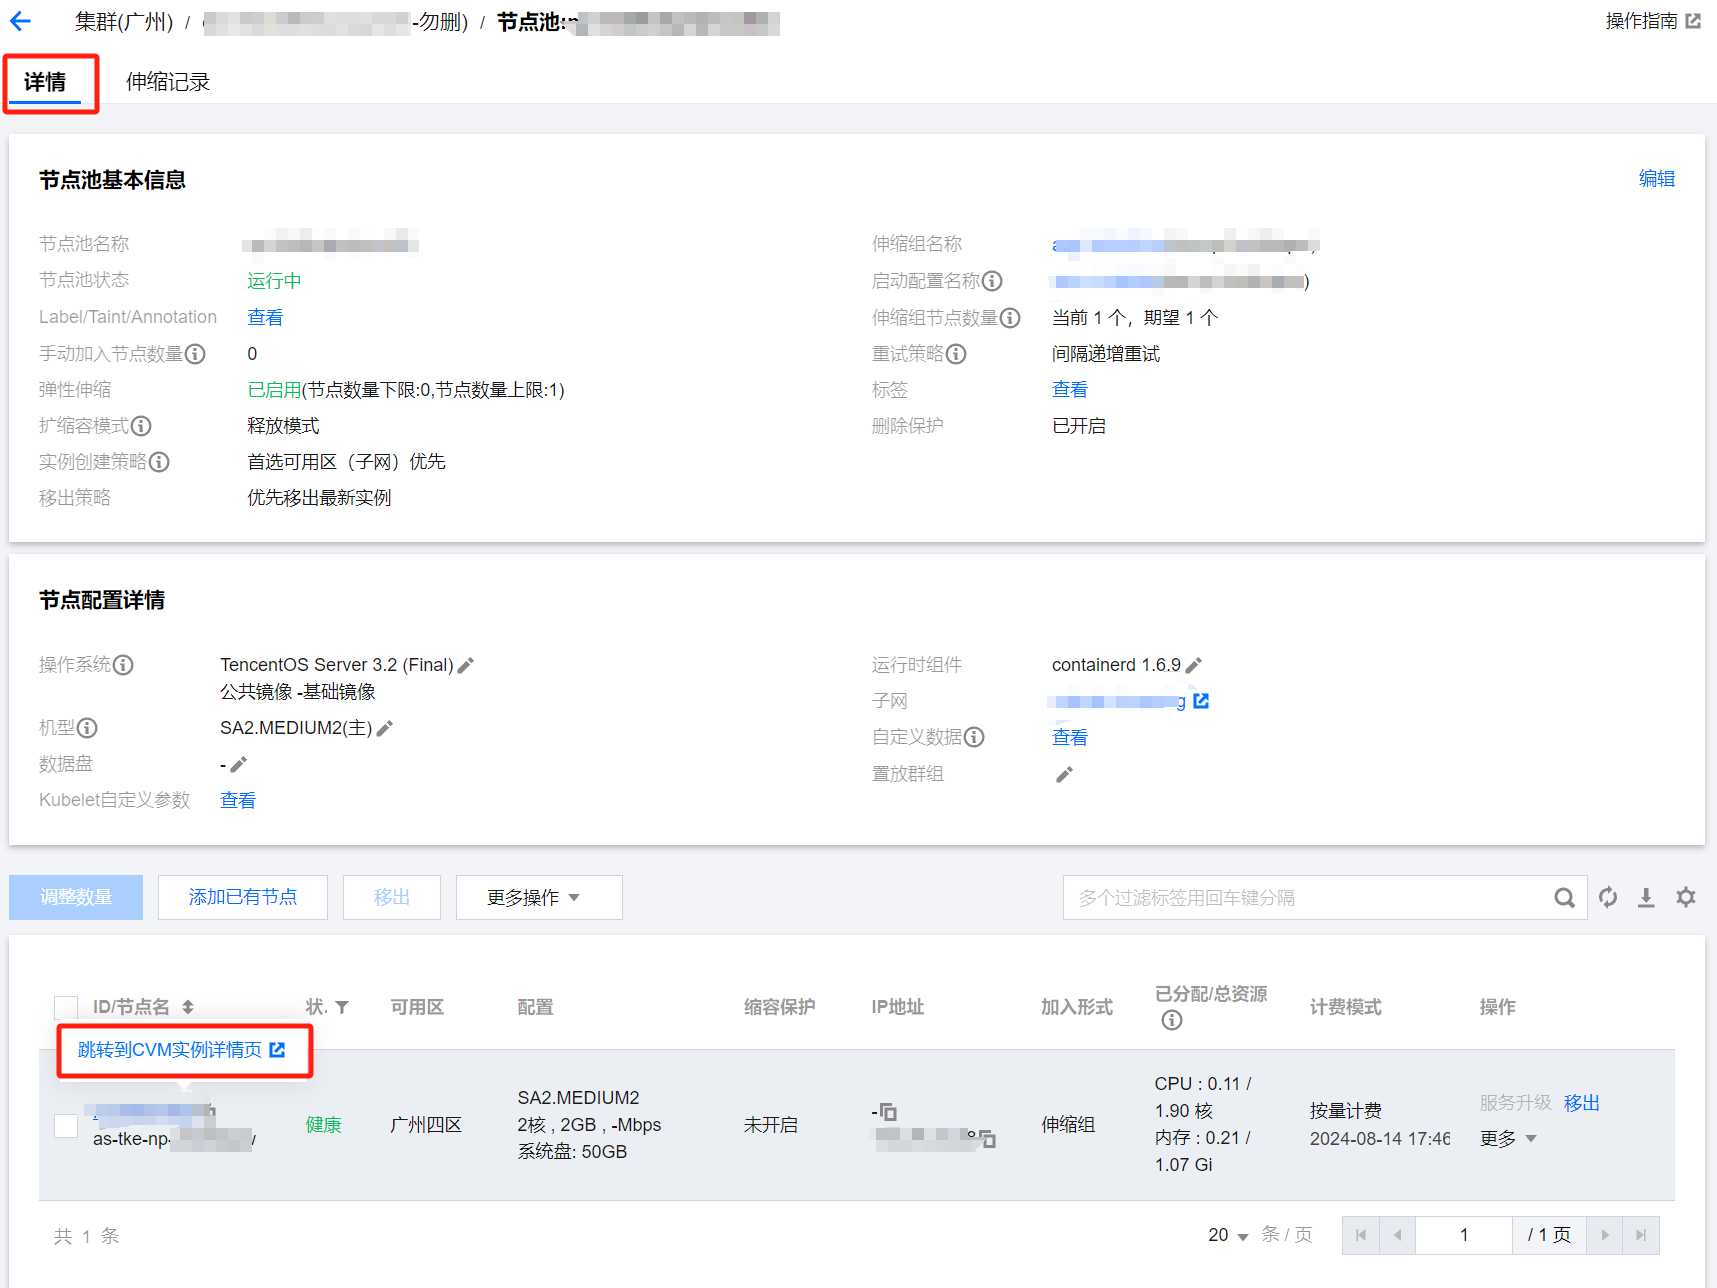
点击节点管理 > Worker 节点 > 节点池,点击节点池 id,在详情页将鼠标放在节点 ID 上点击跳转到 CVM 实例详情页:
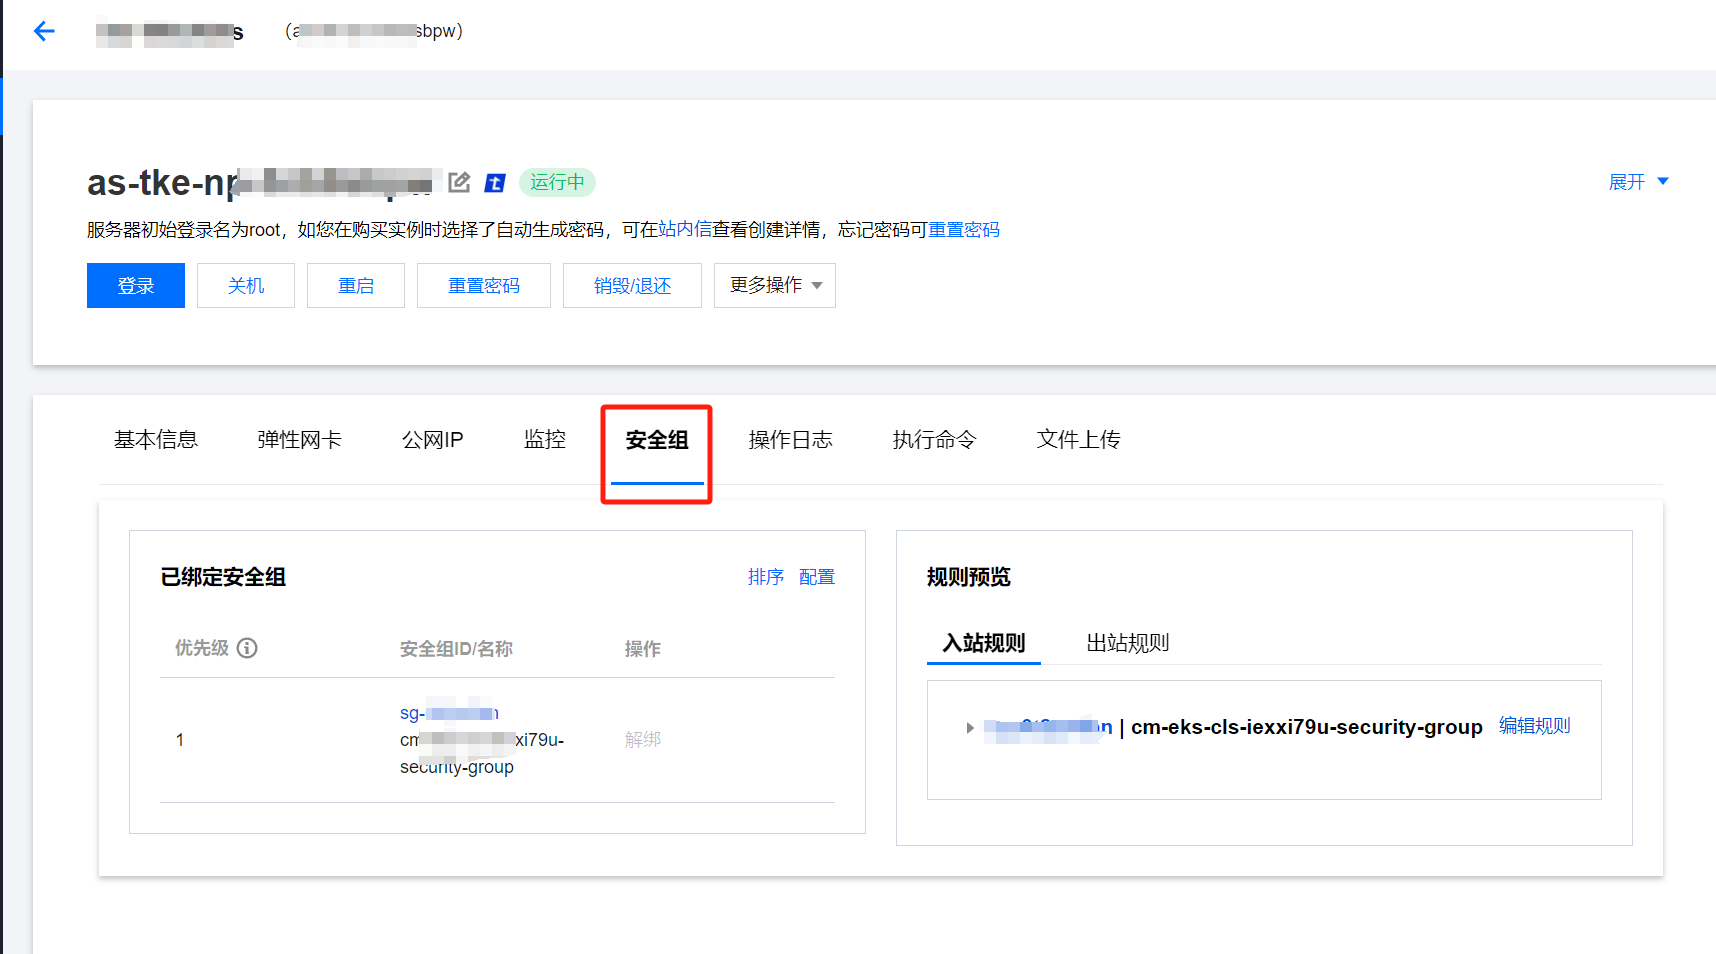
跳转至实例详情页面后,点击安全组,即可查看具体安全组信息:
超级节点
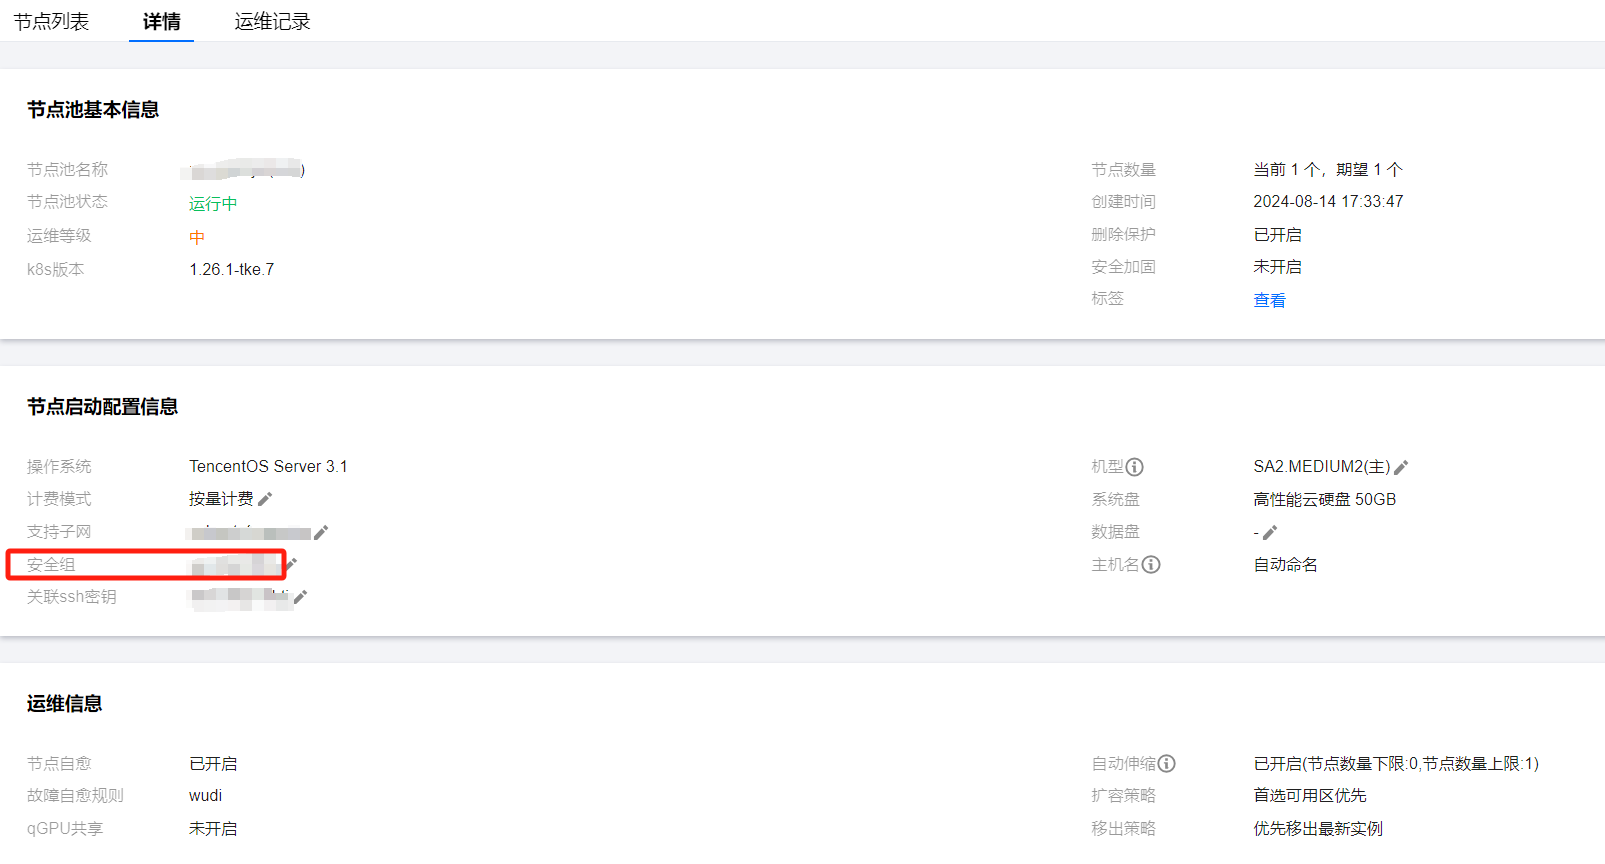
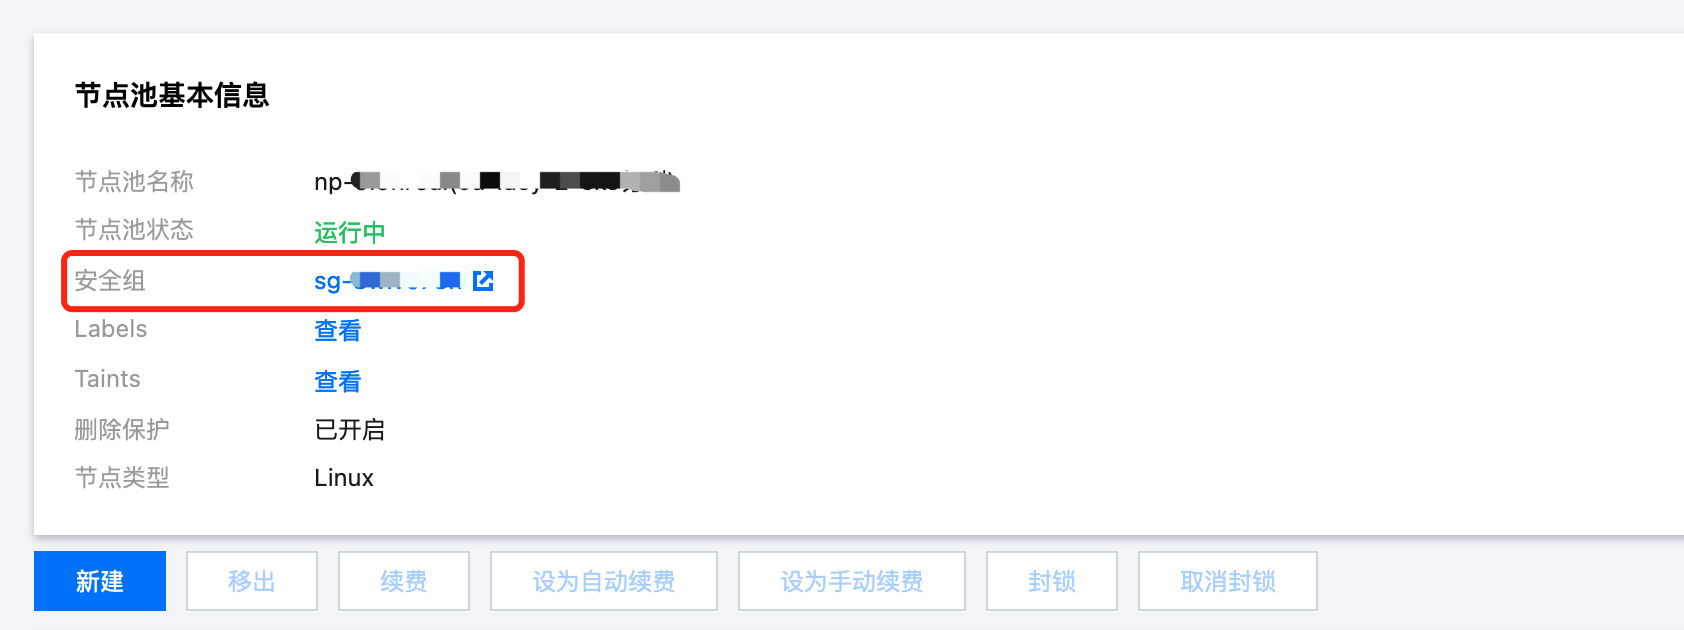
点击节点管理 > Worker 节点 > 节点池,点击节点池 id,在节点池基本信息中即可查看安全组:
相关问题
问题描述
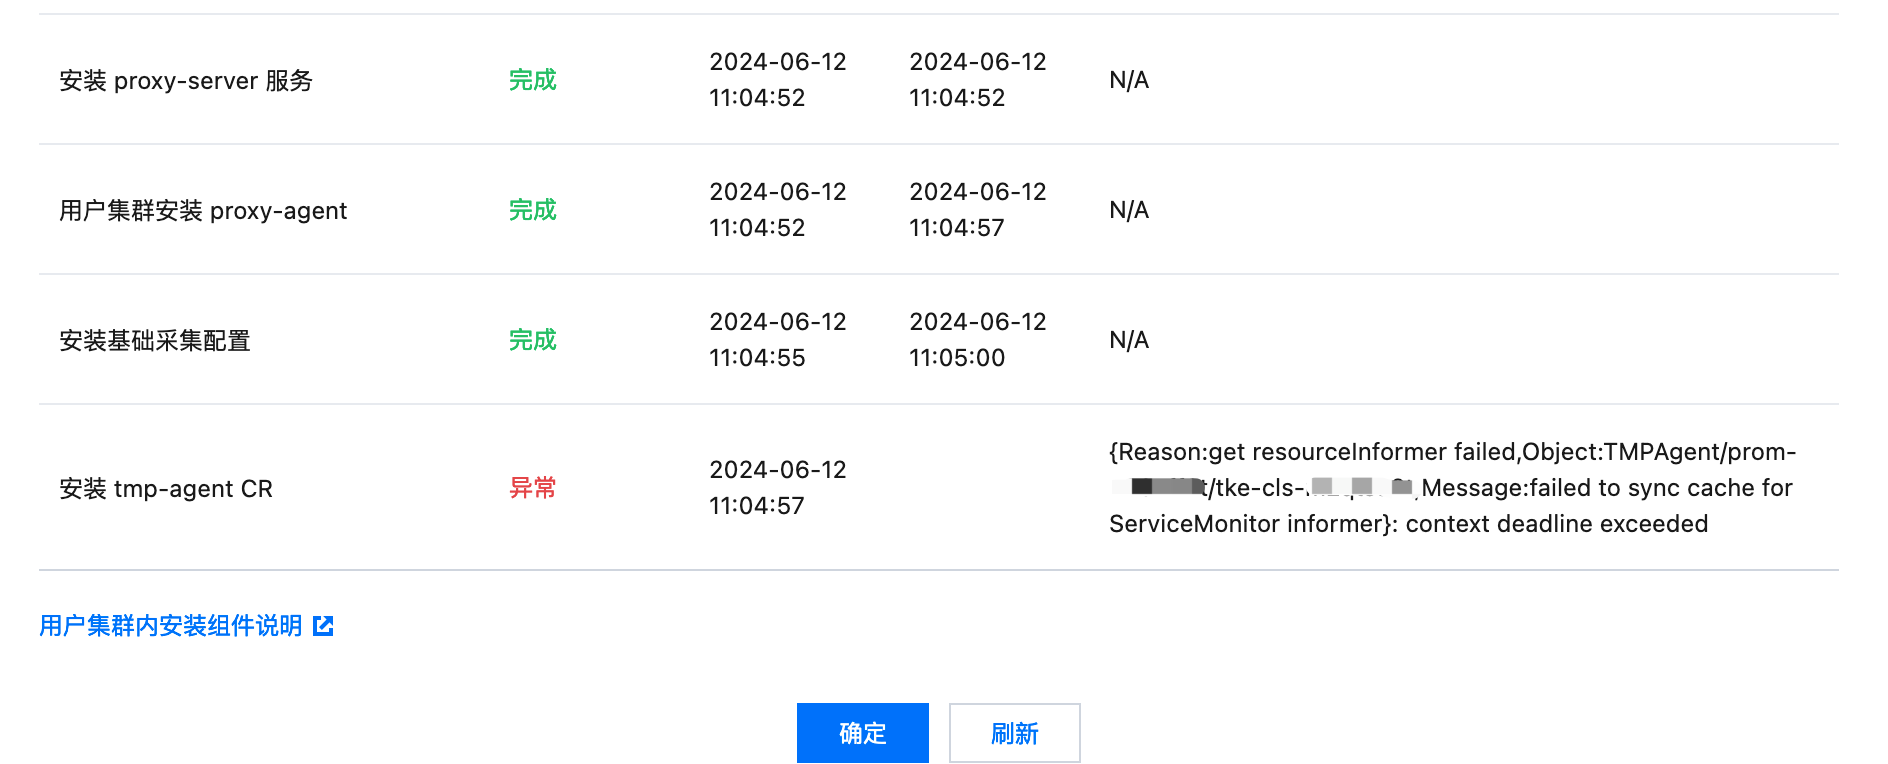
绑定状态异常,“安装 tmp-agent CR”步骤显示“context deadline exceeded”:
问题处理
vpc 是否相同,或者打通
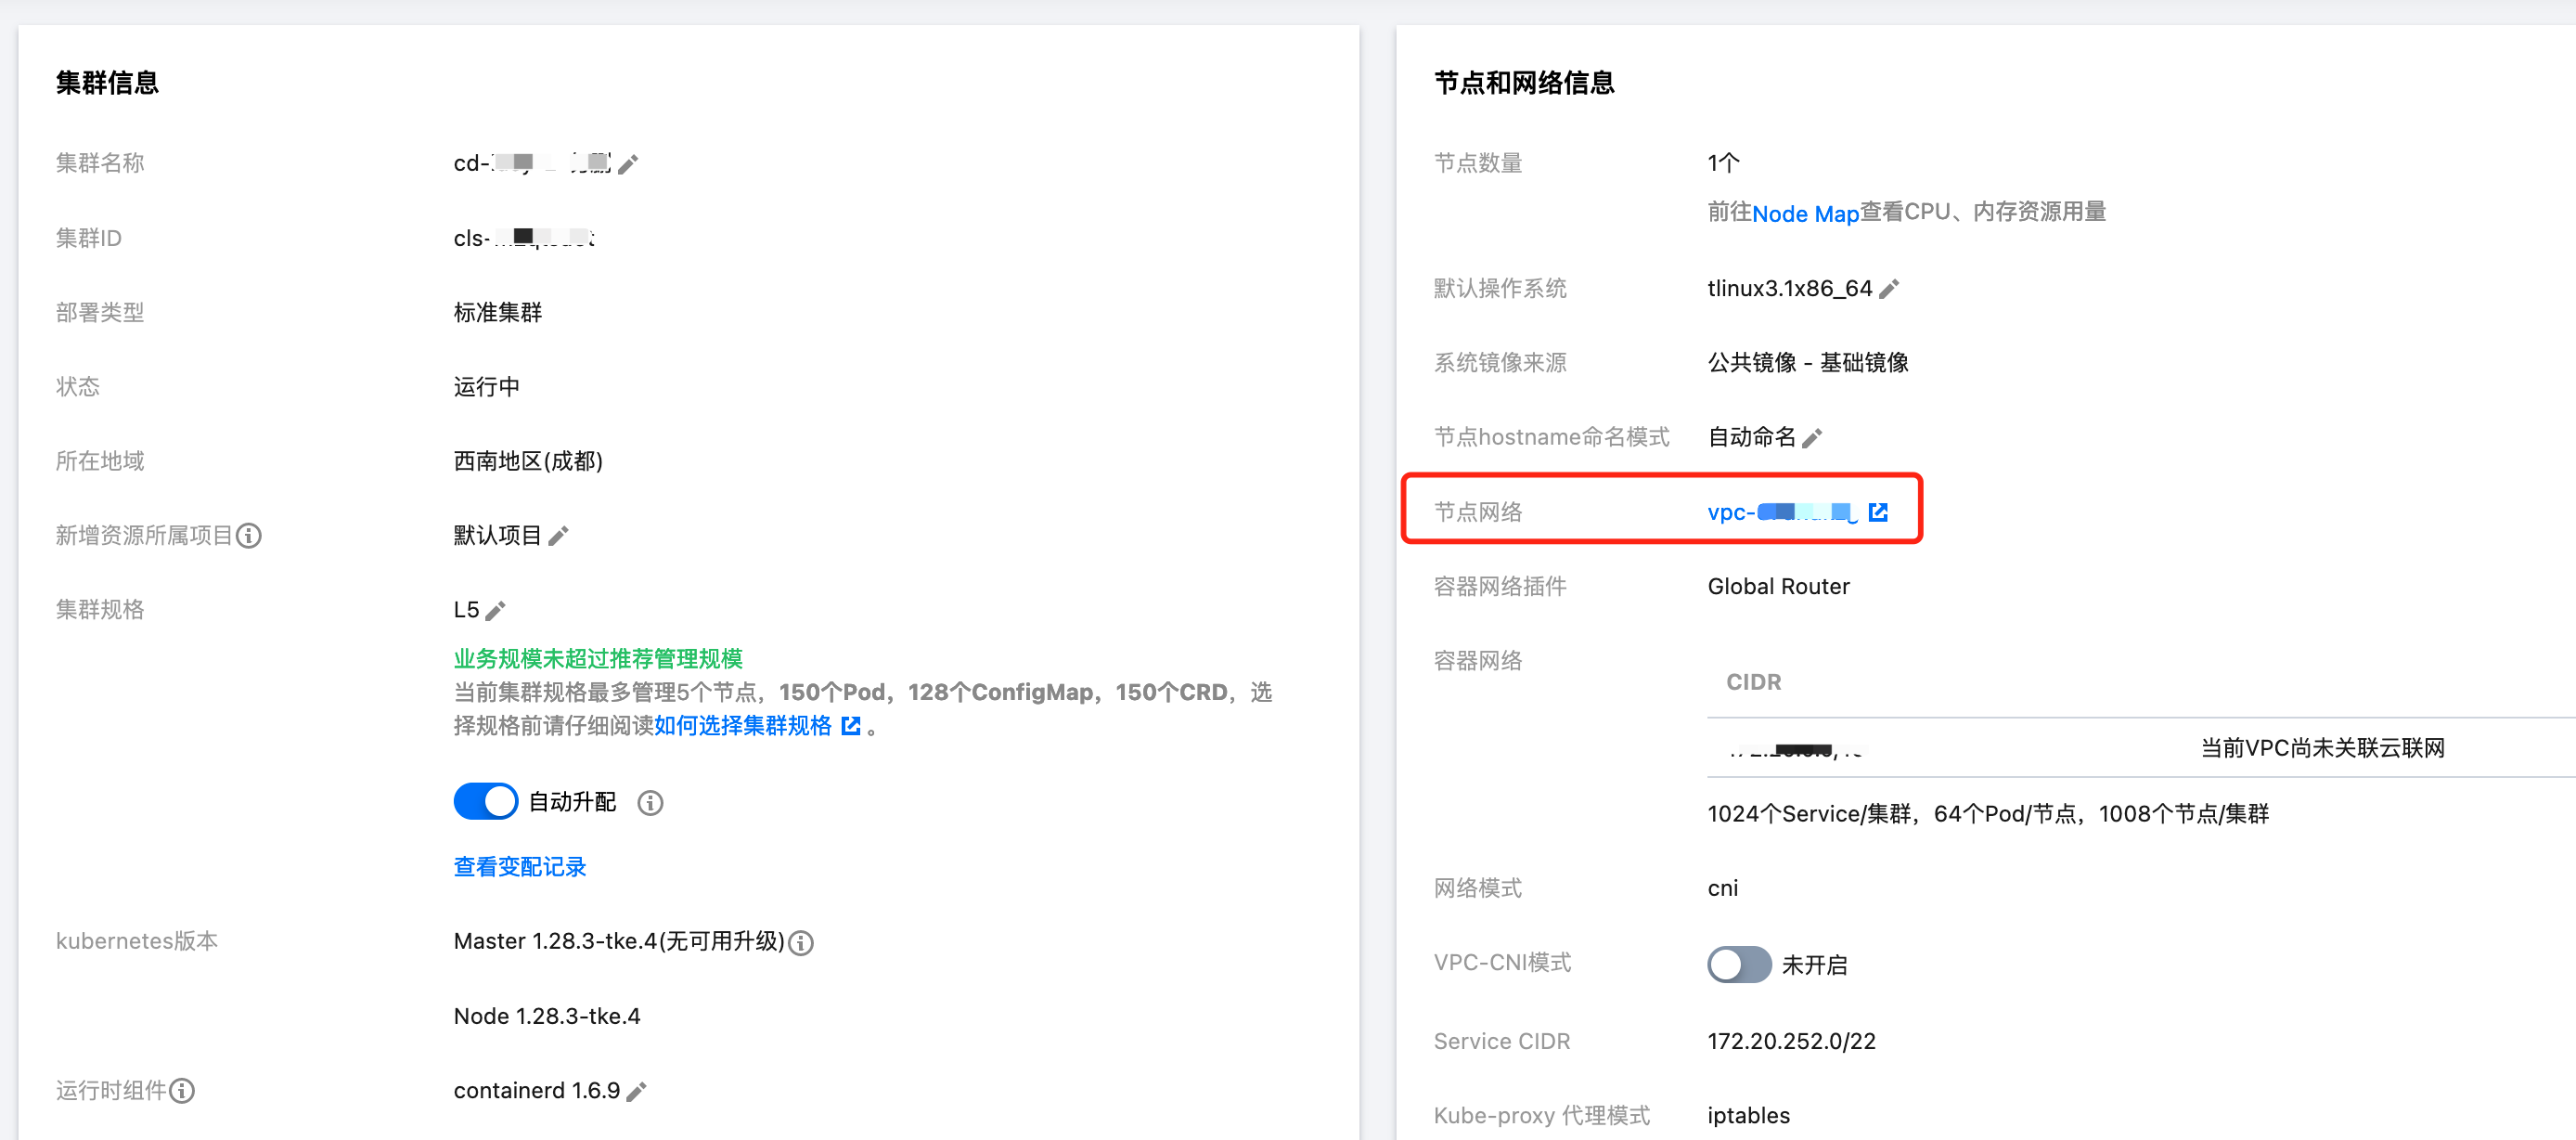
1. 点击用户集群链接,打开关联集群,查看集群节点网络(即 vpcid):
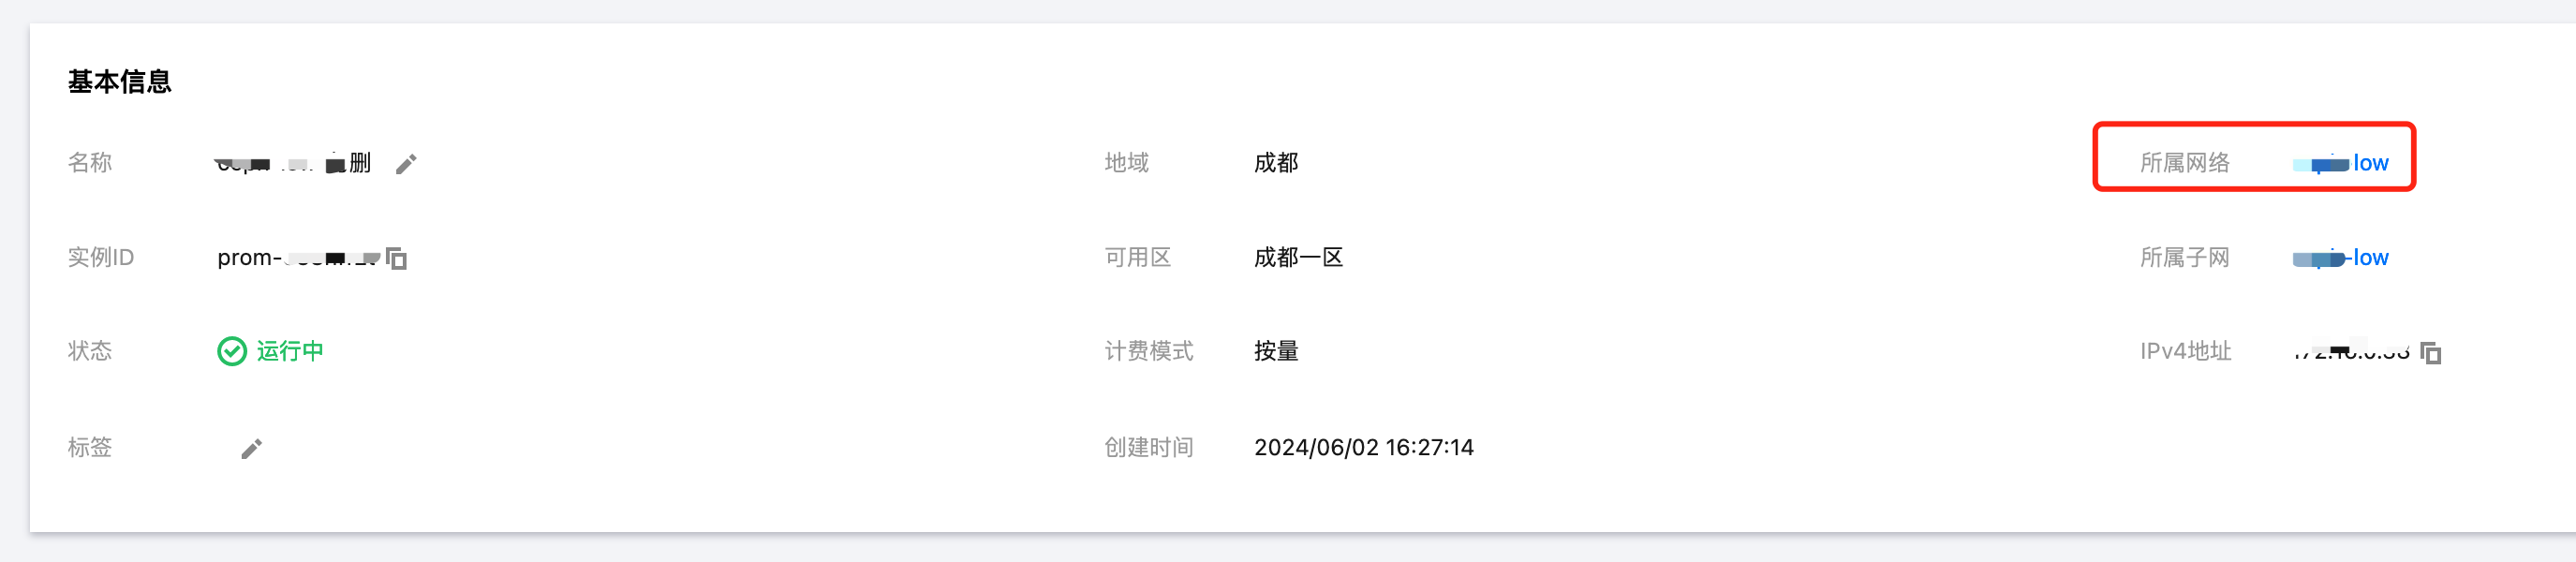
2. 在 Prometheus 实例的基本信息页面,点击所属网络,打开后即可查看集群网络:
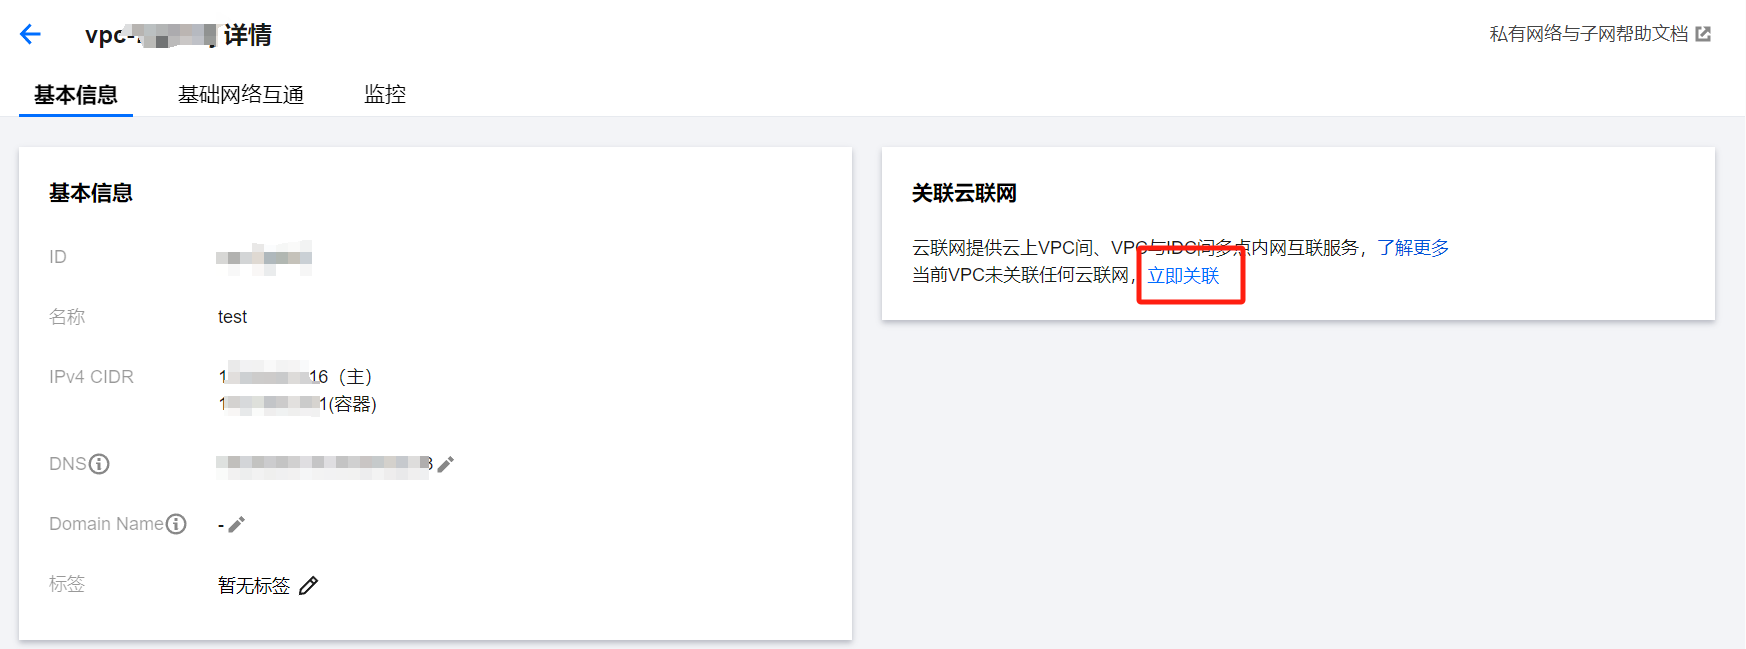
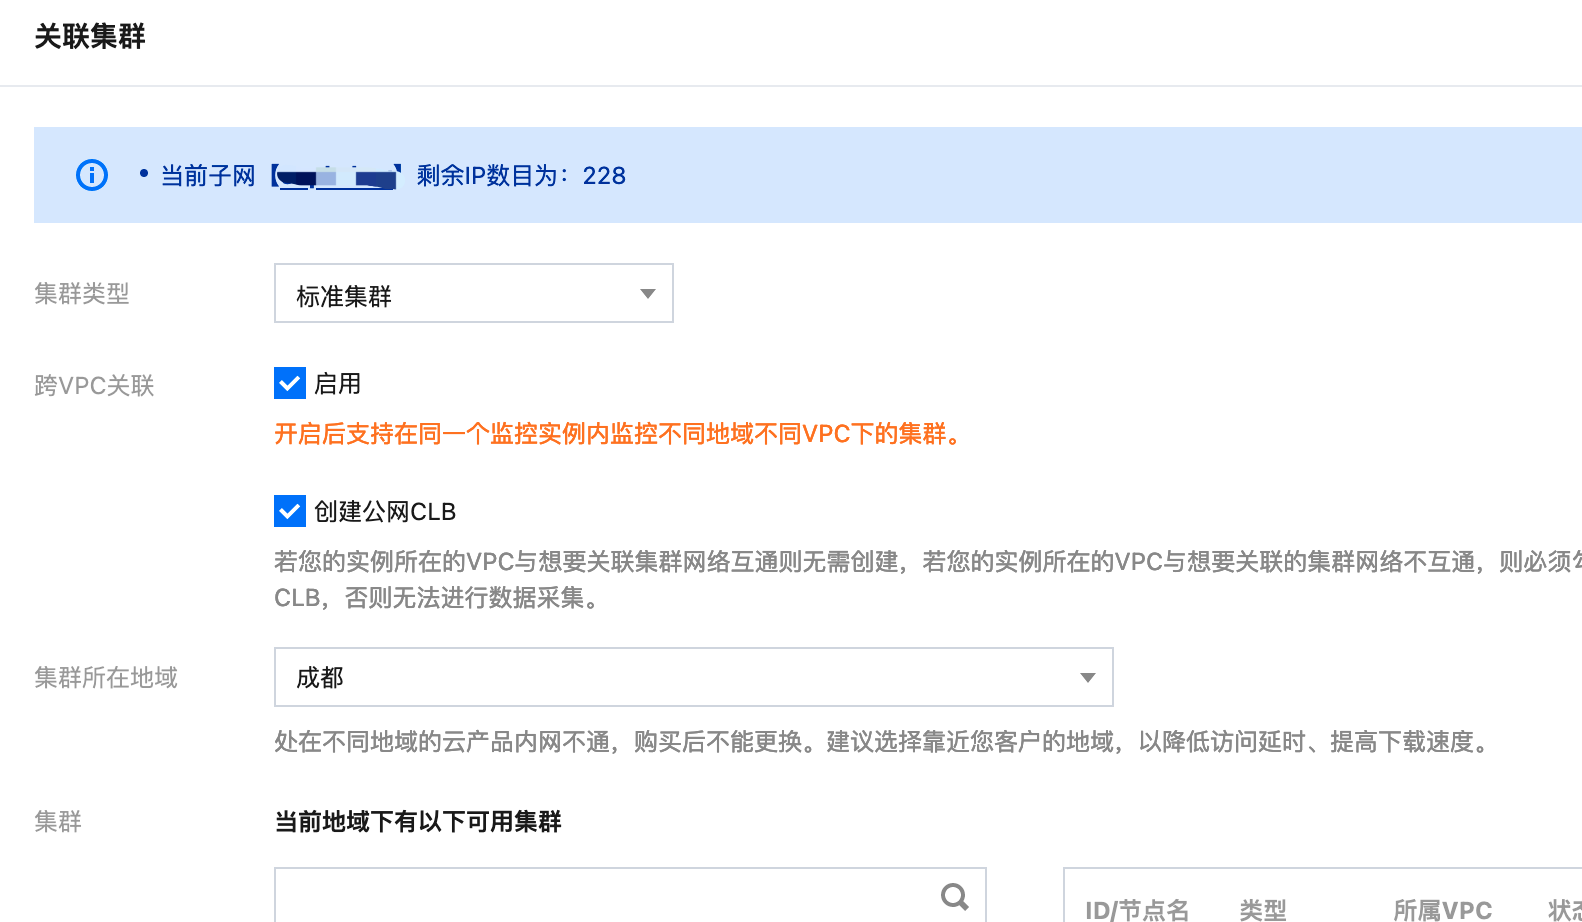
3. 对比 vpcid,若不一致,查看 vpc 是否通过云联网打通。若云联网没有打通,则需要关联云联网,打通两边的 vpc,或者在关联集群时勾选创建公网 CLB。若云联网已打通,仍不能关联成功,需查看云联网是否达到带宽上限,若已达到则需要调大云联网带宽上限。
关联云联网:
勾选创建公网 CLB:
安全组是否放通
1. 查看用户集群安全组,查看方式见 用户集群安全组查看方式,查看规则是否与要求一致;
2. 若用户集群为独立集群,查看 Master&Etcd 安全组信息,点击节点管理 > Master&Etcd > 节点池,点击节点池 id,并将鼠标放在节点 ID 上,点击跳转到 CVM 实例详情页,然后在 CVM 的安全组页面即可查看具体安全组信息:
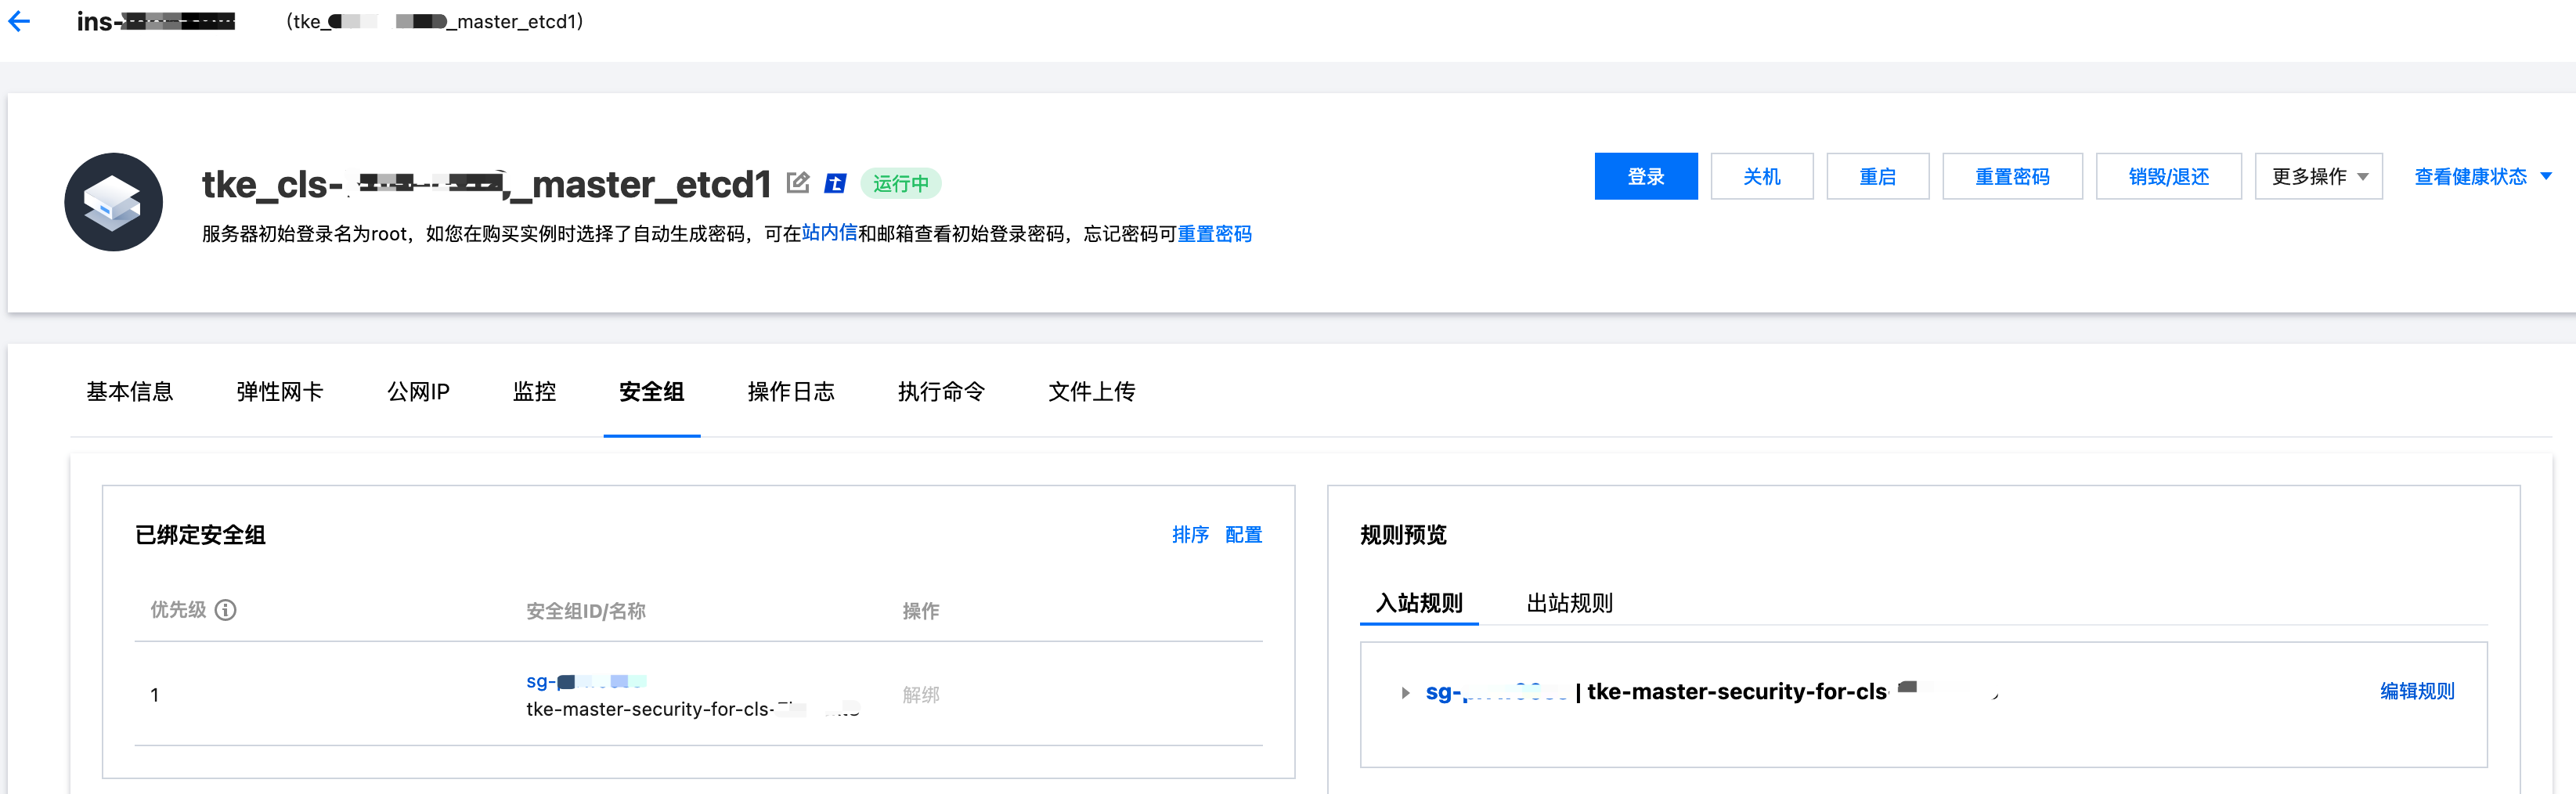
检查安全组规则是否符合要求。
文档反馈