TencentCloud Managed Service for Prometheus (TMP) provides the highly available Prometheus service as well as the open-source visualization tool Grafana and Cloud Monitor alarms while inheriting the monitoring capabilities of the open-source Prometheus, which reduce your development and OPS costs.
Prometheus Overview
Prometheus is an open-source monitoring system. Similar to Kubernetes inspired by Google's Borgman monitoring system, it was inspired by Google's Borgman monitoring system. It was created and developed in 2012 by SoundCloud's internal engineers and released in January 2015. In May 2016, it became the second project after Kubernetes to officially join Cloud Native Computing Foundation (CNCF). Nowadays, it is usually used for monitoring in the most common Kubernetes container management systems.
Prometheus has the following features:
Custom multidimensional data models (a time series data entry is composed of a metric and a key-value pair called label).
Flexible and powerful query language PromQL, which can use multidimensional data to complete complex monitoring queries.
Independence from distributed storage and support for operations based on one single master node.
Time series data collection through HTTP pull.
Data push through Pushgateway.
Acquisition of collection target servers through dynamic scrape configuration or static configuration.
Integration with Grafana to easily support various visual charts and dashboards.
Features
According to the layering of monitoring, TMP covers business monitoring, application layer monitoring, middleware monitoring, and system layer monitoring. Together with Cloud Monitor's alarming capabilities and open-source Grafana, it can provide a one-stop all-round monitoring system to help your quickly identify and locate business problems and reduce the impact of various faults on your business.
System layer monitoring: CPU, memory, disk, network, etc.
Intermediate component layer monitoring: Kafka, MySQL, Redis, etc.
Application layer monitoring: application services such as JVM, HTTP, and RPC.
Business monitoring: golden business metrics such as the number of logins and the number of orders.
Strengths
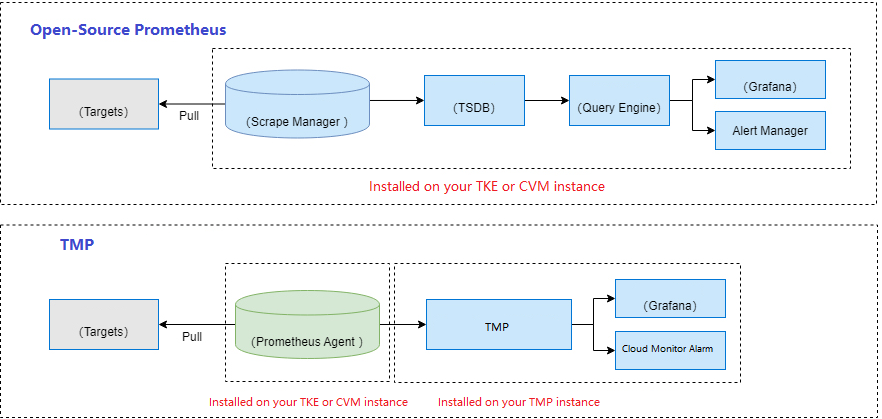
TMP has the following strengths over the open-source Prometheus:
Lighter, more stable, and more available.
Fully compatible with the open-source Prometheus ecosystem.
Free of manual setup, saving the development costs.
Highly integrated with TKE, saving the development costs of integrating with Kubernetes.
Integrated with Cloud Monitor's alarming system, saving the costs of developing alarm notifications.
Integrated with commonly used Grafana dashboards and alerting rule templates.