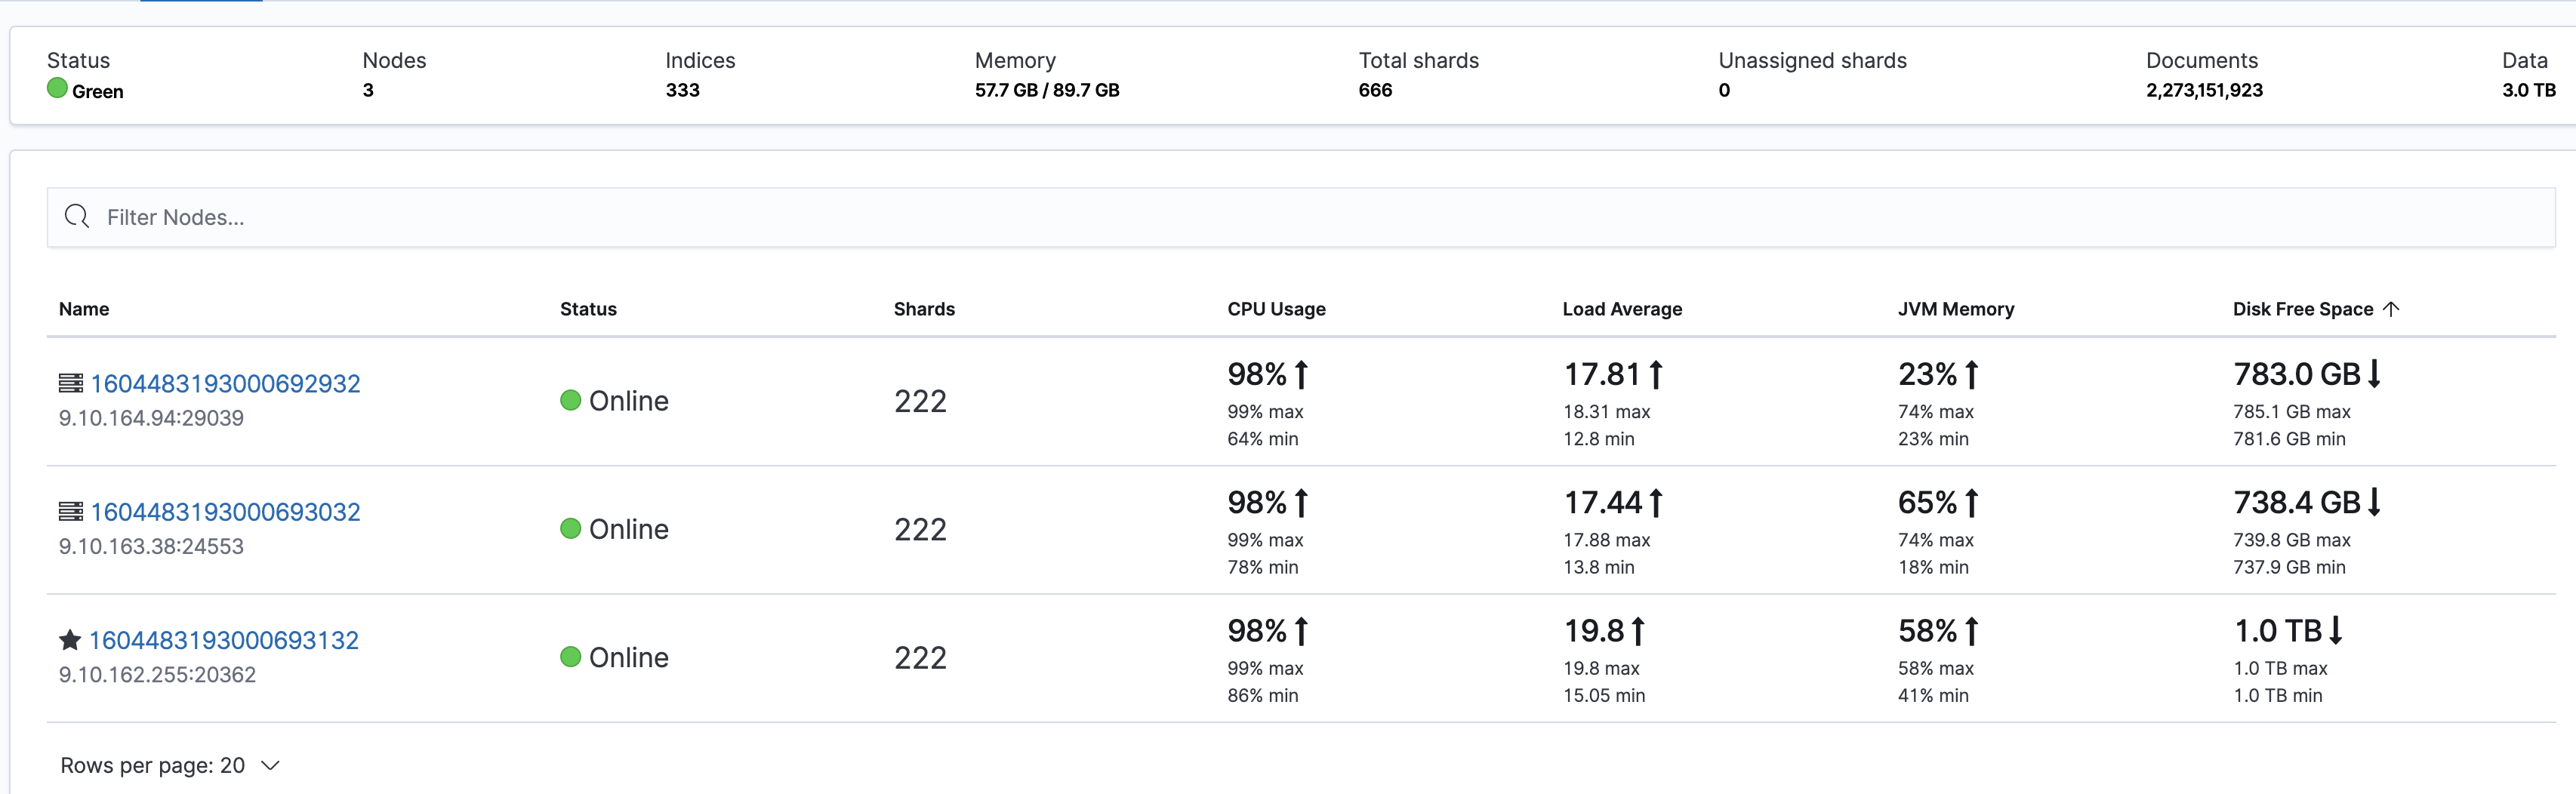
All nodes in the cluster have high CPU utilization, but there are not a lot of reads and writes. The specific problem can be seen on the Stack Monitoring page in Kibana:
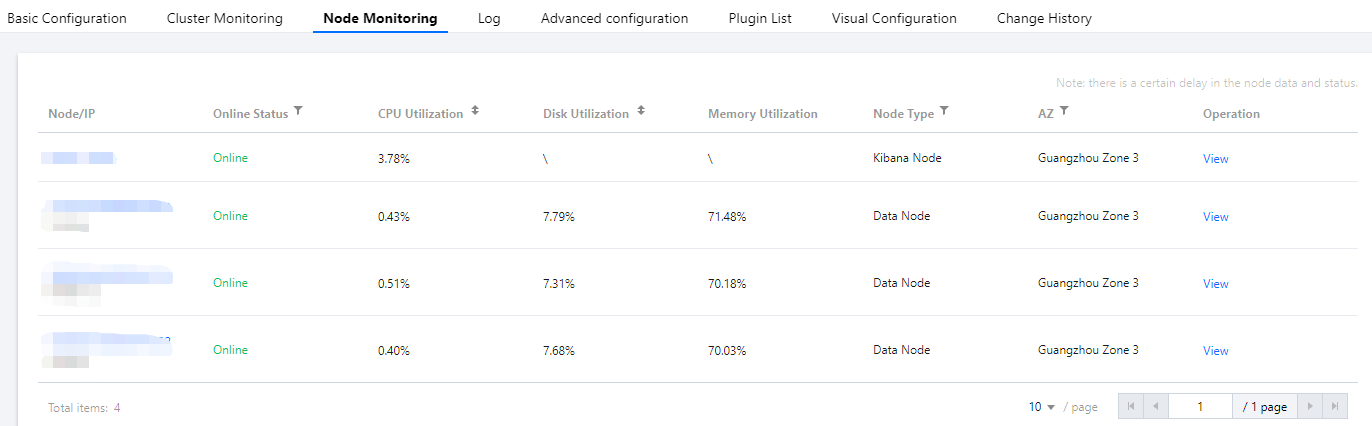
In addition, you can also see the CPU utilization of each node on the node monitoring page in the ES console:
In this case, because the cluster read rate and write rate are not high, it is difficult to quickly find the root cause from the monitoring perspective. Therefore, you need to observe carefully and find the cause from the details. Below are several possible scenarios and corresponding troubleshooting ideas.
Note:
The situation where the CPU utilization of an individual node is much higher than that of other nodes is quite common. In most cases, this is caused by uneven load due to improper use of the cluster. For more information, please see Uneven Cluster Load.
Troubleshooting
Large query requests cause the CPU utilization to soar
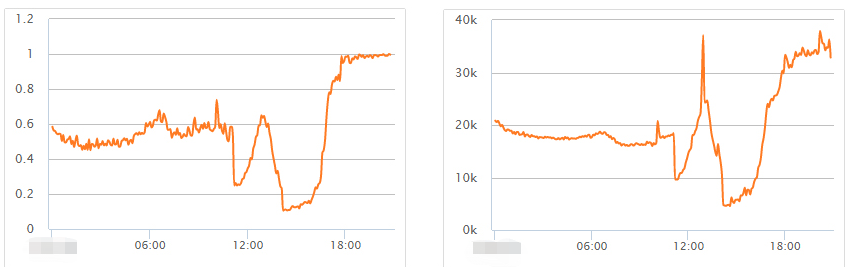
This situation is relatively common, and clues can be found from monitoring. Monitoring data shows that the fluctuation of the query request volume is basically in line with the maximum CPU utilization of the cluster.
To further identify the problem, you need to enable slow log collection for the cluster. For more information, please see Querying Cluster Logs. You can get more information from the slow logs, such as the indexes that cause slow queries, query parameters, and query content.
Solutions
Try to avoid large text searches and optimize queries.
Use the slow logs to identify indexes where queries are slow. For some indexes with a small amount of data, set a small number of shards and multiple replicas, such as one-shard-multi-replica, to improve the query performance.
Write requests causes the CPU utilization to soar
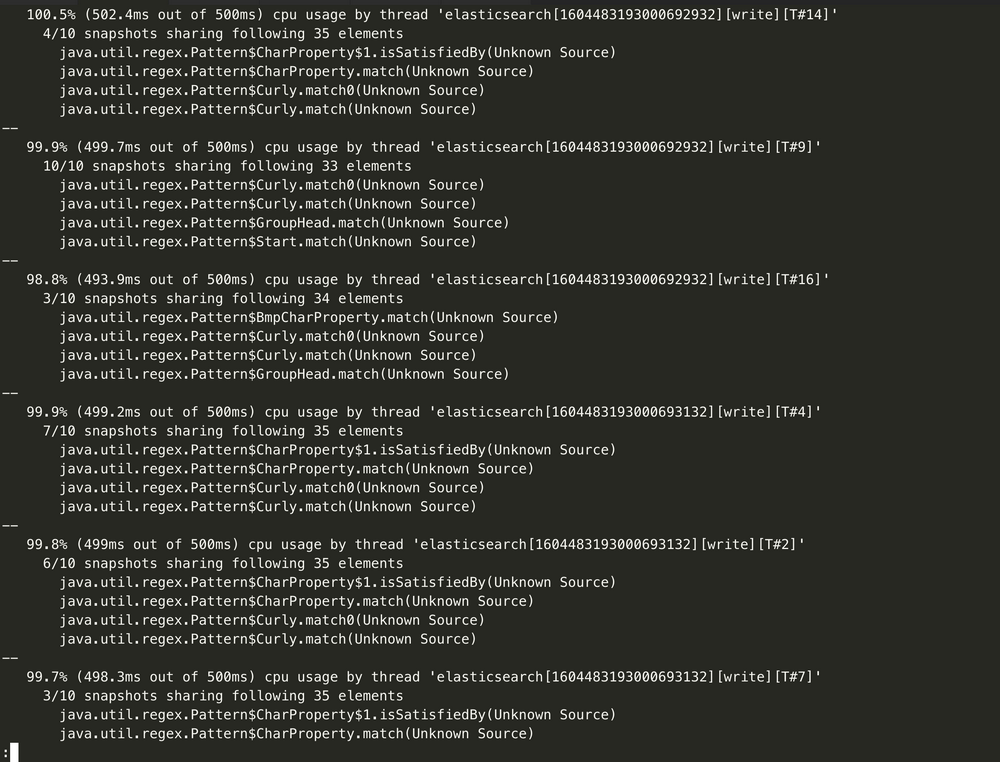
If monitoring data shows that the CPU utilization surge is related to writes, then enable slow log collection for the cluster, identify slow write requests, and optimize them. You can also get the hot_threads information to identify which thread is consuming the CPU:
curl http://9.15.49.78:9200/_nodes/hot_threads
For example, it is found here that there are a lot of ingest pipeline operations, and such operations are very resource intensive.
Solutions
If you encounter the above problems, you need to optimize as appropriate on the business side. The key point of troubleshooting such problems is to make good use of the cluster's monitoring metrics to quickly locate the problems and then use the cluster logs together to identify the root causes, so that the problems can be solved quickly.