The Chat console provides you with data statistics and analysis features. You can view app data such as user base, message activity, group size, and real-time monitoring data.
Note:
Normally, the data is updated at 10:00 every morning. In the event that the data is 0 or not updated, check whether the SDKAppID produced relevant data (for example, whether there are new registered users) in the specified period. If data was produced but not updated, just wait a while for it to be updated.
Daily Statistics
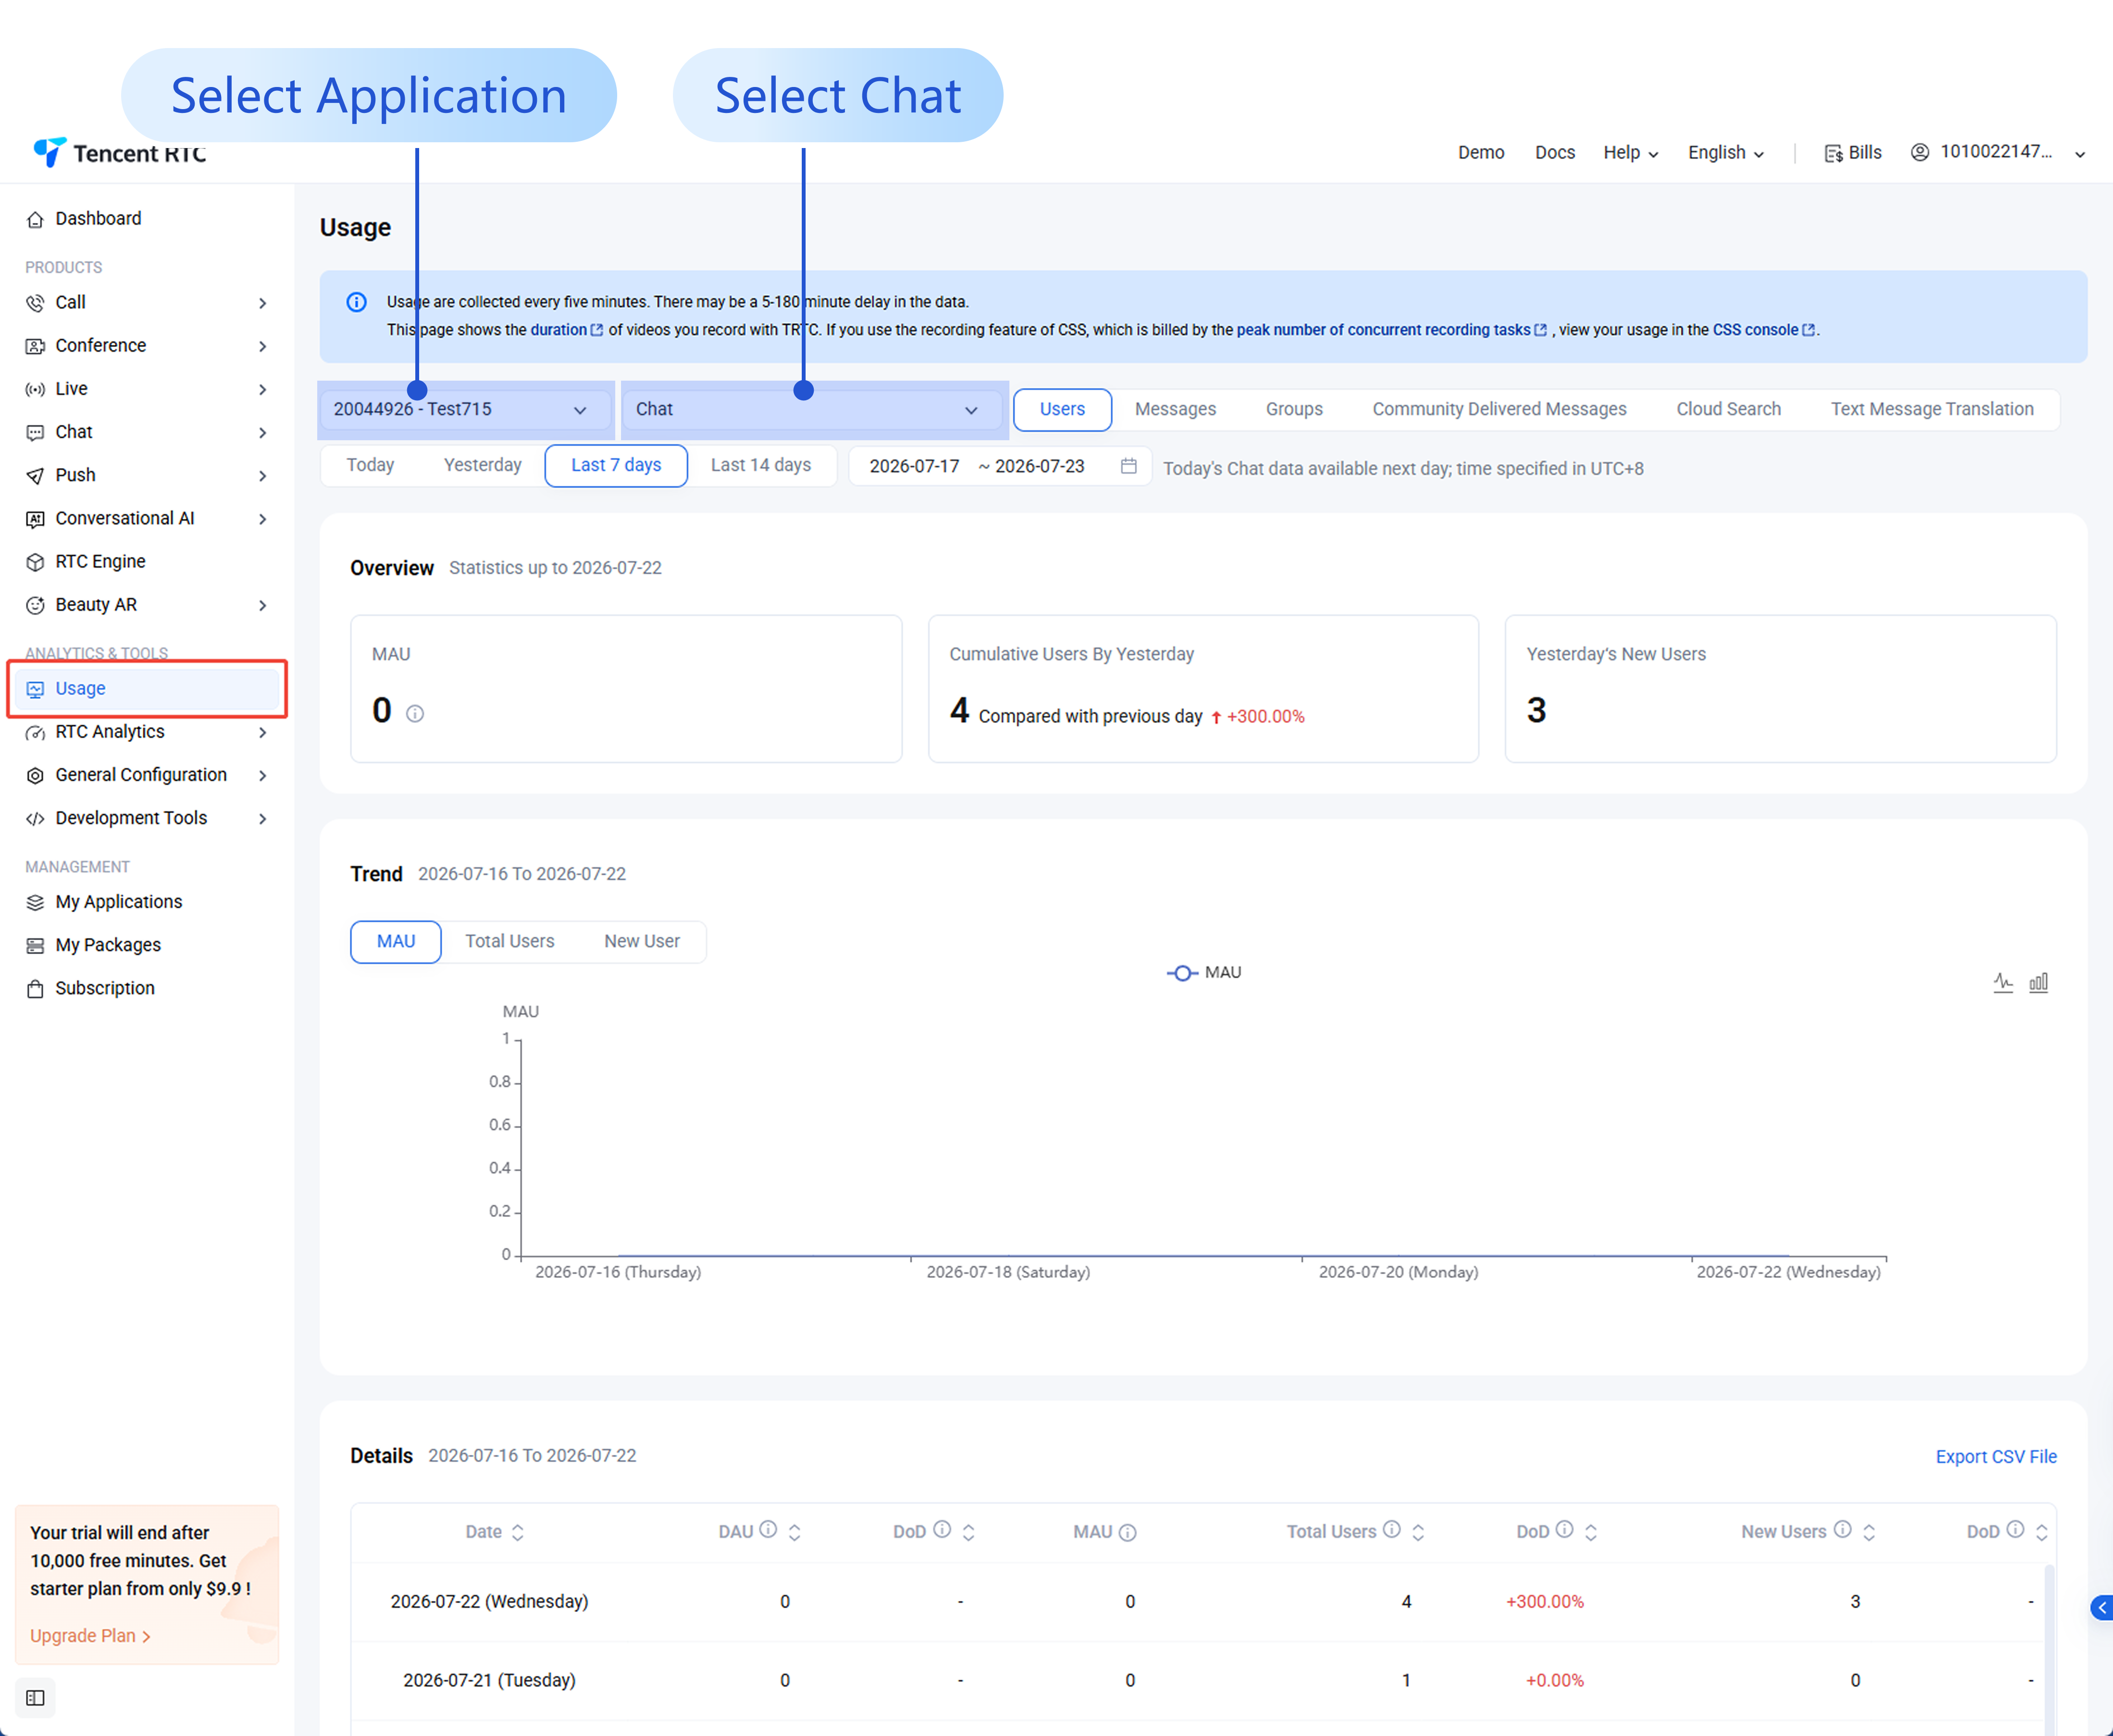
Log in to the Chat Console > Usage, select your Application, and choose the Chat product.
User
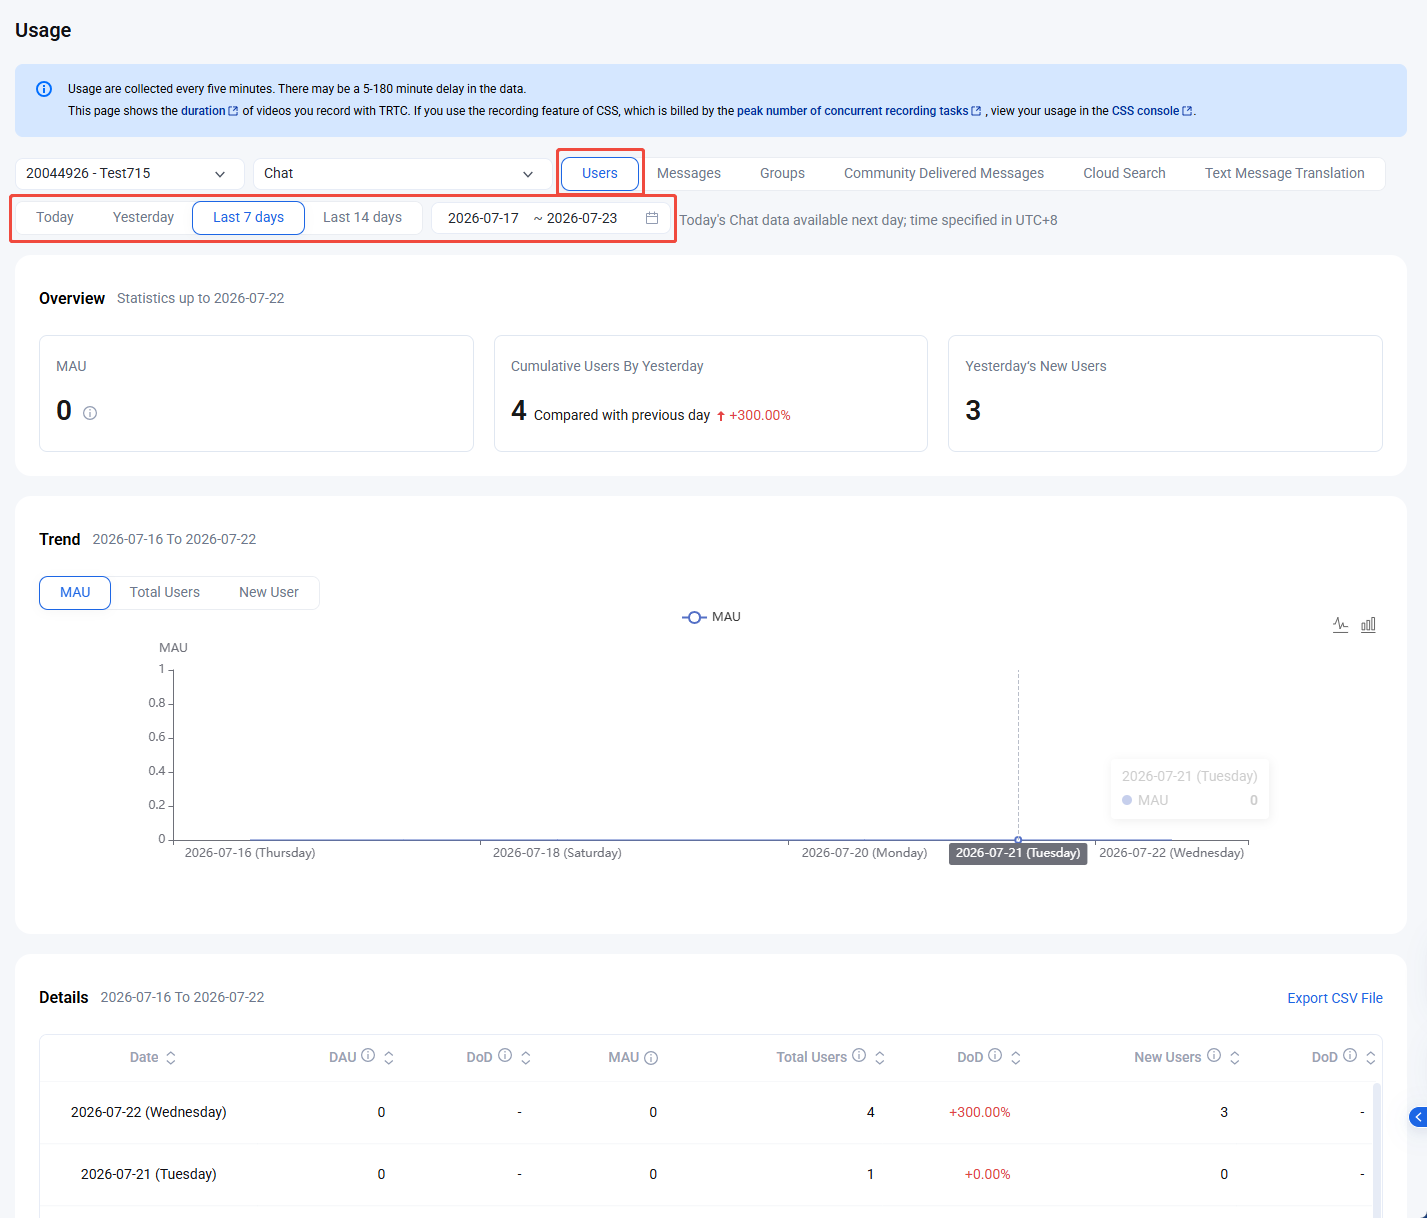
1. On the Usage page, click the User.
2. Select 7 days, 14 days, or 30 days, or specify a period.
3. In the overview area, you can view the following data:
Peak MAU of the current month: the peak MAU of the current month as of yesterday. This data is 0 on the first day of every month.
Cumulative number of users as of yesterday: the cumulative number of UserIDs registered with the SDKAppID as of yesterday.
Number of new registered users yesterday: the number of new UserIDs registered with the SDKAppID yesterday.
4. In the Trend area, you can view the MAU and New Users or Total Registered Users chart for the selected period.
5. In the Details area, you can view the data of each day for the selected period, including MAU, MAU (day-over-day), total users, total users (day-over-day), new registered users, and new registered users (day-over-day). You can also export these data by clicking Export CSV File.
Message
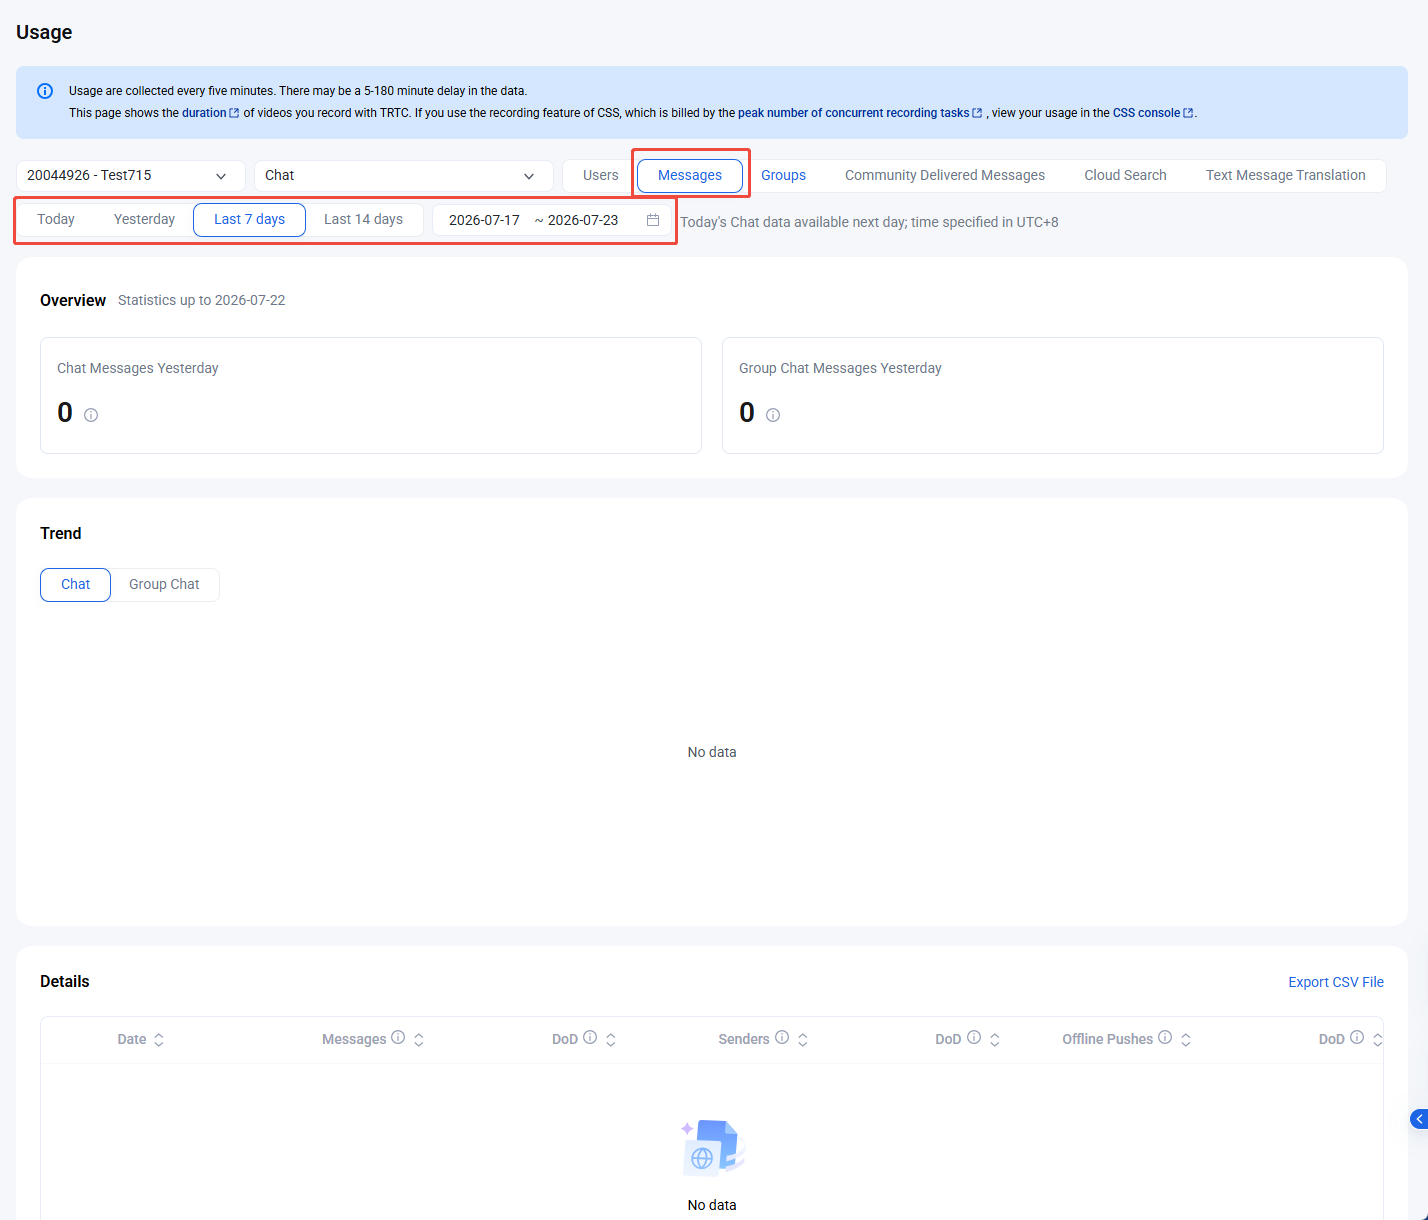
1. On the Usage page, click the Message.
2. Select 7 days, 14 days, or 30 days, or specify a period.
3. In the overview area, you can view the following data:
Number of one-to-one messages yesterday: the total number of C2C chat upstream messages under the SDKAppID yesterday.
Number of group messages yesterday: the total number of upstream messages in private group, public group, and chat room chats under the SDKAppID yesterday.
4. In the Trend area, you can view the C2C or Ordinary Group message count charts for the selected period.
5. In the Details area, you can view the data of each day for the selected period, including message count, message count (day-over-day), message senders, message senders (day-over-day), offline pushes, and offline pushes (day-over-day). You can also export these data by clicking Export as CSV.
Groups
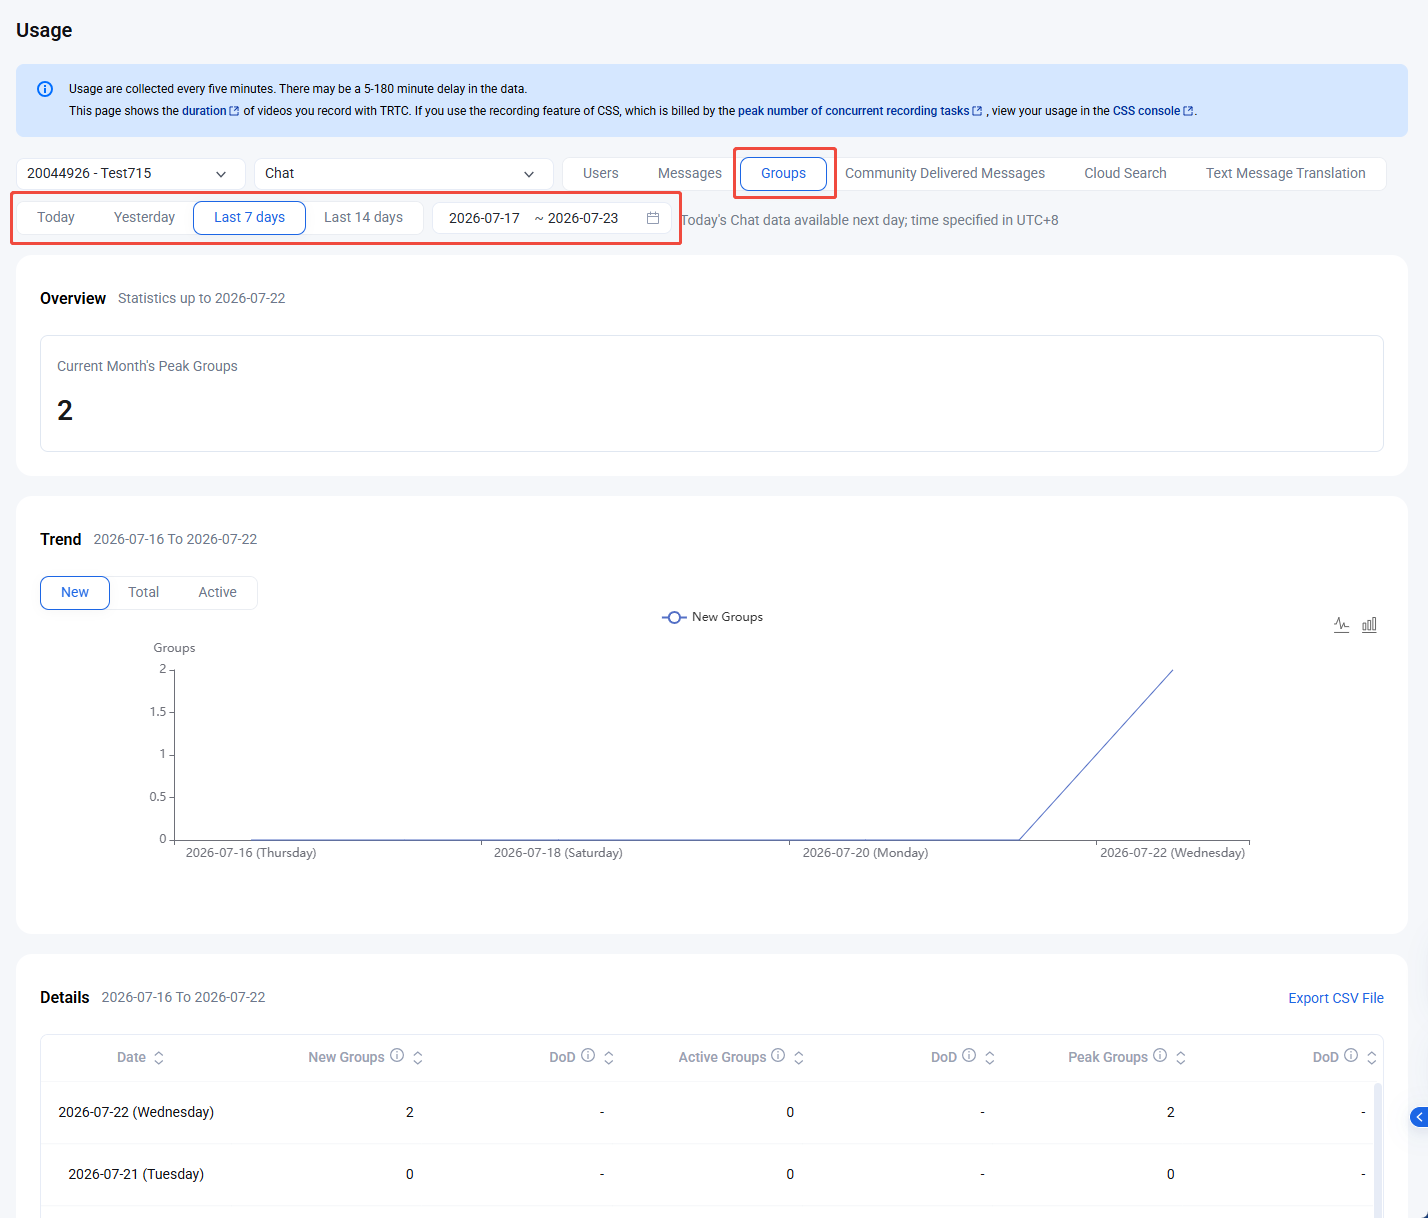
1. On the Usage page, click the Groups.
2. Select 7 days, 14 days, or 30 days, or specify a period.
3. In the overview area, you can view the Current Month's Peak Groups data, which is the peak group count of the current month as of yesterday under the SDKAppID. This is 0 on the first day of every month.
4. In the Trend area, you can select a data item to view the trends of New, Total, or Active groups within the selected time range.
5. In the Details area, you can view the data in each day for the selected period, including new groups, new groups (day-on-day), active groups, active groups (day-on-day), peak group count, and peak group count (day-on-day). You can also export these data by clicking Export as CSV.
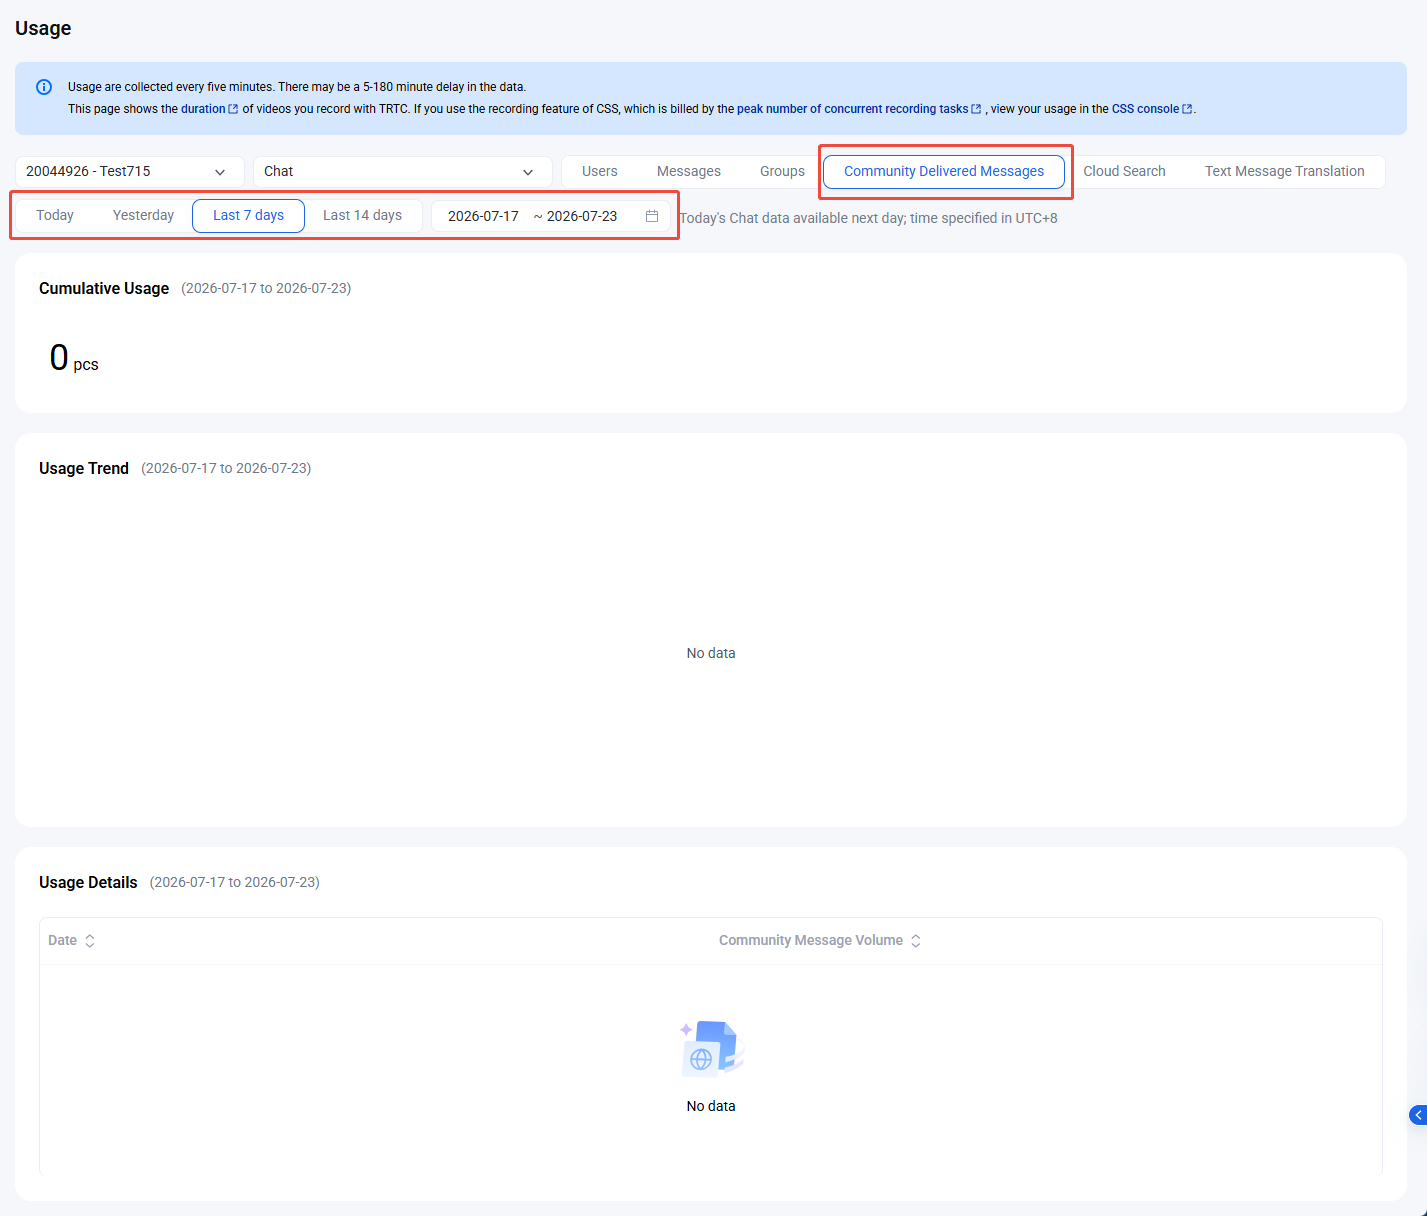
Community Delivered Messages
1. On the Usage page, select Community Delivered Messages.
2. Selectt 7 days, 14 days, or 30 days, or specify a period.
3. In the Cumulative Usage section, view the total message volume for the selected period.
4. In the Usage Trend section, view message volume trends for the selected period.
5. In the Usage Details section, access daily community message usage metrics for the selected period.
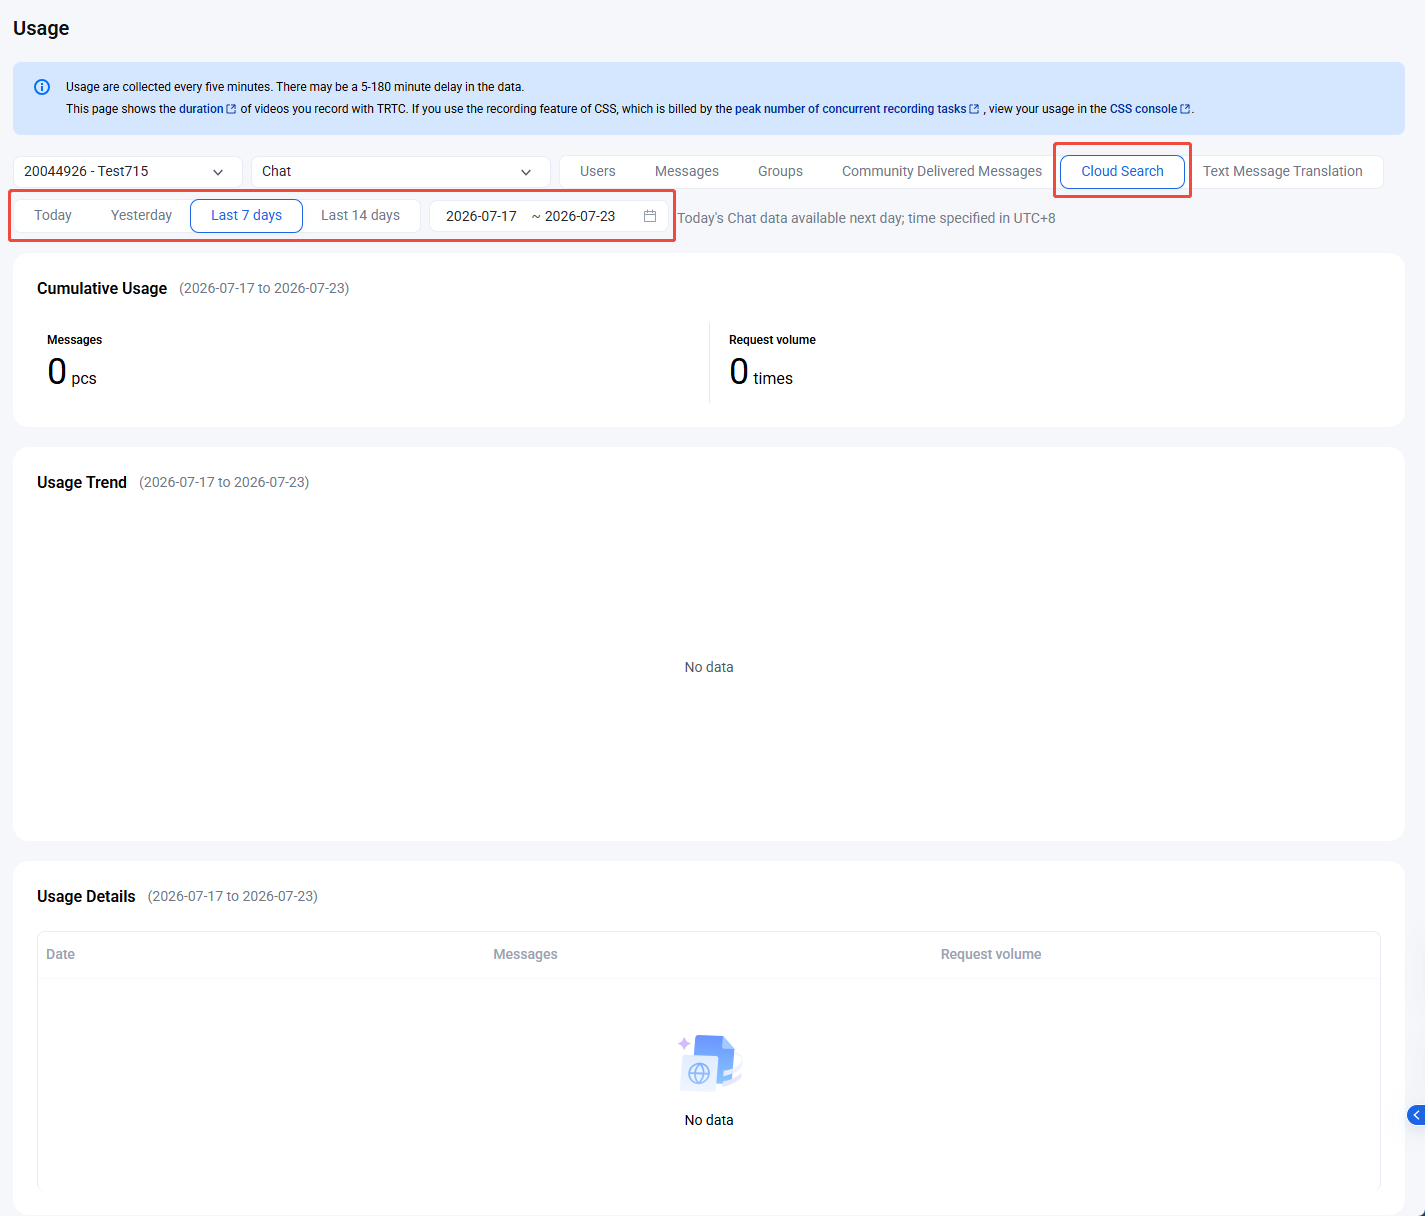
Cloud Search
1. On the Usage page, select Cloud Search.
2. Selectt 7 days, 14 days, or 30 days, or specify a period.
3. In the Cumulative Usage section, view cumulative Message and Requestvolume for the selected period.
4. In the Usage Trend section, view search usage trends for the selected period.
5. In the Usage Detail section, access daily cloud search usage metrics for the selected period.
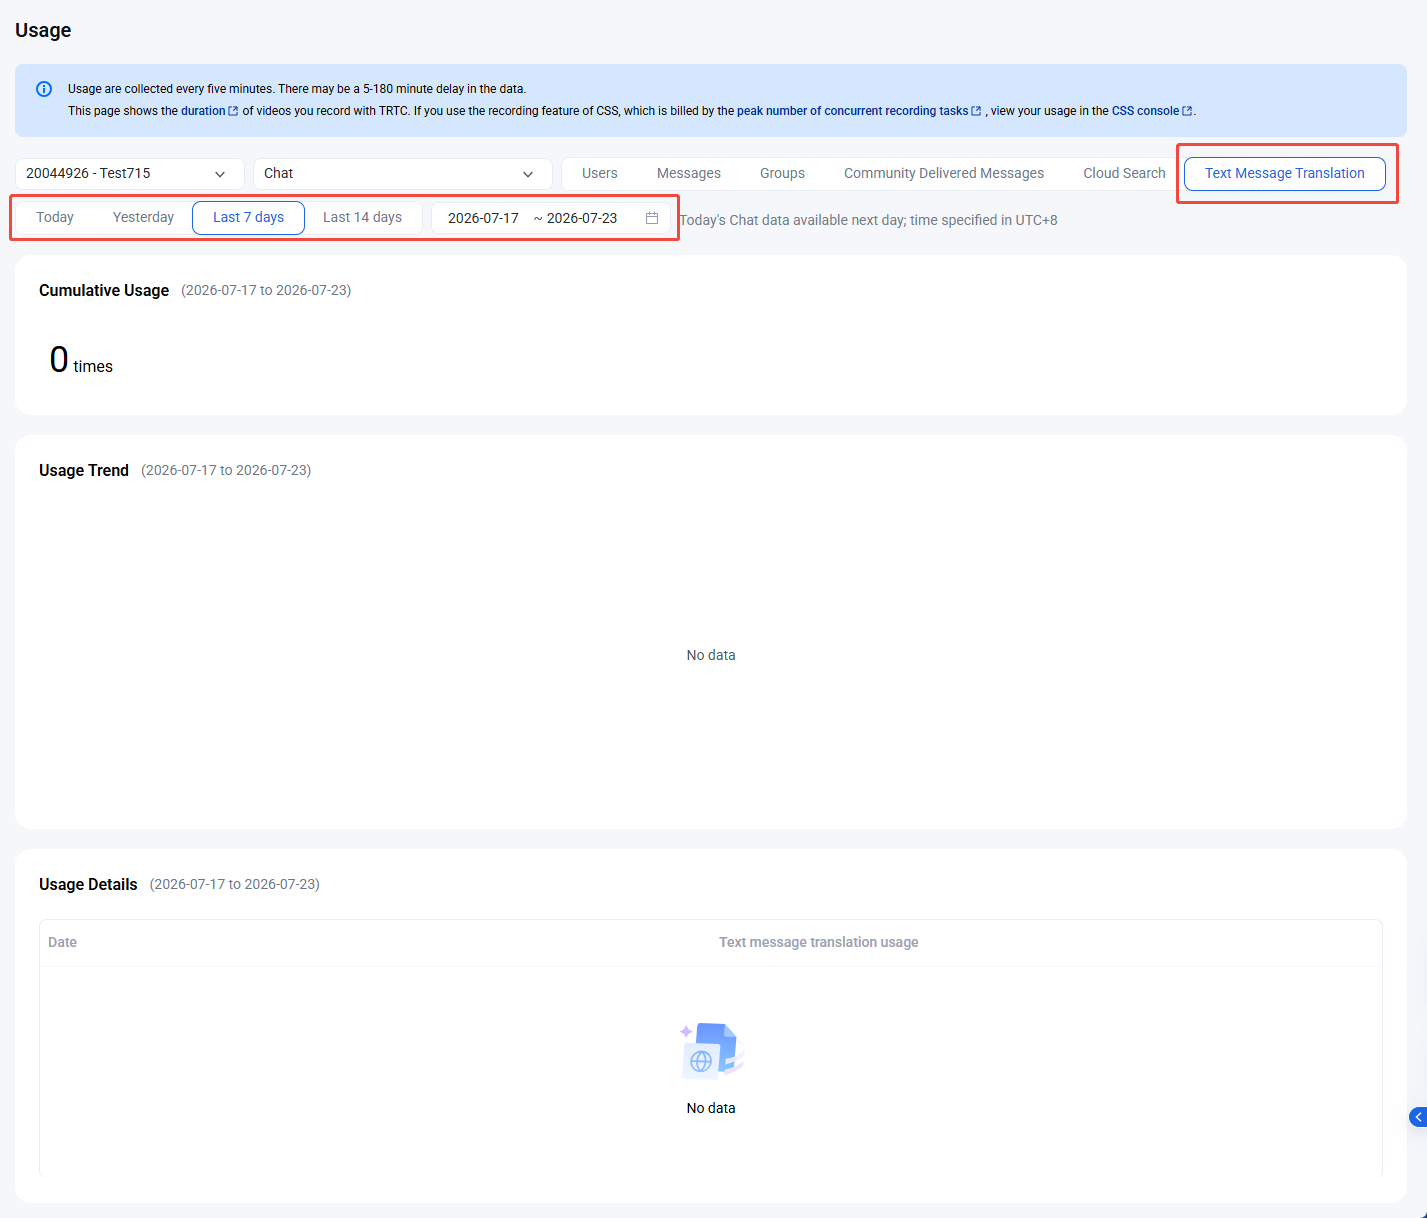
Text Message Translation
1. On the Usage page, select Text Message Translation.
2. Selectt 7 days, 14 days, or 30 days, or specify a period.
3. In the Cumulative Usage section, view the total number of translations performed during the selected period.
4. In the Usage Trend section, view translation request trends for the selected period.
5. In the Usage Detail section, access daily text message translation metrics for the selected period.