tencent cloud

Tencent Kubernetes Engine

Release Notes and Announcements
Release Notes
Announcements
Release Notes
Product Introduction
Overview
Strengths
Architecture
Scenarios
Features
Concepts
Native Kubernetes Terms
Common High-Risk Operations
Regions and Availability Zones
Service Regions and Service Providers
Open Source Components
Purchase Guide
Purchase Instructions
Purchase a TKE General Cluster
Purchasing Native Nodes
Purchasing a Super Node
Getting Started
Beginner’s Guide
Quickly Creating a Standard Cluster
Examples
Container Application Deployment Check List
Cluster Configuration
General Cluster Overview
Cluster Management
Network Management
Storage Management
Node Management
GPU Resource Management
Remote Terminals
Application Configuration
Workload Management
Service and Configuration Management
Component and Application Management
Auto Scaling
Container Login Methods
Observability Configuration
Ops Observability
Cost Insights and Optimization
Scheduler Configuration
Scheduling Component Overview
Resource Utilization Optimization Scheduling
Business Priority Assurance Scheduling
QoS Awareness Scheduling
Security and Stability
TKE Security Group Settings
Identity Authentication and Authorization
Application Security
Multi-cluster Management
Planned Upgrade
Backup Center
Cloud Native Service Guide
Cloud Service for etcd
TMP
TKE Serverless Cluster Guide
TKE Registered Cluster Guide
Use Cases
Cluster
Serverless Cluster
Scheduling
Security
Service Deployment
Network
Release
Logs
Monitoring
OPS
Terraform
DevOps
Auto Scaling
Containerization
Microservice
Cost Management
Hybrid Cloud
AI
Troubleshooting
Disk Full
High Workload
Memory Fragmentation
Cluster DNS Troubleshooting
Cluster kube-proxy Troubleshooting
Cluster API Server Inaccessibility Troubleshooting
Service and Ingress Inaccessibility Troubleshooting
Common Service & Ingress Errors and Solutions
Engel Ingres appears in Connechtin Reverside
CLB Ingress Creation Error
Troubleshooting for Pod Network Inaccessibility
Pod Status Exception and Handling
Authorizing Tencent Cloud OPS Team for Troubleshooting
CLB Loopback
API Documentation
History
Introduction
API Category
Making API Requests
Elastic Cluster APIs
Resource Reserved Coupon APIs
Cluster APIs
Third-party Node APIs
Relevant APIs for Addon
Network APIs
Node APIs
Node Pool APIs
TKE Edge Cluster APIs
Cloud Native Monitoring APIs
Scaling group APIs
Super Node APIs
Other APIs
Data Types
Error Codes
TKE API 2022-05-01
FAQs
TKE General Cluster
TKE Serverless Cluster
About OPS
Hidden Danger Handling
About Services
Image Repositories
About Remote Terminals
Event FAQs
Resource Management
Service Agreement
TKE Service Level Agreement
TKE Serverless Service Level Agreement
Contact Us
Glossary
DocumentaçãoTencent Kubernetes EngineUse CasesMonitoringUsing Prometheus to Monitor MySQL and MariaDB

Using Prometheus to Monitor MySQL and MariaDB

PDF
Modo Foco
Tamanho da Fonte
Última atualização: 2025-09-28 19:59:50

Overview

MySQL is a common relational database management system. As a branch of MySQL, MariaDB is compatible with MySQL and is becoming increasingly popular. In a Kubernetes environment, you can use Prometheus to monitor MySQL and MariaDB database using the open-source MySQL exporter. This document describes how to use Prometheus to monitor MySQL and MariaDB.

Introduction to MySQL Exporter

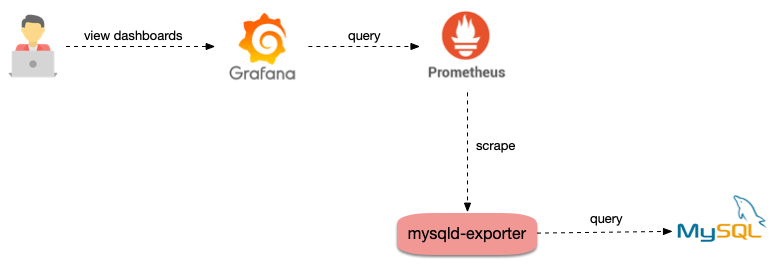
The MySQL exporter reads database status data from MySQL or MariaDB, converts it to Prometheus metric format, and opens it to the HTTP interface. In this case, Prometheus can collect and monitor these metrics.


Directions

Deploying the MySQL exporter

Note
Before deploying the MySQL exporter, ensure that MySQL or MariaDB has been deployed in the cluster, outside the cluster, or in the cloud service used.

Deploying MySQL

The following example shows how to deploy MySQL to a cluster from the Marketplace.
1. Log in to the TKE console and select Marketplace in the left sidebar.
2. On the Marketplace page, search for and click MySQL.
3. On the Application Details page, click Create Application.
4. On the Create Application page, enter the necessary information and click Create.
5. After the application is created, select Application in the left sidebar and view the details of the application on the page displayed.
6. Run the following command to check whether MySQL runs properly:
$ kubectl get pods
NAME READY STATUS RESTARTS AGE
mysql-698b898bf7-4dc5k 1/1 Running 0 11s
7. Run the following command to obtain the root password:
$ kubectl get secret -o jsonpath={.data.mysql-root-password} mysql | base64 -d
6ZAj33yLBo

Deploying the MySQL exporter

After deploying MySQL, deploy the MySQL exporter as follows:
1. Run the following commands in sequence to create a MySQL exporter account and log in to MySQL:
$ kubectl exec -it mysql-698b898bf7-4dc5k bash
$ mysql -uroot -p6ZAj33yLBo
2. Run the following command to create an account. mysqld-exporter/123456 is used as an example.
CREATE USER 'mysqld-exporter' IDENTIFIED BY '123456' WITH MAX_USER_CONNECTIONS 3;
GRANT PROCESS, REPLICATION CLIENT, REPLICATION SLAVE, SELECT ON *.* TO 'mysqld-exporter';
flush privileges;
3. Use the YAML file to deploy the MySQL exporter. An example is as follows:
Note
Replace the account, password, and MySQL connection address in DATA_SOURCE_NAME with real ones.
apiVersion: apps/v1
kind: Deployment
metadata:
name: mysqld-exporter
spec:
replicas: 1
selector:
matchLabels:
app: mysqld-exporter
template:
metadata:
labels:
app: mysqld-exporter
spec:
containers:
- name: mysqld-exporter
image: prom/mysqld-exporter:v0.12.1
args:
- --collect.info_schema.tables
- --collect.info_schema.innodb_tablespaces
- --collect.info_schema.innodb_metrics
- --collect.global_status
- --collect.global_variables
- --collect.slave_status
- --collect.info_schema.processlist
- --collect.perf_schema.tablelocks
- --collect.perf_schema.eventsstatements
- --collect.perf_schema.eventsstatementssum
- --collect.perf_schema.eventswaits
- --collect.auto_increment.columns
- --collect.binlog_size
- --collect.perf_schema.tableiowaits
- --collect.perf_schema.indexiowaits
- --collect.info_schema.userstats
- --collect.info_schema.clientstats
- --collect.info_schema.tablestats
- --collect.info_schema.schemastats
- --collect.perf_schema.file_events
- --collect.perf_schema.file_instances
- --collect.perf_schema.replication_group_member_stats
- --collect.perf_schema.replication_applier_status_by_worker
- --collect.slave_hosts
- --collect.info_schema.innodb_cmp
- --collect.info_schema.innodb_cmpmem
- --collect.info_schema.query_response_time
- --collect.engine_tokudb_status
- --collect.engine_innodb_status
ports:
- containerPort: 9104
protocol: TCP
env:
- name: DATA_SOURCE_NAME
value: "mysqld-exporter:123456@(mysql.default.svc.cluster.local:3306)/"
--
apiVersion: v1
kind: Service
metadata:
name: mysqld-exporter
labels:
app: mysqld-exporter
spec:
type: ClusterIP
ports:
- port: 9104
protocol: TCP
name: http
selector:
app: mysqld-exporter

Configuring monitoring data collection

After deploying the MySQL exporter, configure monitoring data collection to ensure that data exposed by the MySQL exporter can be collected. The following example shows ServiceMonitor definition (The cluster must support ServiceMonitor definition to configure collection rules):
apiVersion: monitoring.coreos.com/v1
kind: ServiceMonitor
metadata:
name: mysqld-exporter
spec:
endpoints:
interval: 5s
targetPort: 9104
namespaceSelector:
matchNames:
- default
selector:
matchLabels:
app: mysqld-exporter
The following example shows a native Prometheus configuration:
- job_name: mysqld-exporter
scrape_interval: 5s
kubernetes_sd_configs:
- role: endpoints
namespaces:
names:
- default
relabel_configs:
- action: keep
source_labels:
- __meta_kubernetes_service_label_app_kubernetes_io_name
regex: mysqld-exporter
- action: keep
source_labels:
- __meta_kubernetes_endpoint_port_name
regex: http

Adding a monitoring dashboard

Once data can be collected, add a monitoring dashboard for Grafana to display data.
If you only need to view the MySQL or MariaDB overview information, import the grafana.com dashboard, as shown in the figure below.

If a dashboard with more features is required, import JSON files prefixed with MySQL_ in the percona open-source dashboard.

Ajuda e Suporte

Esta página foi útil?

comentários