Overview
Download
포커스 모드
폰트 크기
This document will introduce the features and operation steps of each module of Security Overview.
Overview
The Security Overview in CSC displays your security score, pending risks, protection status, risk trends, and real-time security events. It also pushes security bulletins to keep you informed of the latest threat intelligence. Furthermore, it provides help documentation and CSC upgrade service recommendations to help you defend against hacker intrusions and attack threats, thereby safeguarding your enterprise cloud assets.
Operation Guide
Log in to the CSC console. In the left-side navigation pane, click Security Overview to go to the Security Overview page. This page provides security overview information and related processing operations. The features of each module are described as follows:
Security Status
1. On the Security Overview page, your CSC score and security risk status are displayed, and quick processing entry points are provided.
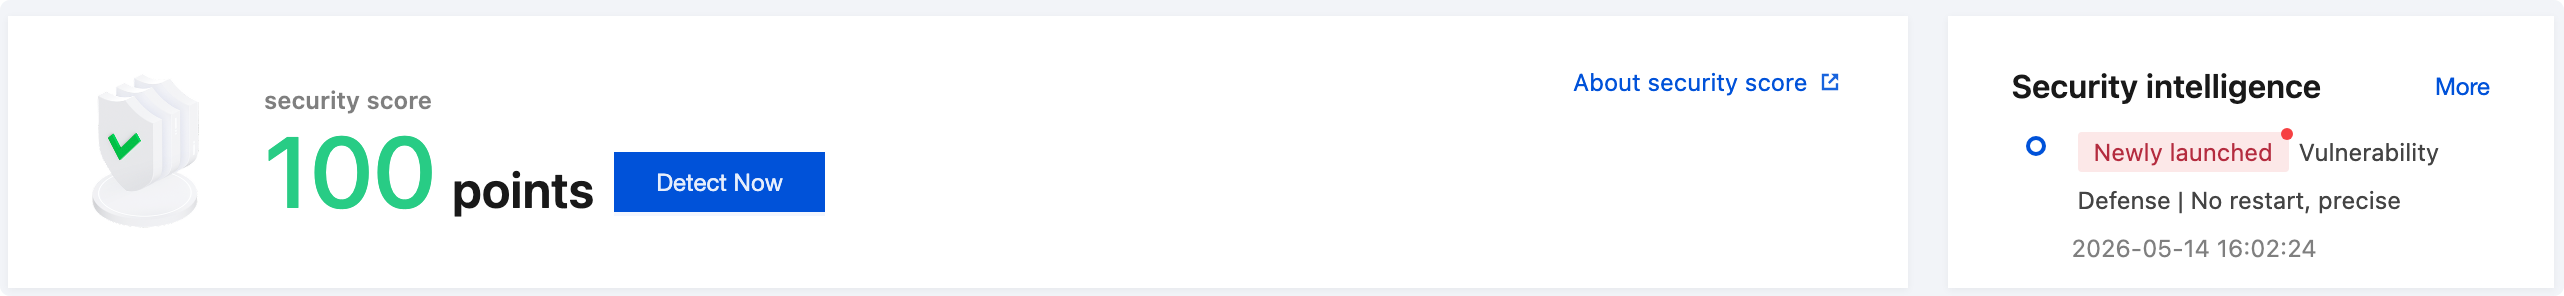
The CSC security score is divided into three levels:
Level | Score Range | Color | Status Description |
Excellent | 90-100 points | Green | The asset safety status is good and needs to be maintained and inspected regularly. |
Medium Risk | 60-89 points | Orange | There are relatively many security risks in assets. It is recommended that you handle security incidents in a timely manner. |
Highly risky | 20-59 points | Red | Serious security risks exist in the assets. Handle the security incident as soon as possible. |
Note:
The minimum score for the CSC status check is 20 points.
Deduction items will be calculated based on the classification of security incidents. The following are the security incident classification and deduction rules:
Level | Severity (Counted by the Number of Events) | Points Deducted per Event | Maximum Deduction |
Critical | Trojan files, successful brute-force attacks, malicious requests | -40 points | -50 points |
Highly risky | Critical vulnerabilities, high-risk vulnerabilities, critical baseline, high-risk baseline, abnormal login (high-risk), local privilege escalation, reverse Shell | -10 points | -20 points |
Medium Risk | Medium-risk vulnerabilities, medium-risk baseline | -3 points | -10 points |
Low-risk | Low-risk vulnerabilities, low-risk baseline | -2 points | -5 points |
Others | Basic protection, CWPP client not installed | -1 point | -5 points |
2. On the Security Overview page, click Handle Now on the security score to open the risk handling details dialog box. On the Risk Handling Details page, you can view the specific details of vulnerability risks, intrusion detection, baseline risks, and network risks. Click Handle Now on the corresponding risk card, and the page will jump to the corresponding risk handling page.
Vulnerability management: Includes Linux software vulnerabilities, Windows system vulnerabilities, Web-CMS vulnerabilities, and application vulnerabilities. It aggregates the number of pending risks and affected hosts.
Intrusion detection: Includes seven detection features, namely malicious file scan, abnormal logins, password cracking, malicious requests, reverse shells, local privilege escalation, and high-risk commands. It displays the total number of pending risks and affected hosts.
Baseline management: Only counts the number of pending baseline risks and affected hosts.
Network defense: Counts the number of pending risks from attack events and affected hosts.
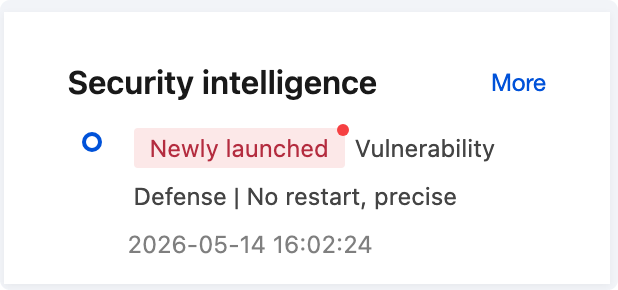
Security Bulletin
The Security Broadcast feature displays information about related product feature updates, industry honors, urgent notifications, and version releases. Click More to view each broadcast message. Click the content of a single broadcast to view its details.
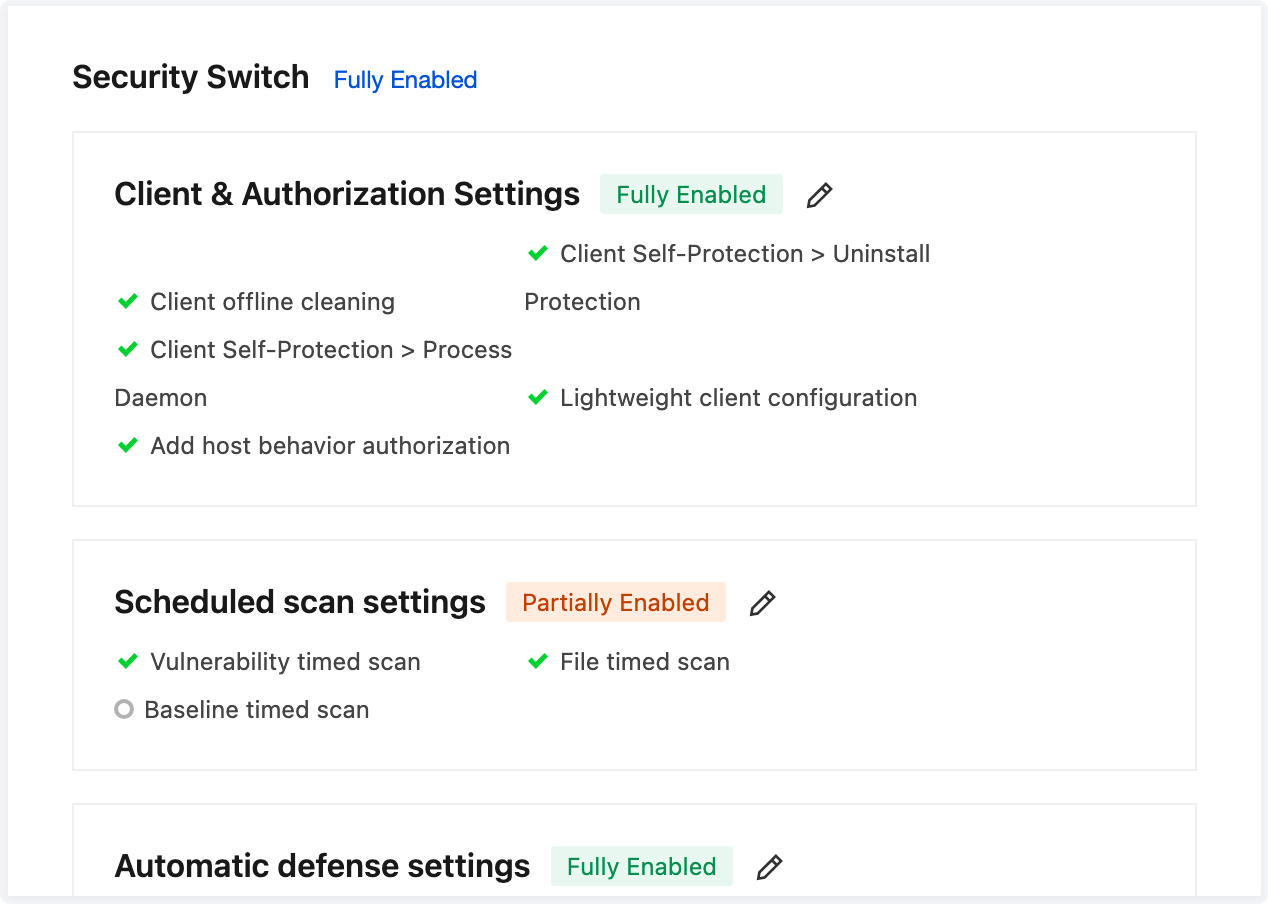
Security Switch
1. The Security Switch provides centralized management and quick configuration for CSC's core security features. Through the Security Switch, you can centrally view and manage the enabled status of CSC's core security features, including client & authorization settings, scheduled scan settings, and automatic defense settings.
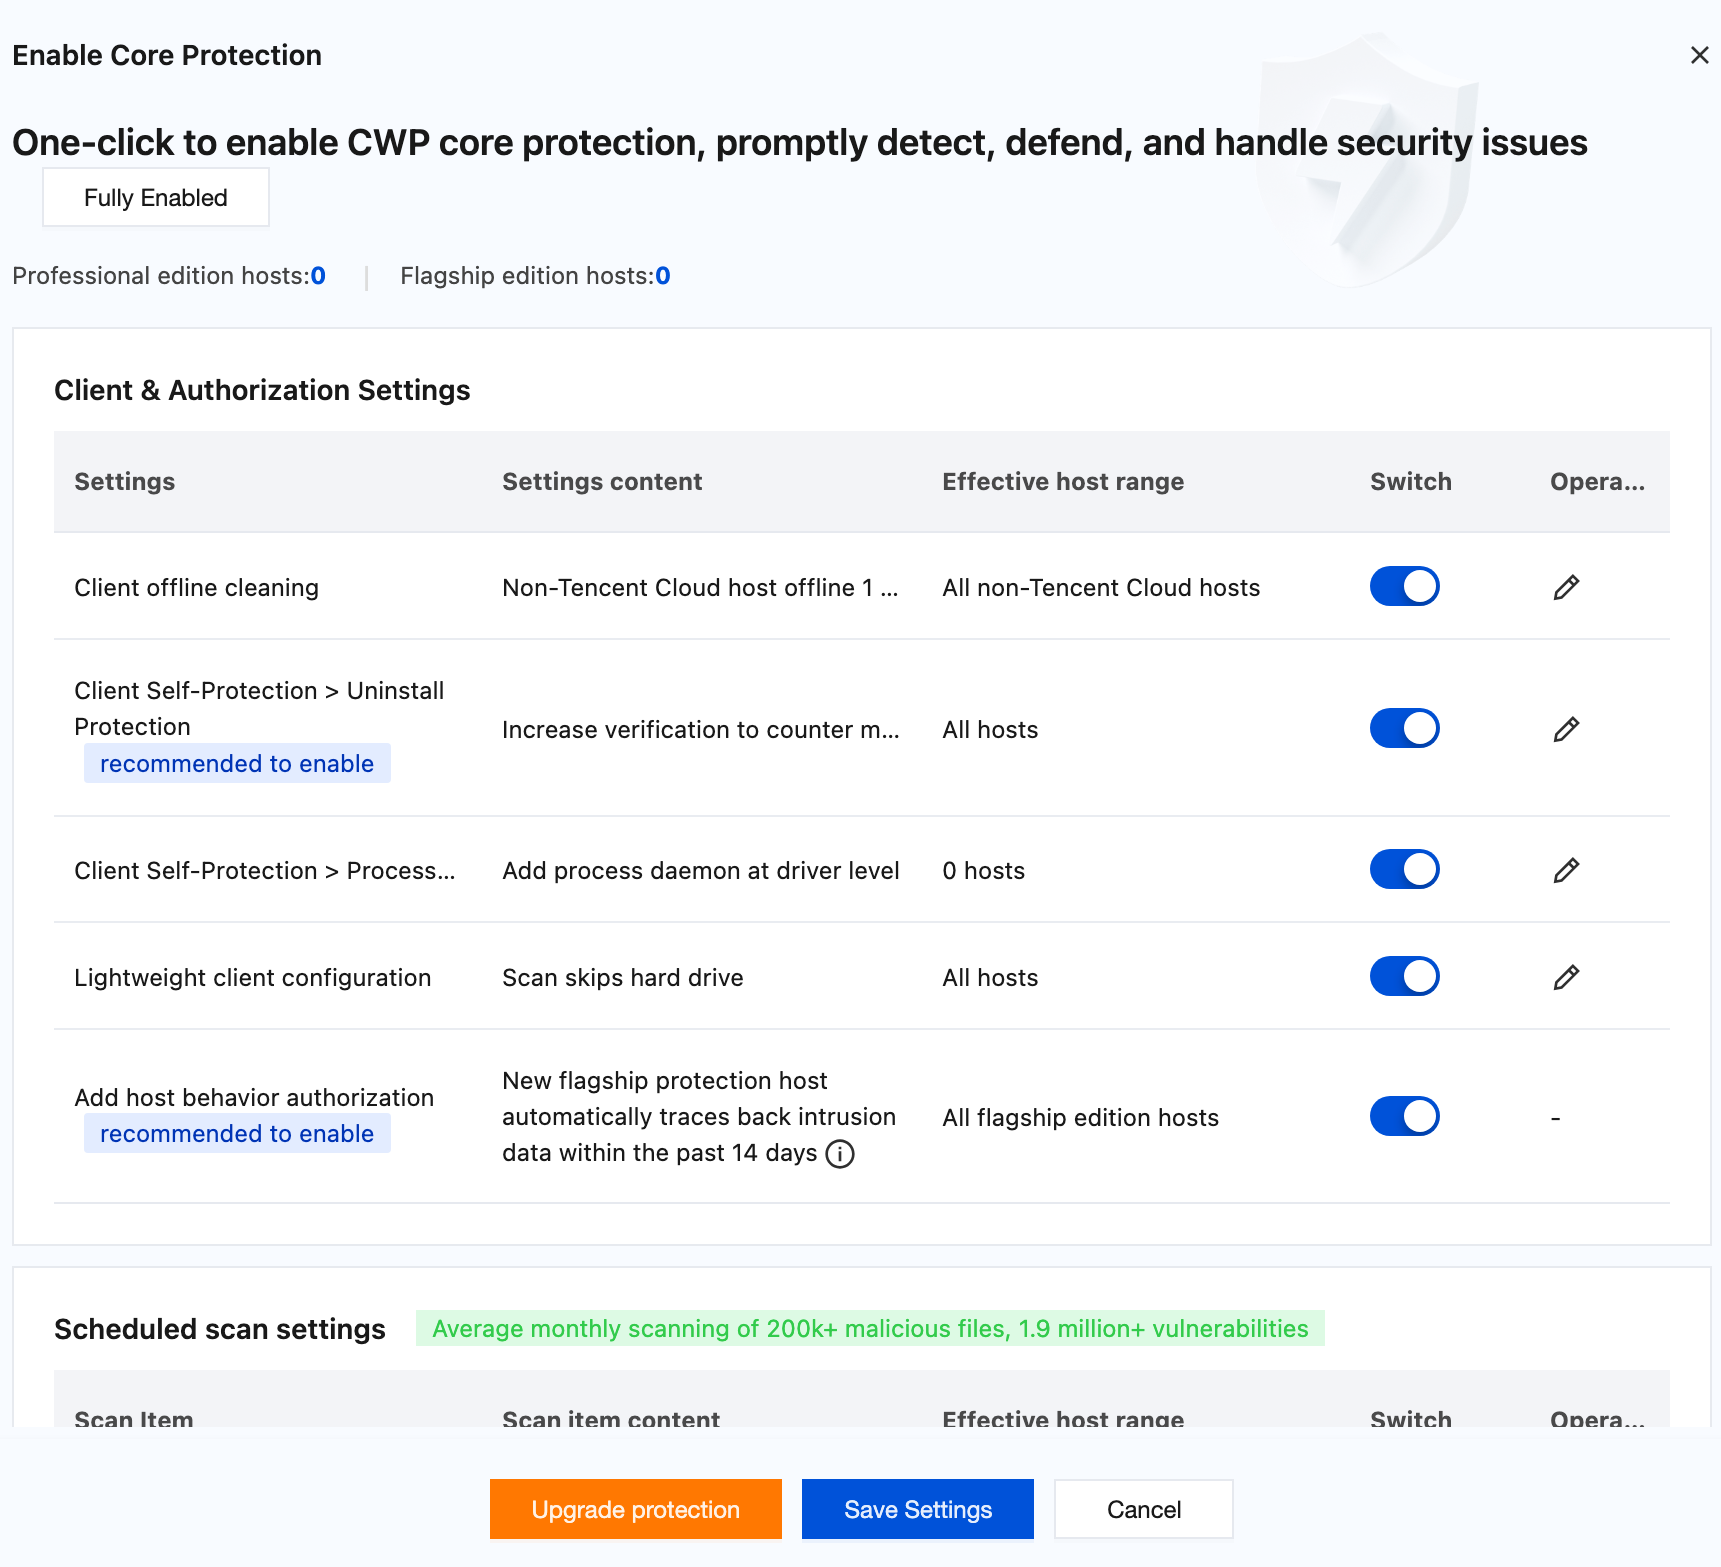
2. Click Edit to open the Enable Core Protection Settings dialog box. You can view the host protection version distribution and license usage, check the content of each setting item and the scope of effective hosts, and enable, disable, or edit each core protection feature as needed.
Protection Details
In the Protection Details feature, you can view the total number of hosts, the total number of online hosts, the number of hosts that are shut down or offline, the number of hosts without a client installed, the number of currently protected hosts, the quantities of the flagship, professional, and basic editions, the log analysis usage, and the number of web tamper-proofing licenses. It also provides information such as the asset update time, virus database update time, vulnerability database update time, and security engine protection.
Note:
Because the Basic Edition provides relatively weaker host protection, the "Number of Protected Hosts" includes only Ultimate and Professional Edition hosts.
Field description:
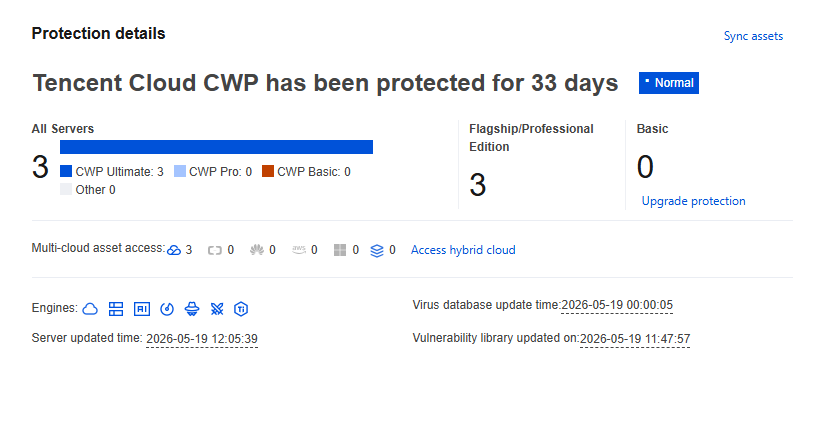
Click Sync assets in the upper right corner to update asset information.
On a host without a client installed, click Install. The page then displays the installation guide.
To the right of the number of unprotected hosts, click Upgrade protection. You will be redirected to the CSC purchase page, where you can purchase additional licenses to provide your hosts with more robust risk and threat defense capabilities.
The Security Engine Protection section displays 7 engine icons, representing the Cloud Scan Engine, BinaryAI Engine, TAV Engine, Abnormal Behavior Engine, Threat Intelligence Engine, Attack Defense Engine, Taishi Engine. If a protection feature is not enabled, its corresponding icon appears grayed out. If any host has the protection feature enabled, its corresponding icon appears lit up.
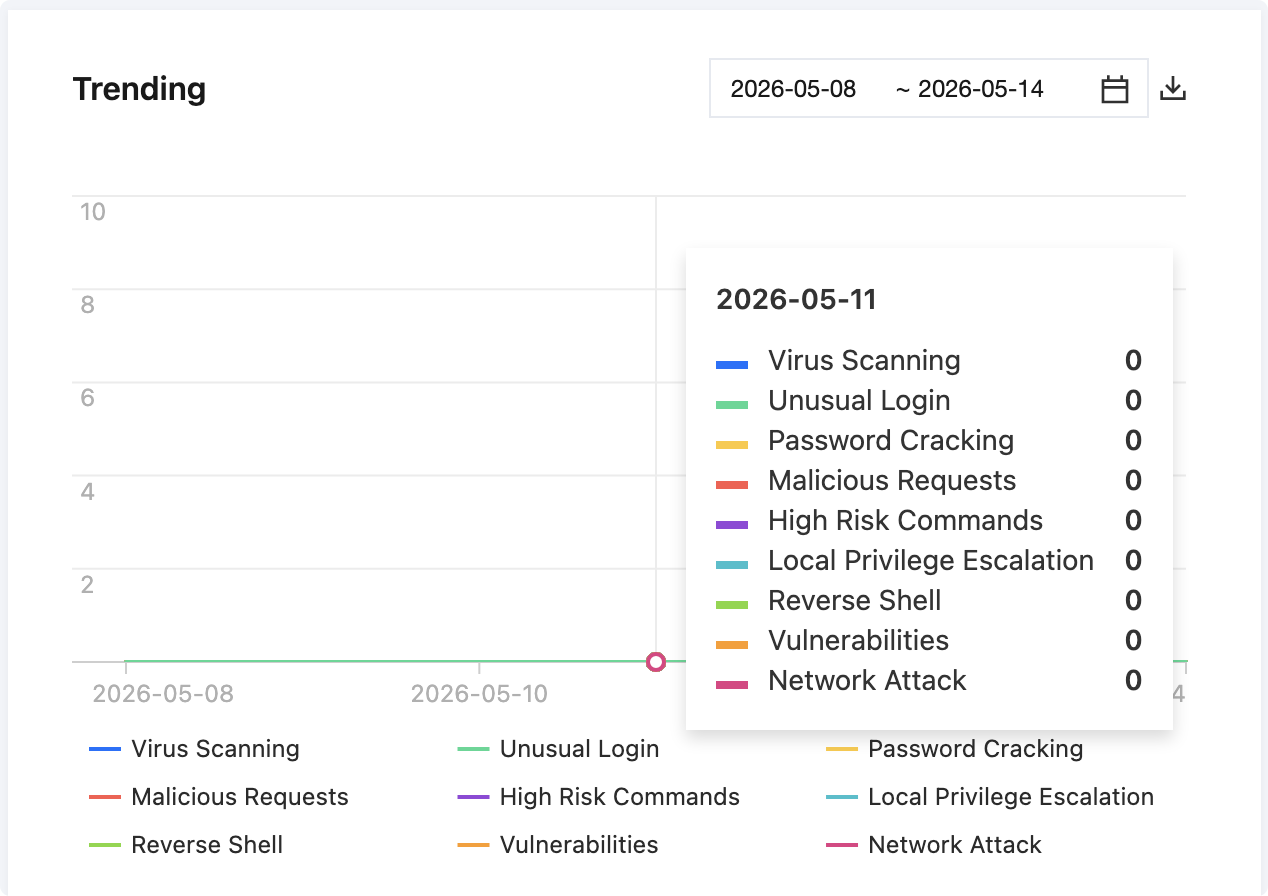
Risk Trends
The Risk Trend feature uses a line chart to show you the trends of security risks and threats over the past 7, 14, or 30 days. It also supports filtering the view by time period. Hover your mouse over the trend chart to display the number of security events for that date, such as file detection, abnormal logins, password cracking, malicious requests, high-risk commands, local privilege escalation, reverse shells, vulnerability risks, and network attacks. Click the Export icon in the upper right corner to download the number of security events for the selected date to your local machine.
Note:
The data represents newly detected risks for the day and is updated hourly. Historical events are retained and not changed.
Real-Time Monitoring
The Real-time Activity feature displays detected host risks and threat events in reverse chronological order. Click the Host IP in the blue field to navigate to the corresponding subpage of the "Host Details" page. Click View Details on the right side of the event activity to navigate to the corresponding event handling page.
피드백