tencent cloud

Elastic MapReduce

  • Release Notes and Announcements
  • Product Introduction
  • Purchase Guide
    • EMR on CVM Billing Instructions
    • EMR on TKE Billing Instructions
    • EMR Serverless HBase Billing Instructions
    • EMR Serverless TCBase Billing Overview
  • Getting Started
  • EMR on CVM Operation Guide
    • Planning Cluster
    • Administrative rights
    • Configuring Cluster
    • Managing Cluster
    • Managing Service
    • Monitoring and Alarms
    • TCInsight
  • EMR on TKE Operation Guide
  • EMR Serverless HBase Operation Guide
  • EMR Serverless TCBase Operation Guide
  • EMR Development Guide
    • Hadoop Development Guide
    • Spark Development Guide
    • Hbase Development Guide
    • Phoenix on Hbase Development Guide
    • Hive Development Guide
    • Presto Development Guide
    • Sqoop Development Guide
    • Hue Development Guide
    • Oozie Development Guide
    • Flume Development Guide
    • Kerberos Development Guide
    • Knox Development Guide
    • Alluxio Development Guide
    • Kylin Development Guide
    • Livy Development Guide
    • Kyuubi Development Guide
    • Zeppelin Development Guide
    • Hudi Development Guide
    • Superset Development Guide
    • Impala Development Guide
    • Druid Development Guide
    • TensorFlow Development Guide
    • Kudu Development Guide
    • Ranger Development Guide
    • Kafka Development Guide
    • StarRocks Development Guide
    • Flink Development Guide
    • JupyterLab Development Guide
    • MLflow Development Guide
  • Practical Tutorial
    • Practice of EMR on CVM Ops
    • Data Migration
    • Practical Tutorial on Custom Scaling
  • API Documentation
    • History
    • Introduction
    • API Category
    • Making API Requests
    • Cluster Resource Management APIs
    • Cluster Services APIs
    • User Management APIs
    • Information Query APIs
    • Scaling APIs
    • Configuration APIs
    • Other APIs
    • Cluster Lifecycle APIs
    • Serverless HBase APIs
    • YARN Resource Scheduling APIs
    • Data Types
    • Error Codes
  • FAQs
    • EMR on CVM
  • Service Level Agreement
  • Contact Us

Node Status

Download
フォーカスモード
フォントサイズ
最終更新日: 2023-12-27 14:38:20

Overview

The Node status page displays the monitoring overview and list of all nodes in the current cluster. It enables you to view heat maps of all nodes. You can manage the status information and metrics of nodes in the EMR console.

Directions

1. Log in to the EMR console and click the ID/Name of the target cluster in the cluster list to enter the cluster details page.
2. Select Cluster resources > Node status to view the monitoring information of all nodes in the cluster.
3. On the Node status page, view aggregated monitoring metrics and list of all nodes in the cluster.


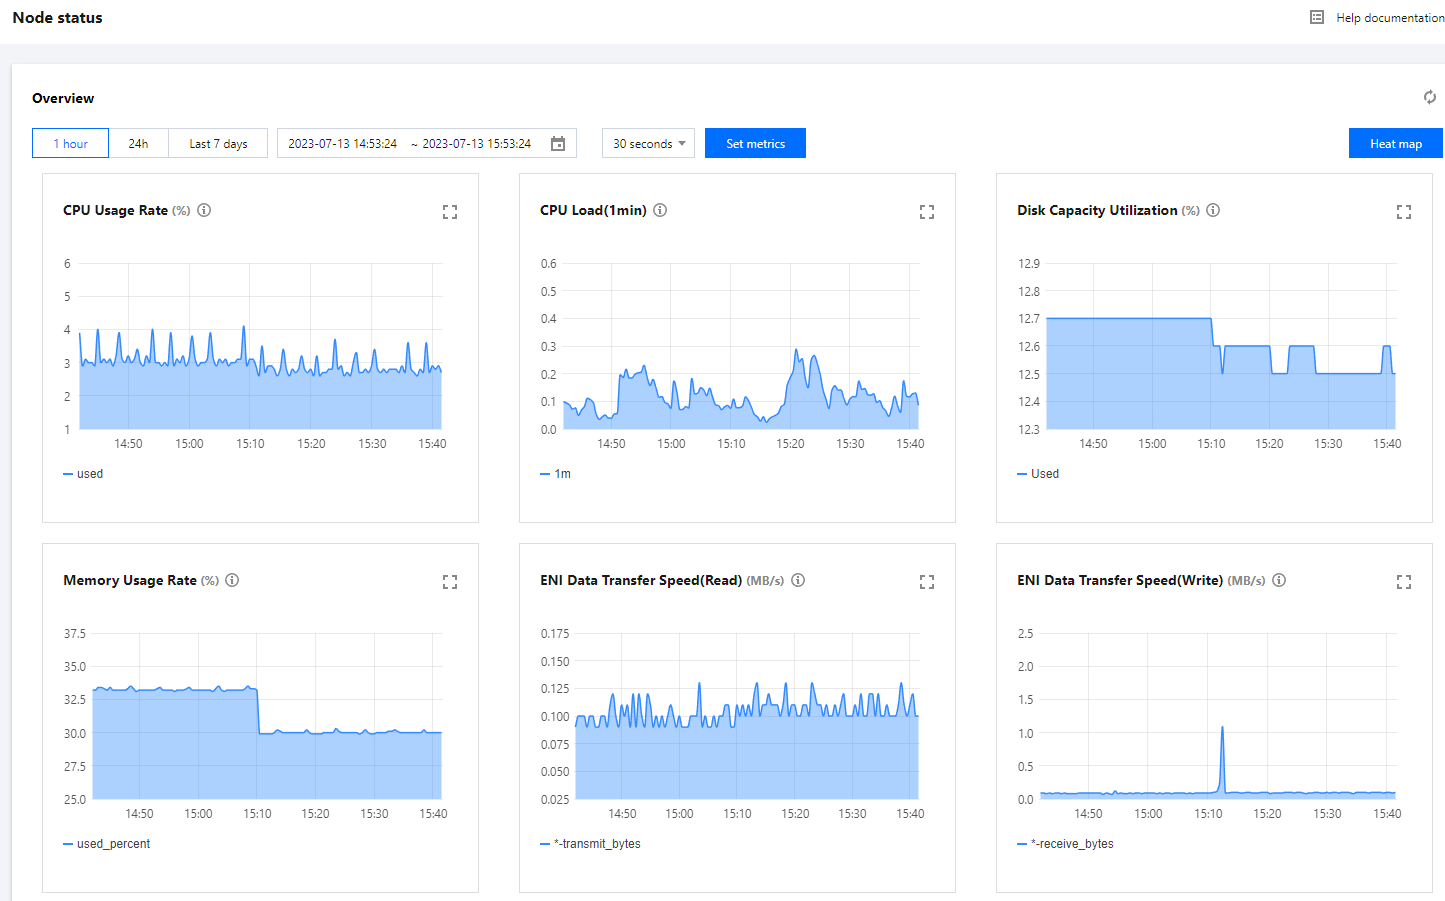
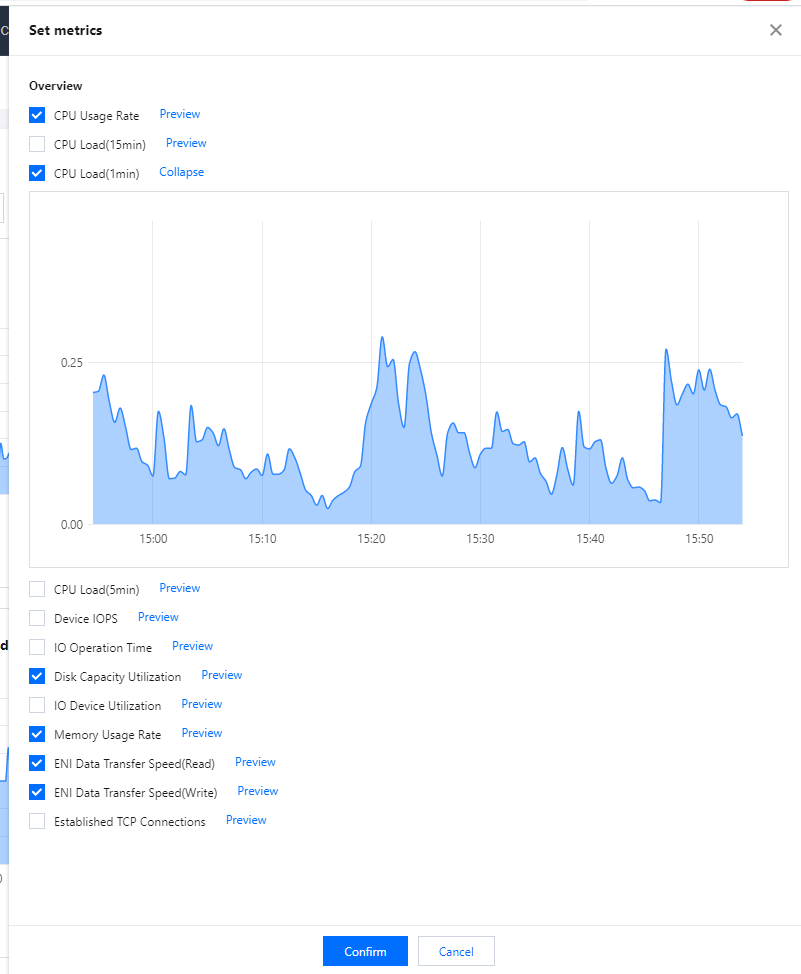
Overview: Displays aggregated monitoring metrics of all nodes during a specified period of time and the statistical rule of each metric. You can click Set metrics to customize the displayed metrics.

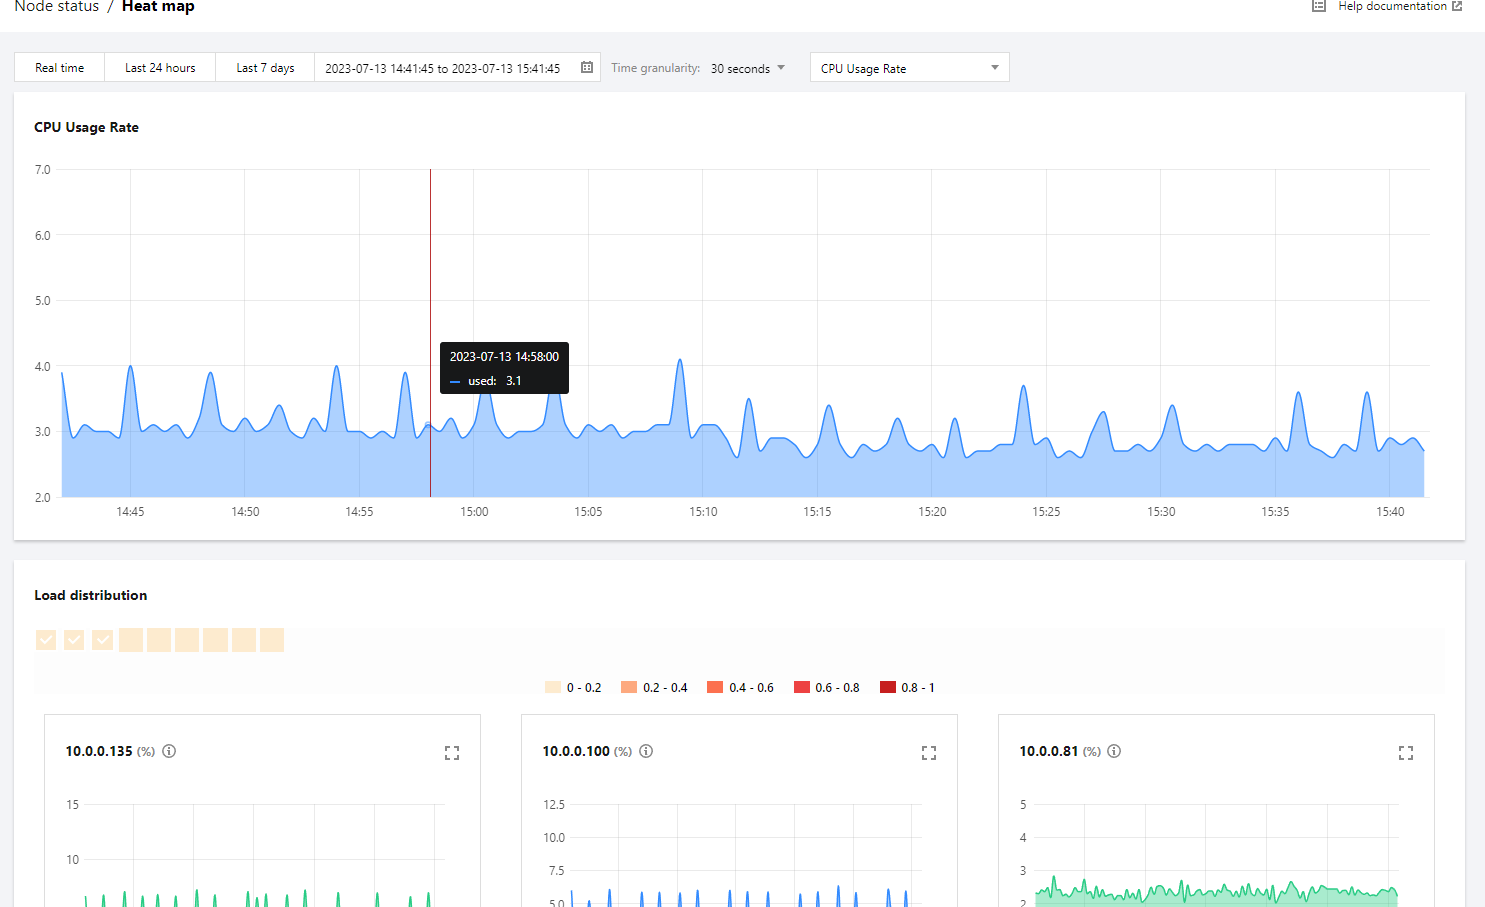
Heat map: Displays the loads of nodes. You can view the maps for a specified period of time and under specified load conditions. Load heat maps consist of two parts: the aggregated map of all nodes in the current cluster and individual heat map of each node.

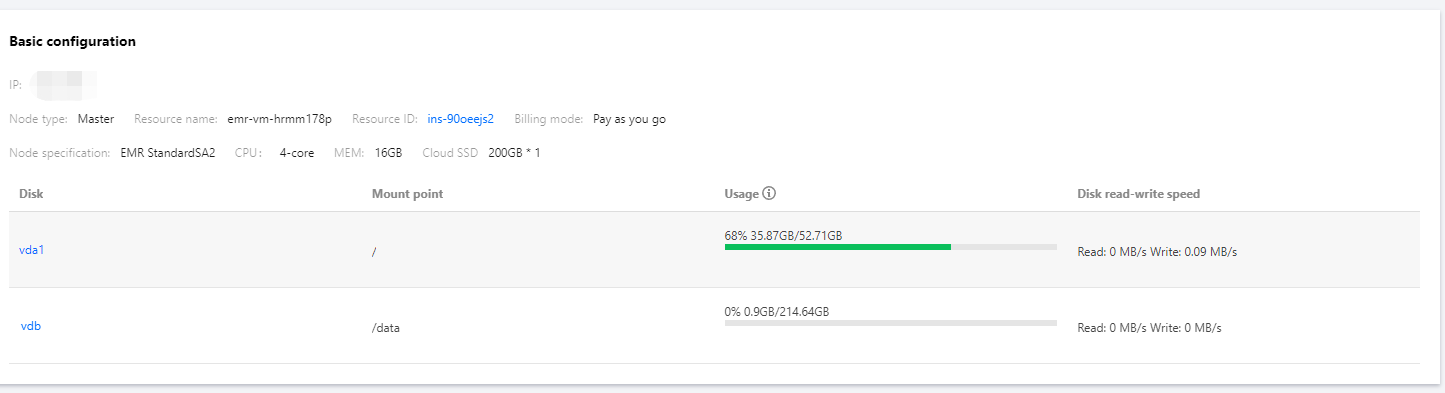
Node list: Displays all nodes in the cluster, including type, CPU utilization, memory utilization, disk utilization, and other items. You can click the IP of a node to view its basic configurations, deployment status, load status, and monitoring information. Basic configurations: Display basic information of the node, such as type, resource name, resource ID, billing mode, and spec.

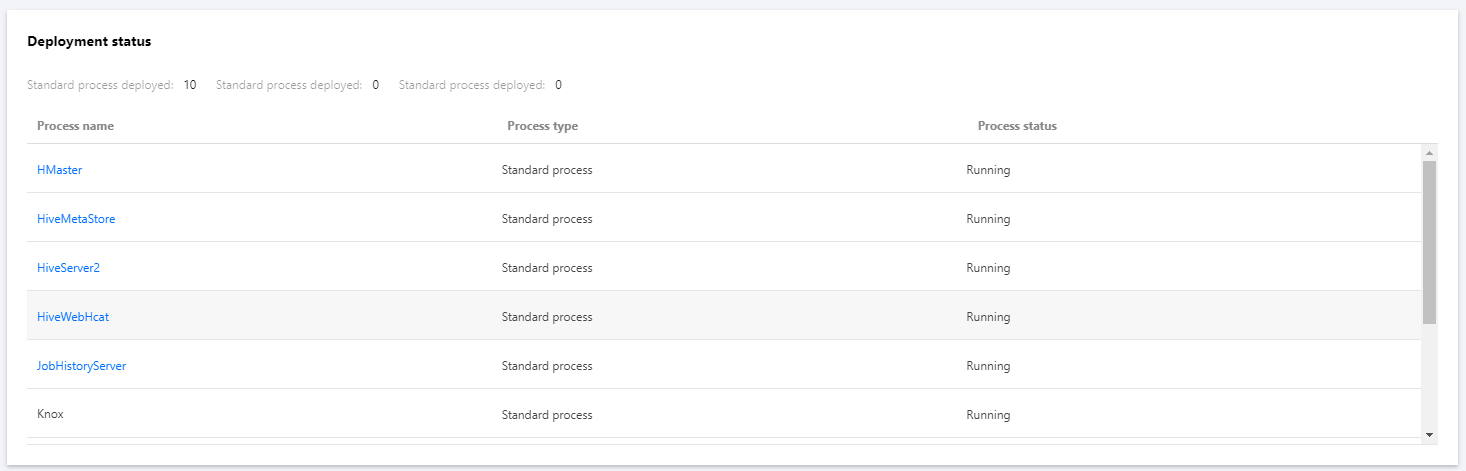
Deployment status: Display services deployed in the node, process type, and process status.

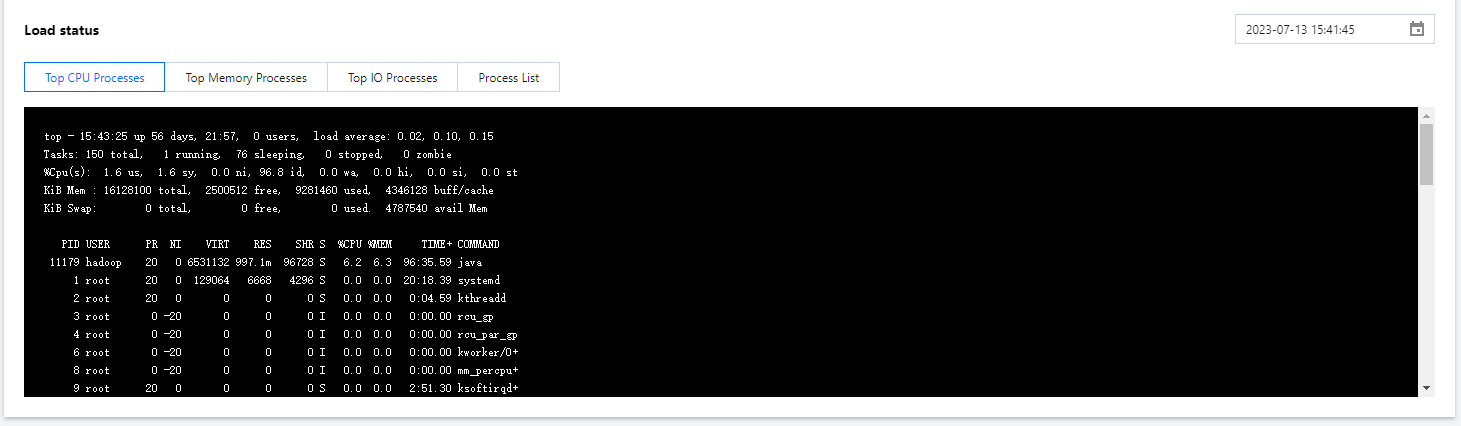
Load status: Displays top N processes in the node. You can view the data on a specified date.

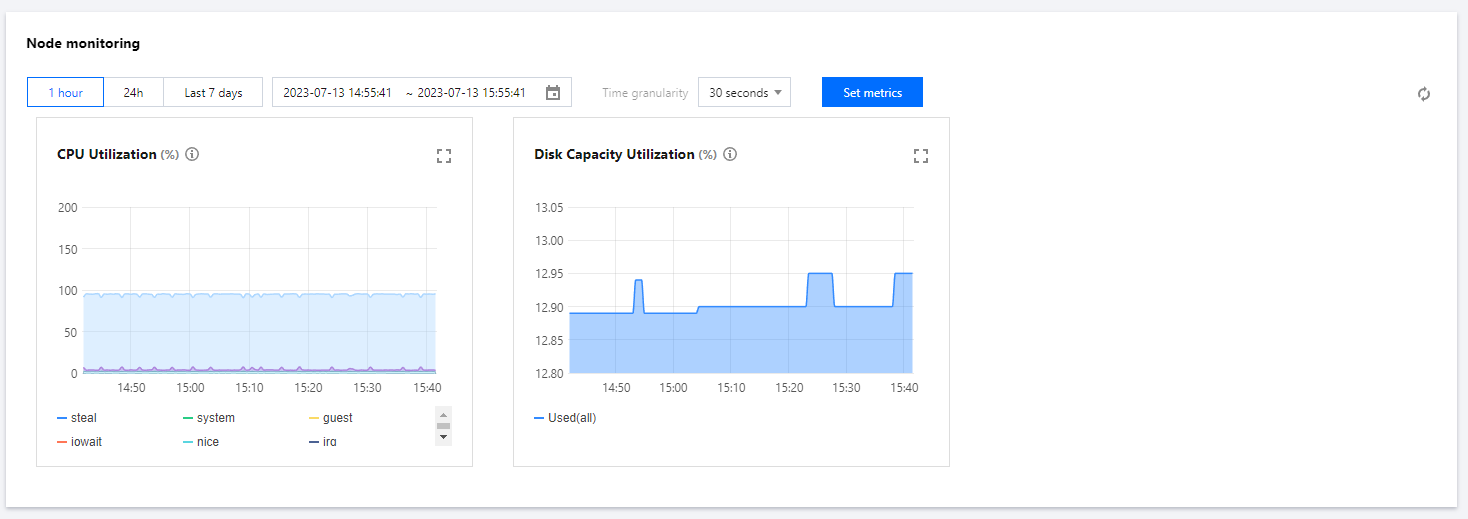
Node monitoring: Displays load maps of metrics (6 by default and max 12) of the node. You can click Set metrics to customize the displayed metrics.


ヘルプとサポート

この記事はお役に立ちましたか?

フィードバック