tencent cloud

Elastic MapReduce

  • Release Notes and Announcements
  • Product Introduction
  • Purchase Guide
    • EMR on CVM Billing Instructions
    • EMR on TKE Billing Instructions
    • EMR Serverless HBase Billing Instructions
    • EMR Serverless TCBase Billing Overview
  • Getting Started
  • EMR on CVM Operation Guide
    • Planning Cluster
    • Administrative rights
    • Configuring Cluster
    • Managing Cluster
    • Managing Service
    • Monitoring and Alarms
    • TCInsight
  • EMR on TKE Operation Guide
  • EMR Serverless HBase Operation Guide
  • EMR Serverless TCBase Operation Guide
  • EMR Development Guide
    • Hadoop Development Guide
    • Spark Development Guide
    • Hbase Development Guide
    • Phoenix on Hbase Development Guide
    • Hive Development Guide
    • Presto Development Guide
    • Sqoop Development Guide
    • Hue Development Guide
    • Oozie Development Guide
    • Flume Development Guide
    • Kerberos Development Guide
    • Knox Development Guide
    • Alluxio Development Guide
    • Kylin Development Guide
    • Livy Development Guide
    • Kyuubi Development Guide
    • Zeppelin Development Guide
    • Hudi Development Guide
    • Superset Development Guide
    • Impala Development Guide
    • Druid Development Guide
    • TensorFlow Development Guide
    • Kudu Development Guide
    • Ranger Development Guide
    • Kafka Development Guide
    • StarRocks Development Guide
    • Flink Development Guide
    • JupyterLab Development Guide
    • MLflow Development Guide
  • Practical Tutorial
    • Practice of EMR on CVM Ops
    • Data Migration
    • Practical Tutorial on Custom Scaling
  • API Documentation
    • History
    • Introduction
    • API Category
    • Making API Requests
    • Cluster Resource Management APIs
    • Cluster Services APIs
    • User Management APIs
    • Information Query APIs
    • Scaling APIs
    • Configuration APIs
    • Other APIs
    • Cluster Lifecycle APIs
    • Serverless HBase APIs
    • YARN Resource Scheduling APIs
    • Data Types
    • Error Codes
  • FAQs
    • EMR on CVM
  • Service Level Agreement
  • Contact Us

Cluster Overview

Download
フォーカスモード
フォントサイズ
最終更新日: 2023-12-27 14:37:51

Feature overview

Cluster overview displays a summary of cluster operation status, where you can view the cluster operation status, core service metrics, core node metrics, and top 10 nodes.

Directions

1. Log in to the EMR console and click the ID/Name of the target cluster in the cluster list to enter the cluster details page.
2. On the cluster details page, select Cluster Monitor > Cluster Overview to view the overall status of the current cluster. The Cluster Overview page provides four monitoring views in the cluster dimension, namely, overall status of cluster, key cluster metrics, cluster deployment status, and top 10 nodes.
Overall cluster conditions: This view displays the current cluster status, node quantity, metadatabase online status, component health status, and events in the cluster within one hour.

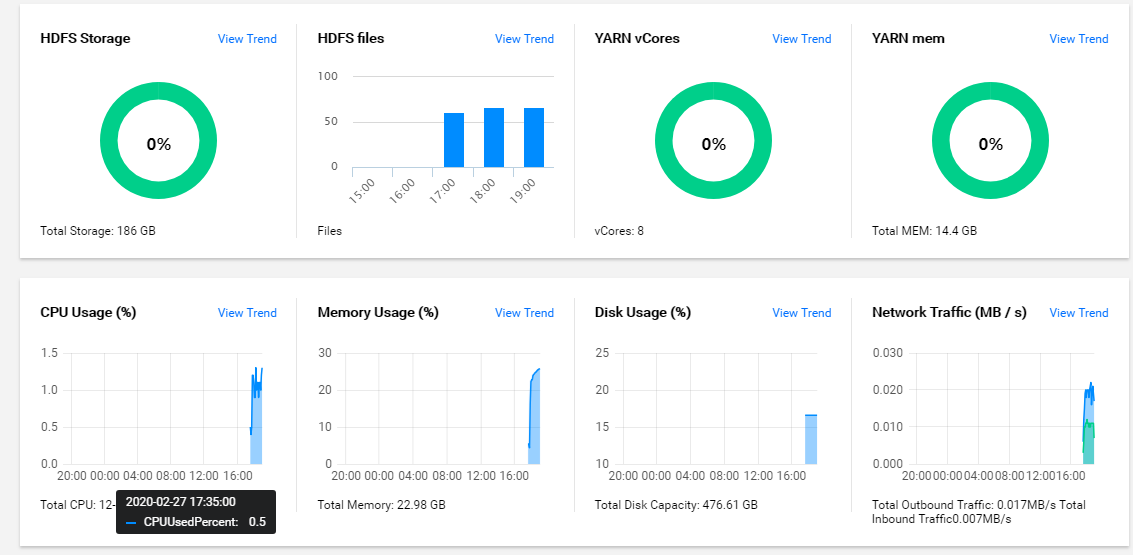
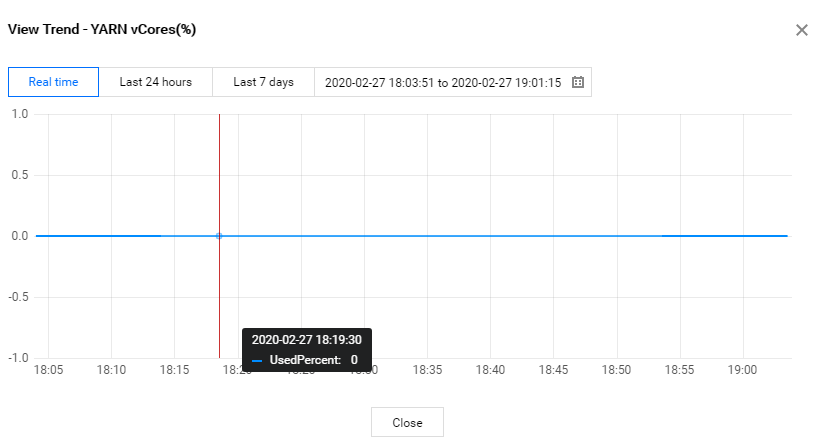
Key cluster metrics: This view displays the total utilization of HDFS, YARN, CPU, memory, and disk as well as total network traffic of the current cluster. You can click View Trend in the top-right corner of each metric and select a target time period to view the corresponding usage trend.


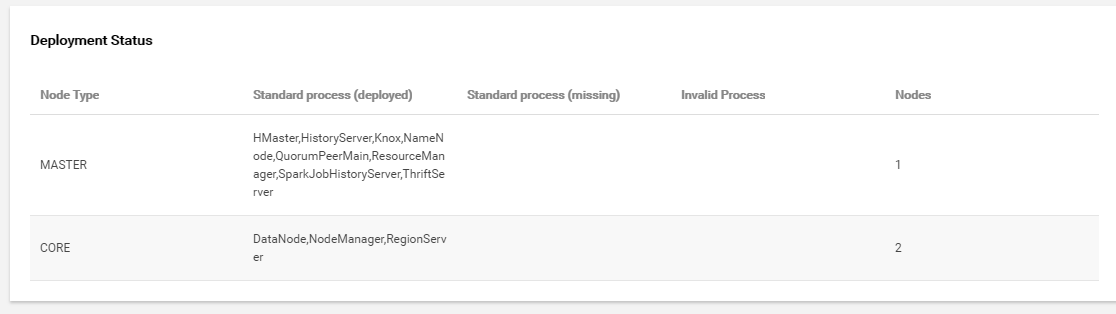
Cluster deployment status: This view displays abnormal, missing, and invalid processes deployed on nodes and the number of nodes in the current cluster, so that you can correct the configuration accordingly.

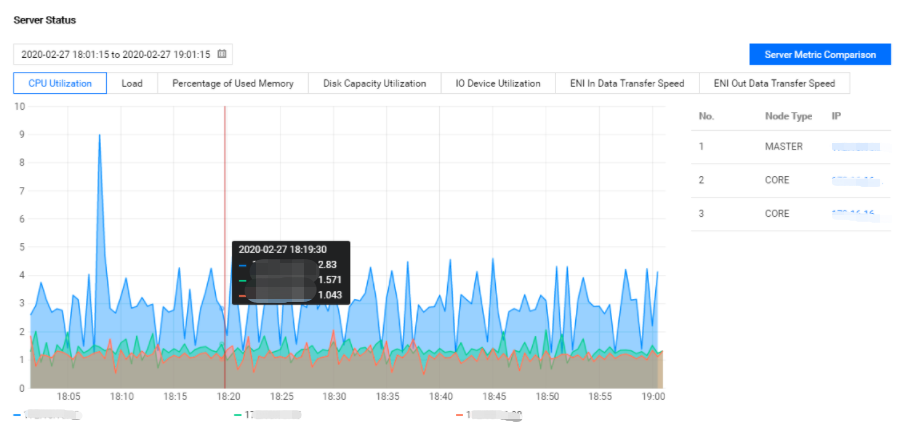
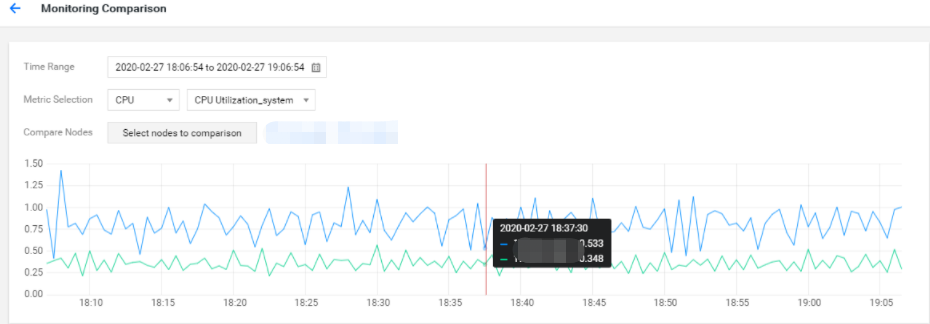
Top 10 nodes: This view displays the trend of node loads in the current cluster under core metrics. You can select multiple nodes to compare their load trends under the same metric.


ヘルプとサポート

この記事はお役に立ちましたか?

フィードバック