快速入门
Download
聚焦模式
字号
功能介绍
本文介绍如何使用 PTS 脚本模式,通过 JavaScript 脚本快速发起压测,帮您掌握 PTS 的基本用法。
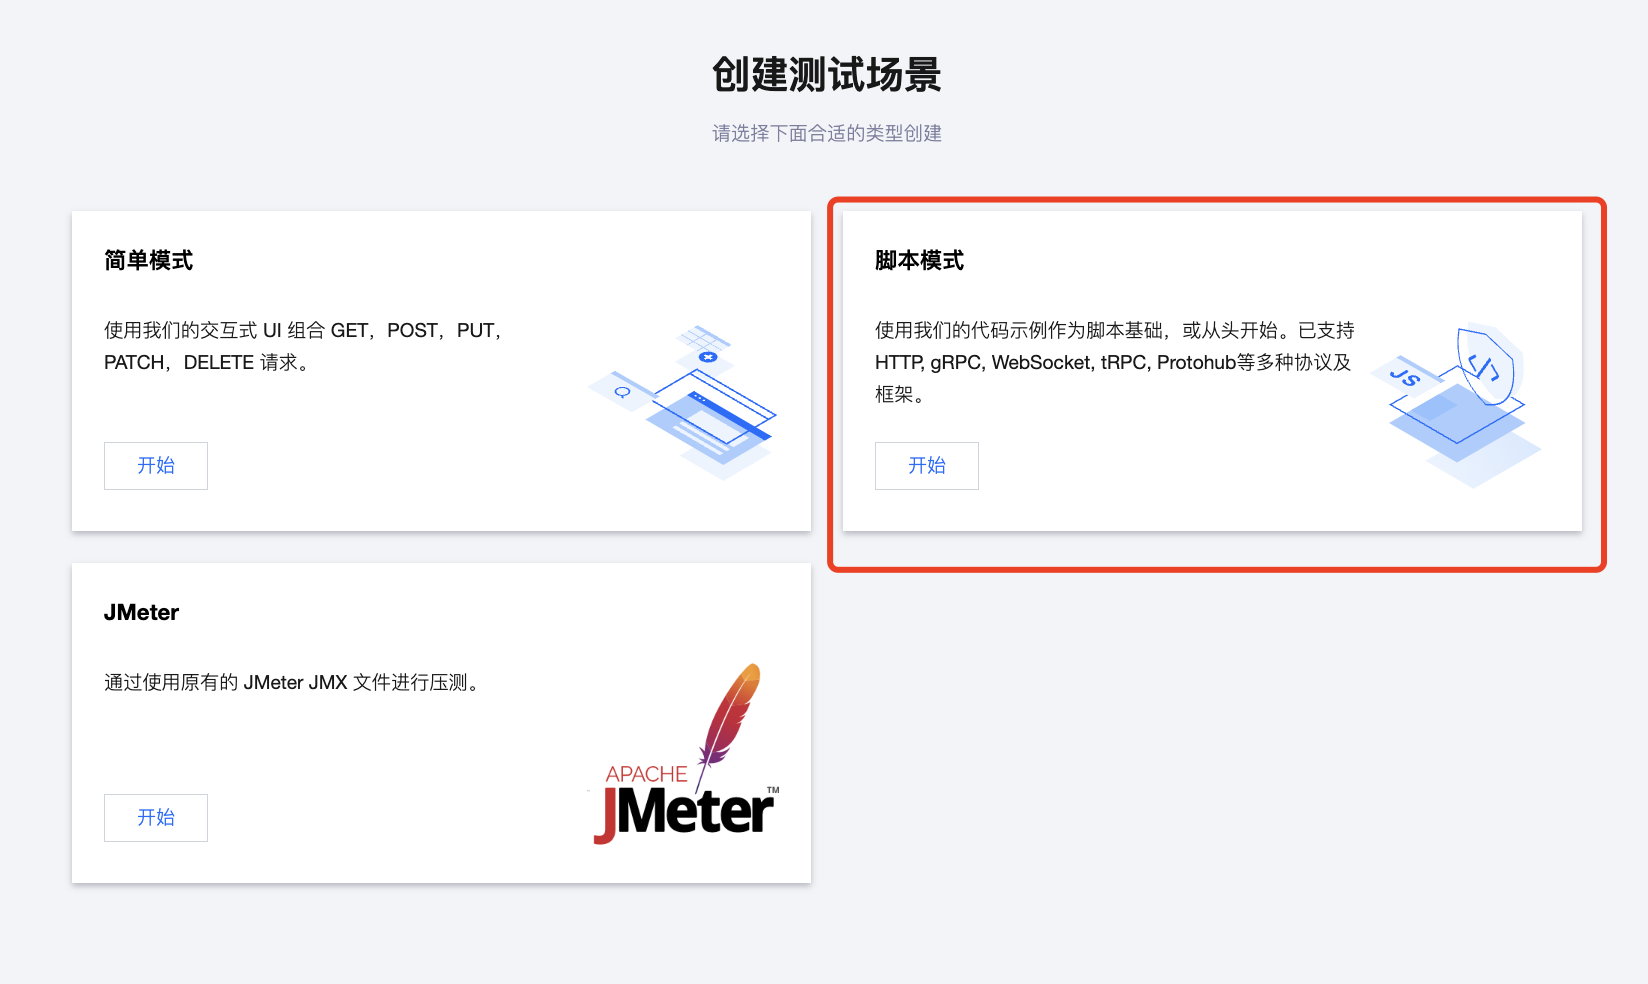
压测场景 | 描述 |
脚本模式 | 使用我们的 JS 代码示例作为脚本的基础,或从头开始。支持 HTTP、Websocket、gRPC 等协议。 |
简单模式 | 使用我们的交互式 UI ,组合不同的用户请求。 |
JMeter | 通过使用原生的 JMeter JMX 文件进行压测。 |
脚本导入 | HAR 等 API 导入自动生成测试场景。 |
流量录制 | 录制浏览器流量,自动生成测试场景。 |
操作步骤
步骤1: 创建 PTS 项目
1. 登录 腾讯云可观测平台。
2. 在左侧菜单栏中单击云压测 > 项目列表。
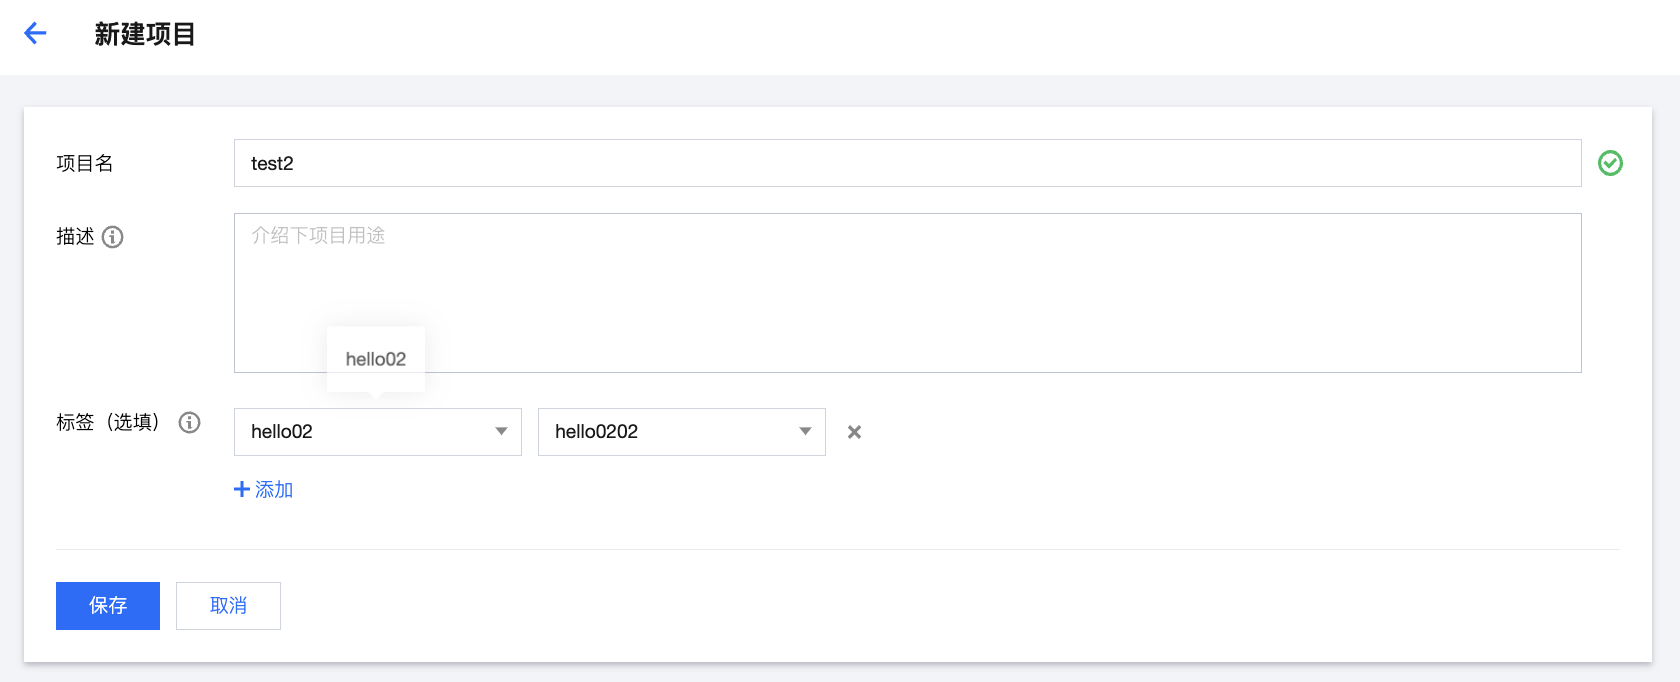
3. 在项目列表页单击新建项目。
4. 填写项目名、描述和标签。完成后单击保存。
步骤2:创建测试场景
1. 进入创建测试场景页,选择脚本模式。
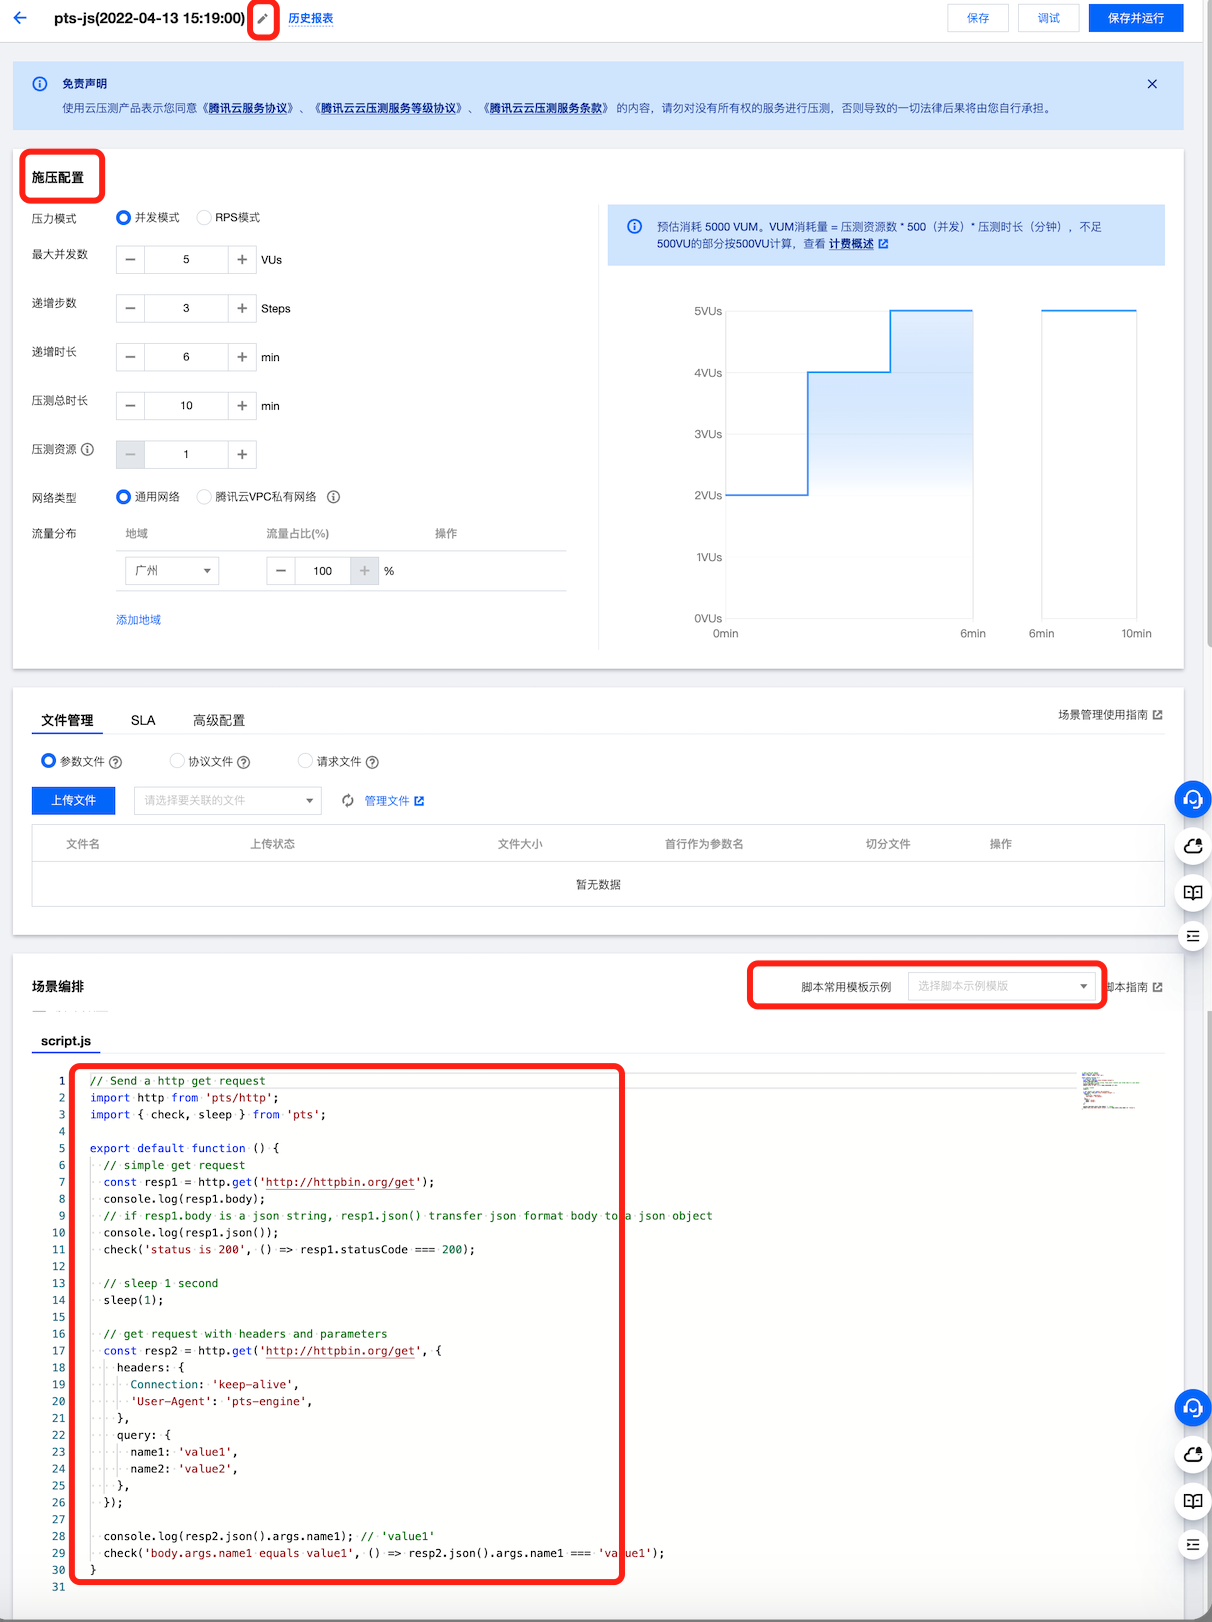
2. 编排测试场景,完成以下设置,然后单击保存并运行。新创建的测试场景默认可直接运行。
功能模块说明如下表所示:
功能模块 | 描述 |
场景名字 | 更新场景名字,方便后续识别场景用途。 |
施压配置 | 当前支持压力模型为:并发压力模式(虚拟用户模式)、RPS 压力模式。 并发压力模式(虚拟用户模式):并发指虚拟并发用户数。从业务角度,也可以理解为同时在线的用户数。 RPS 压力模式:每秒请求数量,用于衡量服务端的吞吐量。免去并发数到 RPS 的繁琐转换,来帮忙用户更好的摸底业务性能瓶颈。 并发模式配置内容 最大并发数:可以理解为被压服务同时在线的用户数。 递增步数:并发压力递增的阶段数量。 递增时长:压力递增持续时间。 压测总时长:压测持续时间。 压测资源: 单压测资源默认提供 500 并发,以及对应的底层资源; 若 CPU、内存或出入带宽达到上限,可适当增加压测资源,提高分配给任务的 CPU、内存和出入带宽; 压测资源数增加会带来计费的增加,计费并发 = 压测资源数 * 500。 网络类型:通用网络支持公网访问。 流量分布:选择不同地域施压流量占比。 RPS 模式配置内容 最大 RPS:压测 RPS 上限,用来摸底业务系统的目标吞吐量。PTS 会根据最大 RPS 为压测任务分配合理的施压资源。 起始 RPS:压测起始 RPS,用户可以在压测过程中手工调整发压 RPS,并观察报表指标变化。 压测总时长:一次压测的总时长。 压测资源:PTS 会根据用户设置的最大 RPS,合理分配压测资源池。如果您的请求响应较慢,您可以通过适当扩大压测资源池,来确保达到目标吞吐量。 流量分布:将压测总流量以一定的百分比,分布于多个地域,以模拟真实场景中,来自不同地域的用户带来的流量。 |
场景编排 | 提供脚本常用模板示例。 支持语法高亮、智能提示、函数引用、代码格式化等。 JS 编排区域内右键查看更多功能。更多常用的 JS 语法,代码示例请参见 脚本模式压测。 |
步骤3:查看压测报告
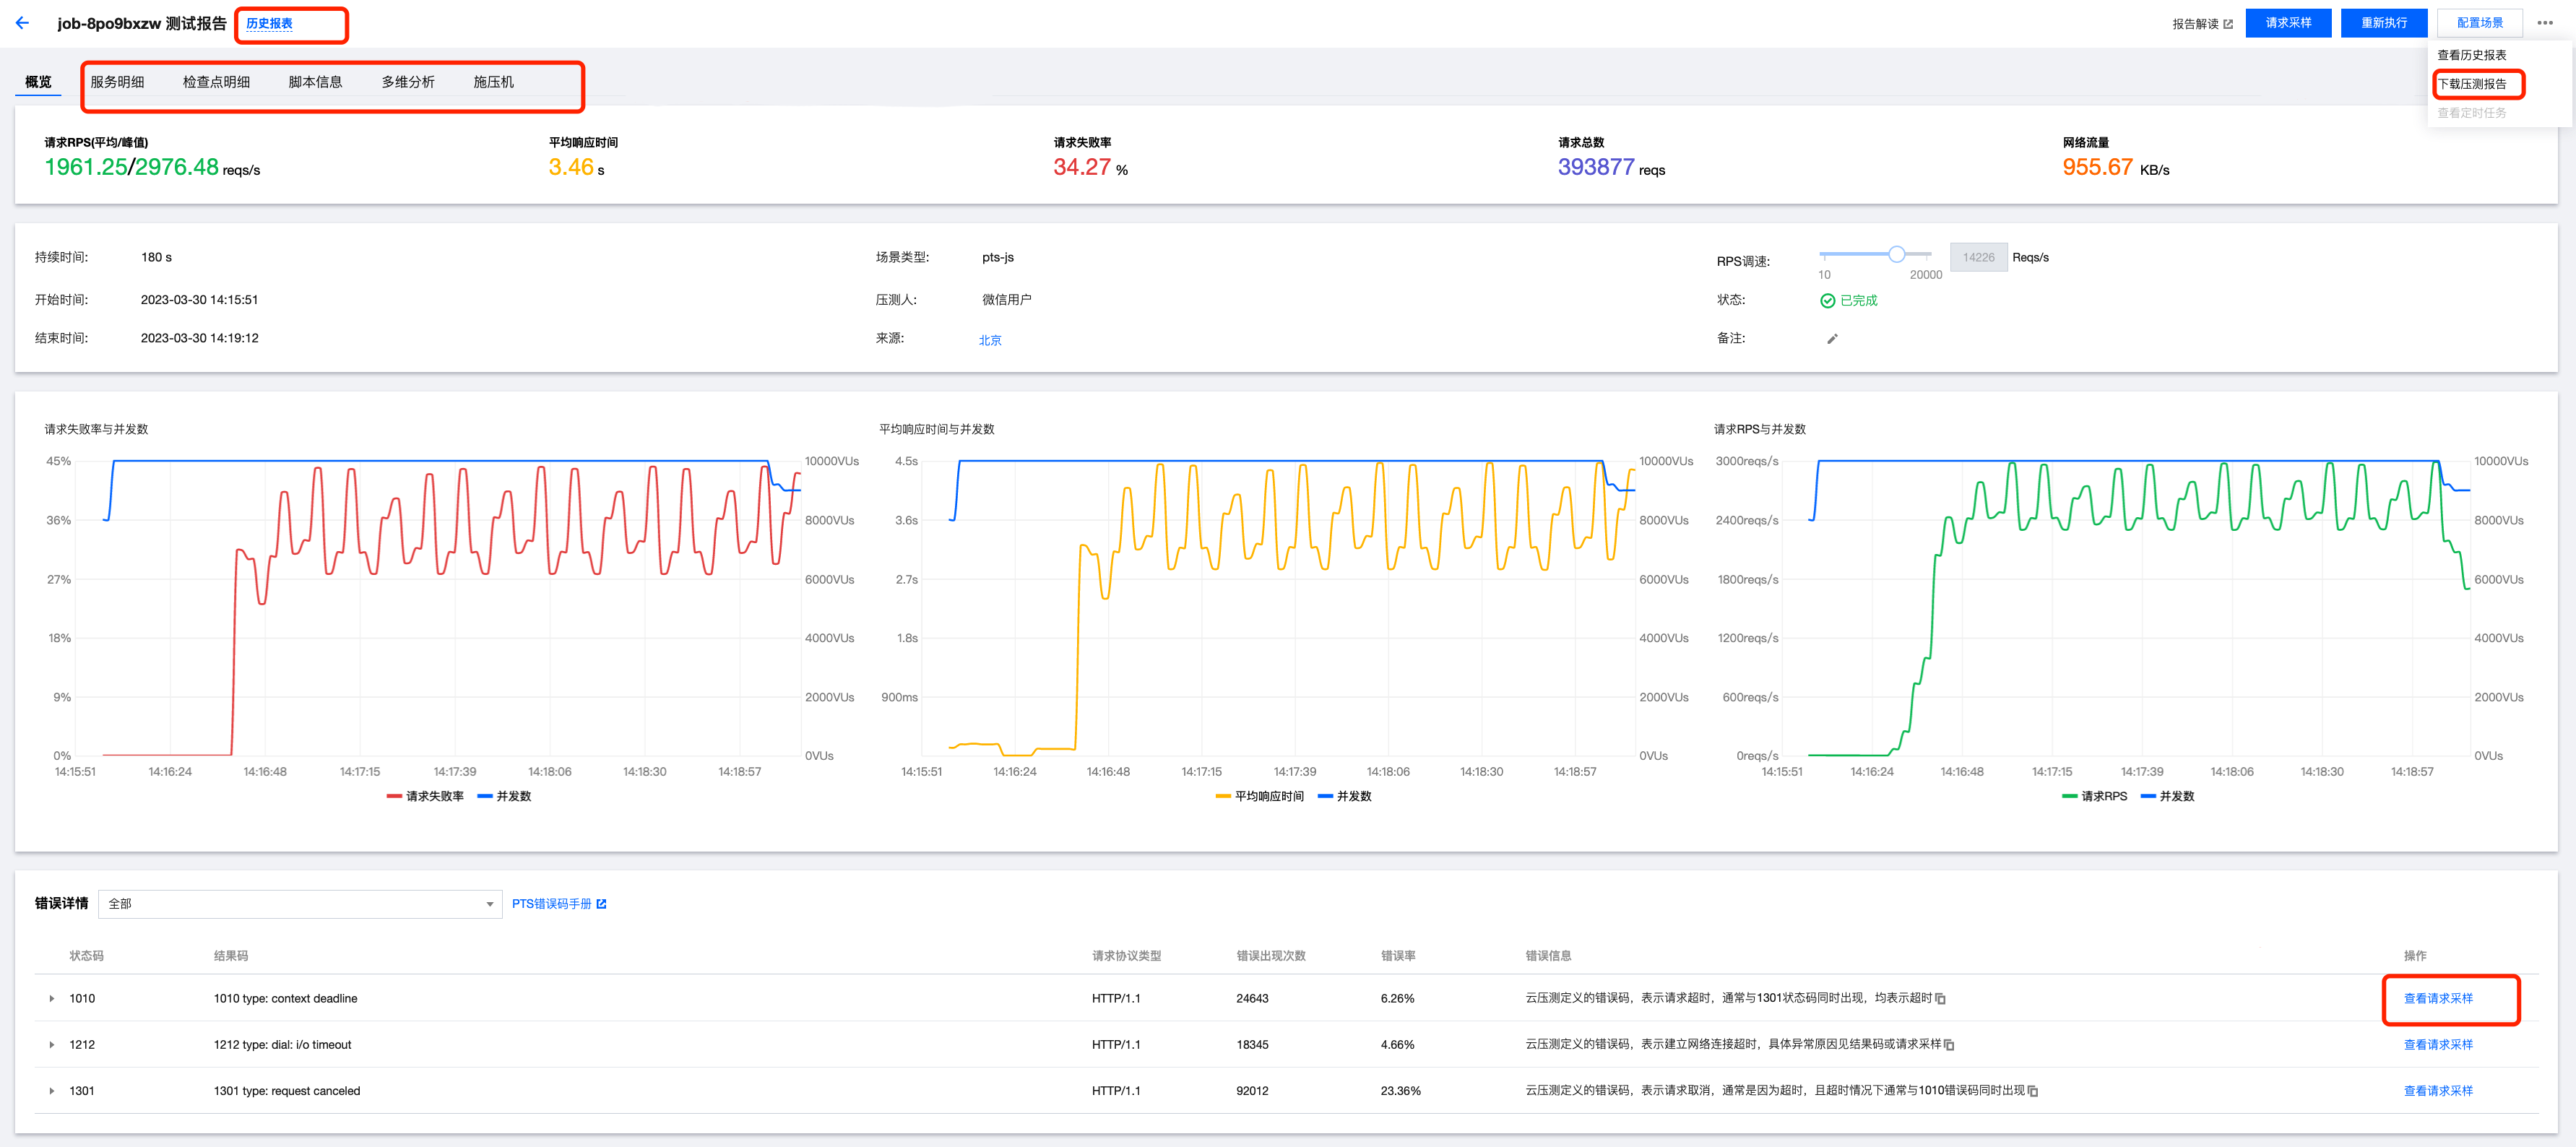
单击保存并运行后,PTS 将拉起压测引擎进行测试。控制台将跳转至施压报告界面。
压测报告生成后,您可以单击导航栏测试场景名称,可查看、下载历史报表。在错误详情列表,您还可单击查看请求采样,查看错误请求采样信息。
文档反馈