The data management feature provides many monitoring metrics for indices in an ES cluster to monitor index conditions, such as storage, write, and query. Based on these metrics, you can understand the index usage in real time and promptly handle possible risks to ensure stable index operations. This document describes how to view monitoring data through data management.
2. Select the target cluster in Data Management. Then, click an Index name in the index list to enter the Basic Information page of the index.
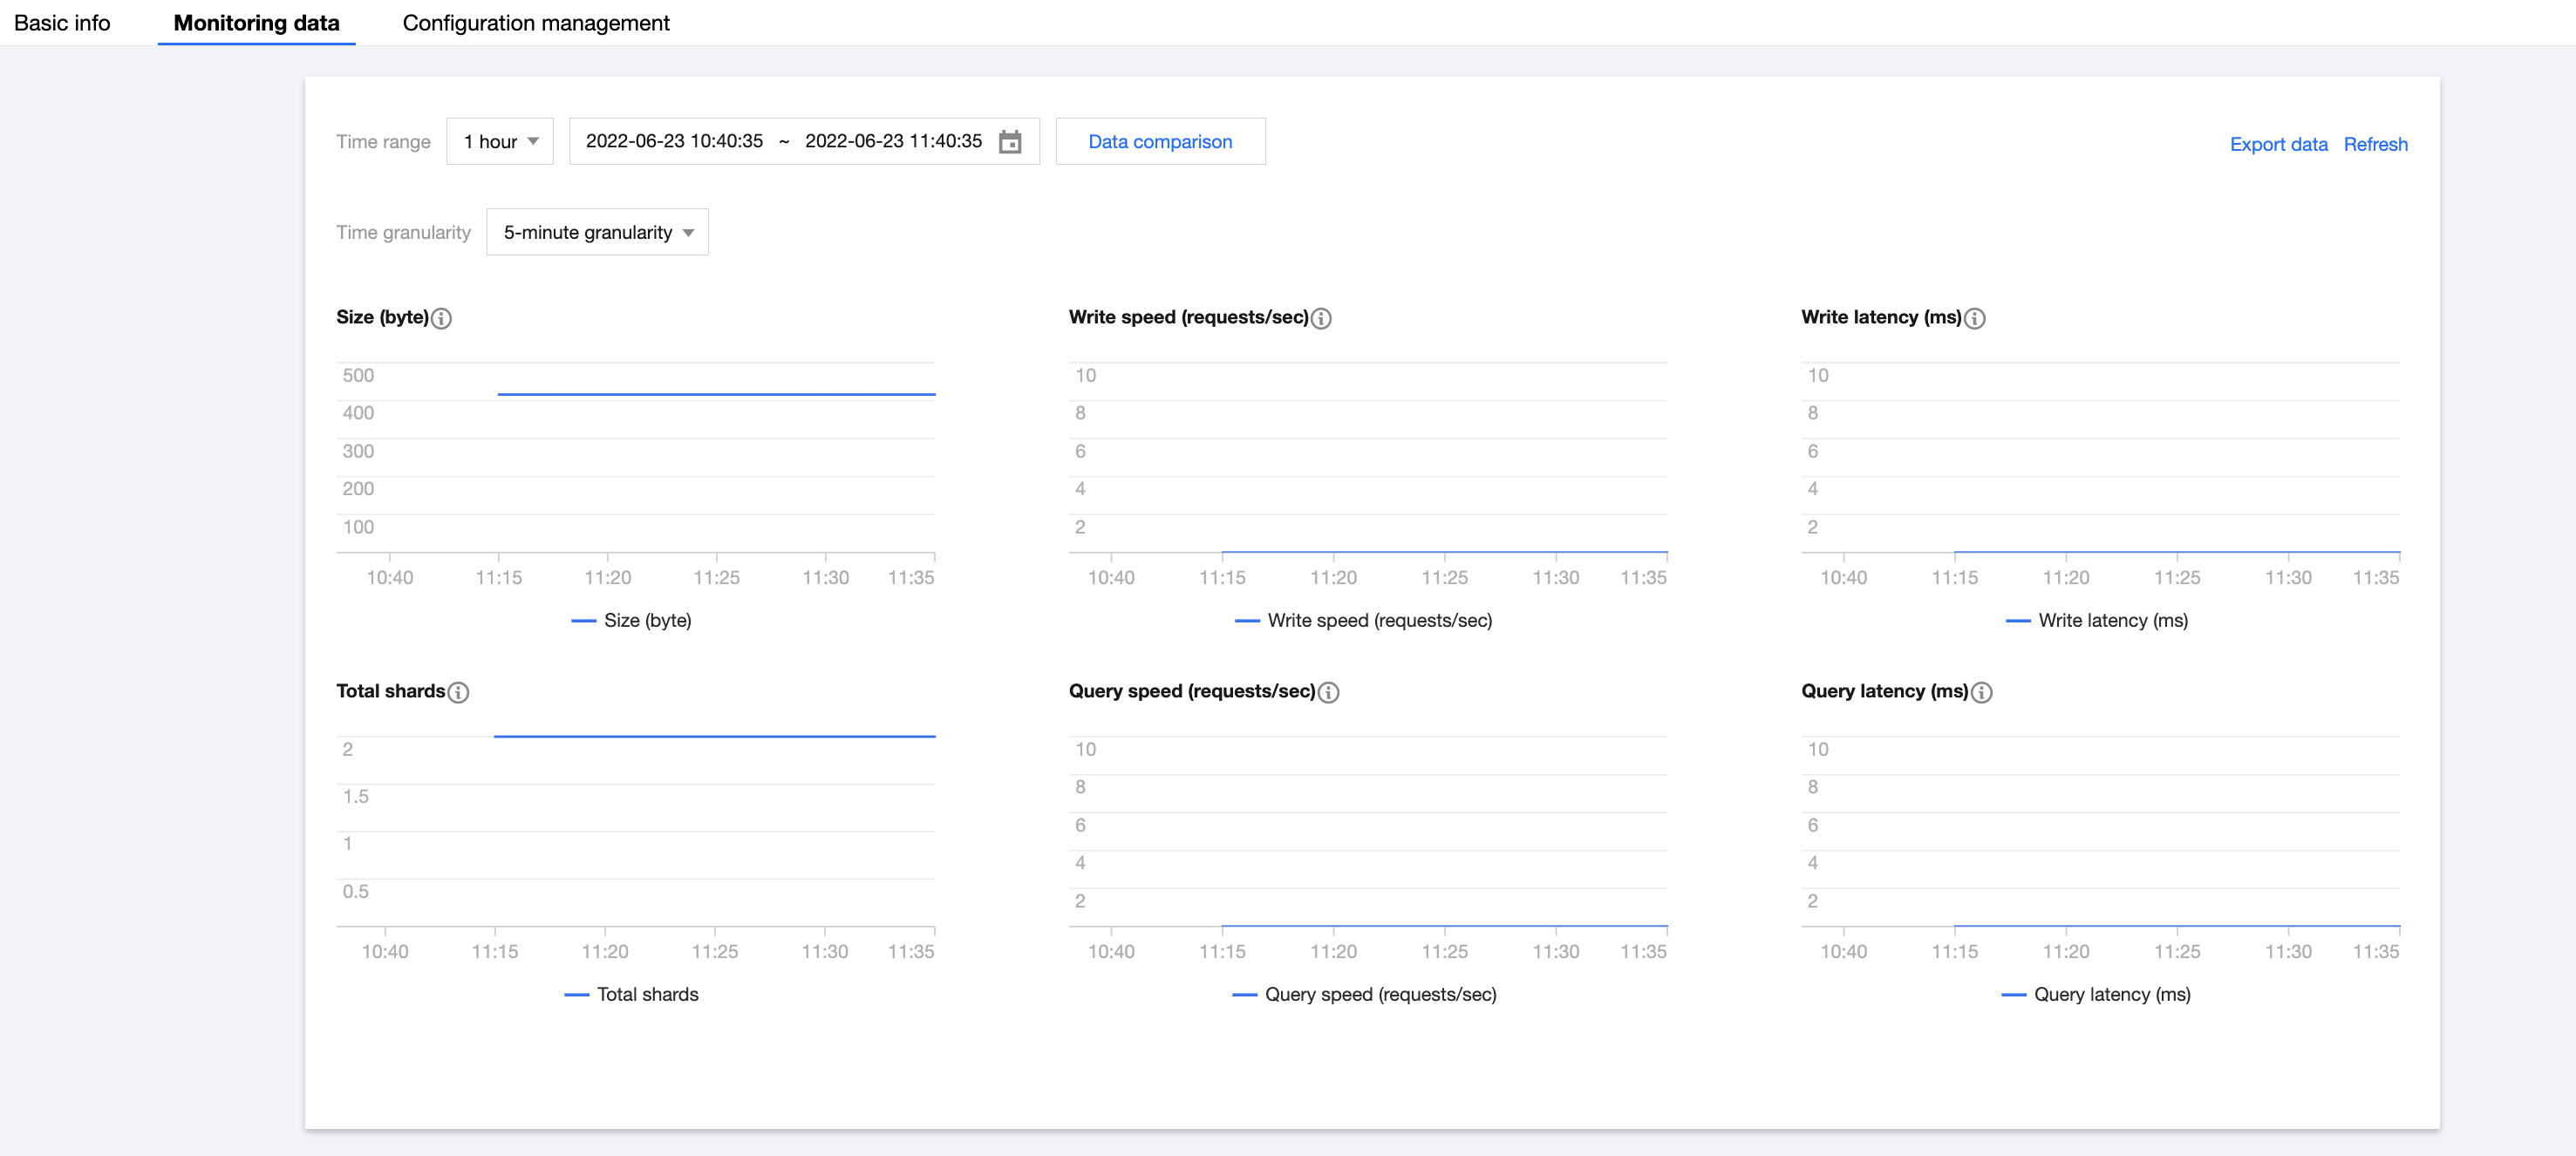
3. Select the Monitoring Data page to view the overall index usage.
Monitoring data
Monitoring metrics cover six dimensions: size, total shards, write speed, write latency, query speed, and query latency.
Descriptions of metrics
The statistical period of each metric is five minutes; that is, the cluster's metrics are collected once every five minutes. The metrics are as described below:
Monitoring Metric
Statistical Method
Details
Size
The average index size during a statistical period.
This value is the total size of a single index or all backing indices for an autonomous index. You can view the index storage capacity change based on this value.
Total Shards
The average number of shards in the index during a statistical period.
This value is the total number of all shards of a single index or all backing indices for an autonomous index, including primary and replica shards.
Write Speed
The average number of index requests received by indices or autonomous indices per second during a statistical period. Calculation rule for the number of index requests per second of an index: the total number of historical index requests of all index shards (_cat/shard?h=indexing.index_total) is recorded once every statistical period (five minutes), and the difference between two adjacent records (i.e., the absolute value in one statistical period) is taken for calculation (number of index requests / 300 seconds) to get the average number of index requests per second in one statistical period.
-
Query Speed
The average number of search (query) requests received by indices or autonomous indices per second during a statistical period. Calculation rule for the number of search requests per second of an index: the total number of historical search requests of all index shards (_cat/shard?h=search.query_total) is recorded once every statistical period (five minutes), and the difference between two adjacent records (i.e., the absolute value in one statistical period) is taken for calculation (number of search requests / 300 seconds) to get the average number of search requests per second in one statistical period.
-
Write Latency
Write latency (index_latency) refers to the average time taken by a single index request (ms/request). Calculation rule for the average index request time: two metrics are recorded once every statistical period (five minutes), i.e., total time taken by historical index requests of all index shards (_cat/shard?h=indexing.index_time) and total number of historical index requests of all index shards (_cat/shard?h=indexing.index_total), and the difference between two adjacent records (i.e., the absolute value in one statistical period) is taken for calculation (index request time / number of index requests) to get the average index request time in one statistical period.
Write latency is the average time it takes to write a single document. If the write latency is too high, we recommend you increase the number of index shards or nodes or upgrade the cluster node specification.
Query Latency
Query latency (search_latency) refers to the average time taken by a single search request (ms/request). Calculation rule for the average search request time: two metrics are recorded once every statistical period (five minutes), i.e., total time taken by historical search requests of all index shards (_cat/shard?h=search.query_time) and total number of historical search requests of all index shards (_cat/shard?h=search.query_total), and the difference between two adjacent records (i.e., the absolute value in one statistical period) is taken for calculation (search request time / number of search requests) to get the average search request time in one statistical period.
Query latency is the average time it takes to perform a single query. If the query latency is too high, we recommend you perform query optimization based on query profile, upgrade the cluster node specification, or increase the number of nodes.