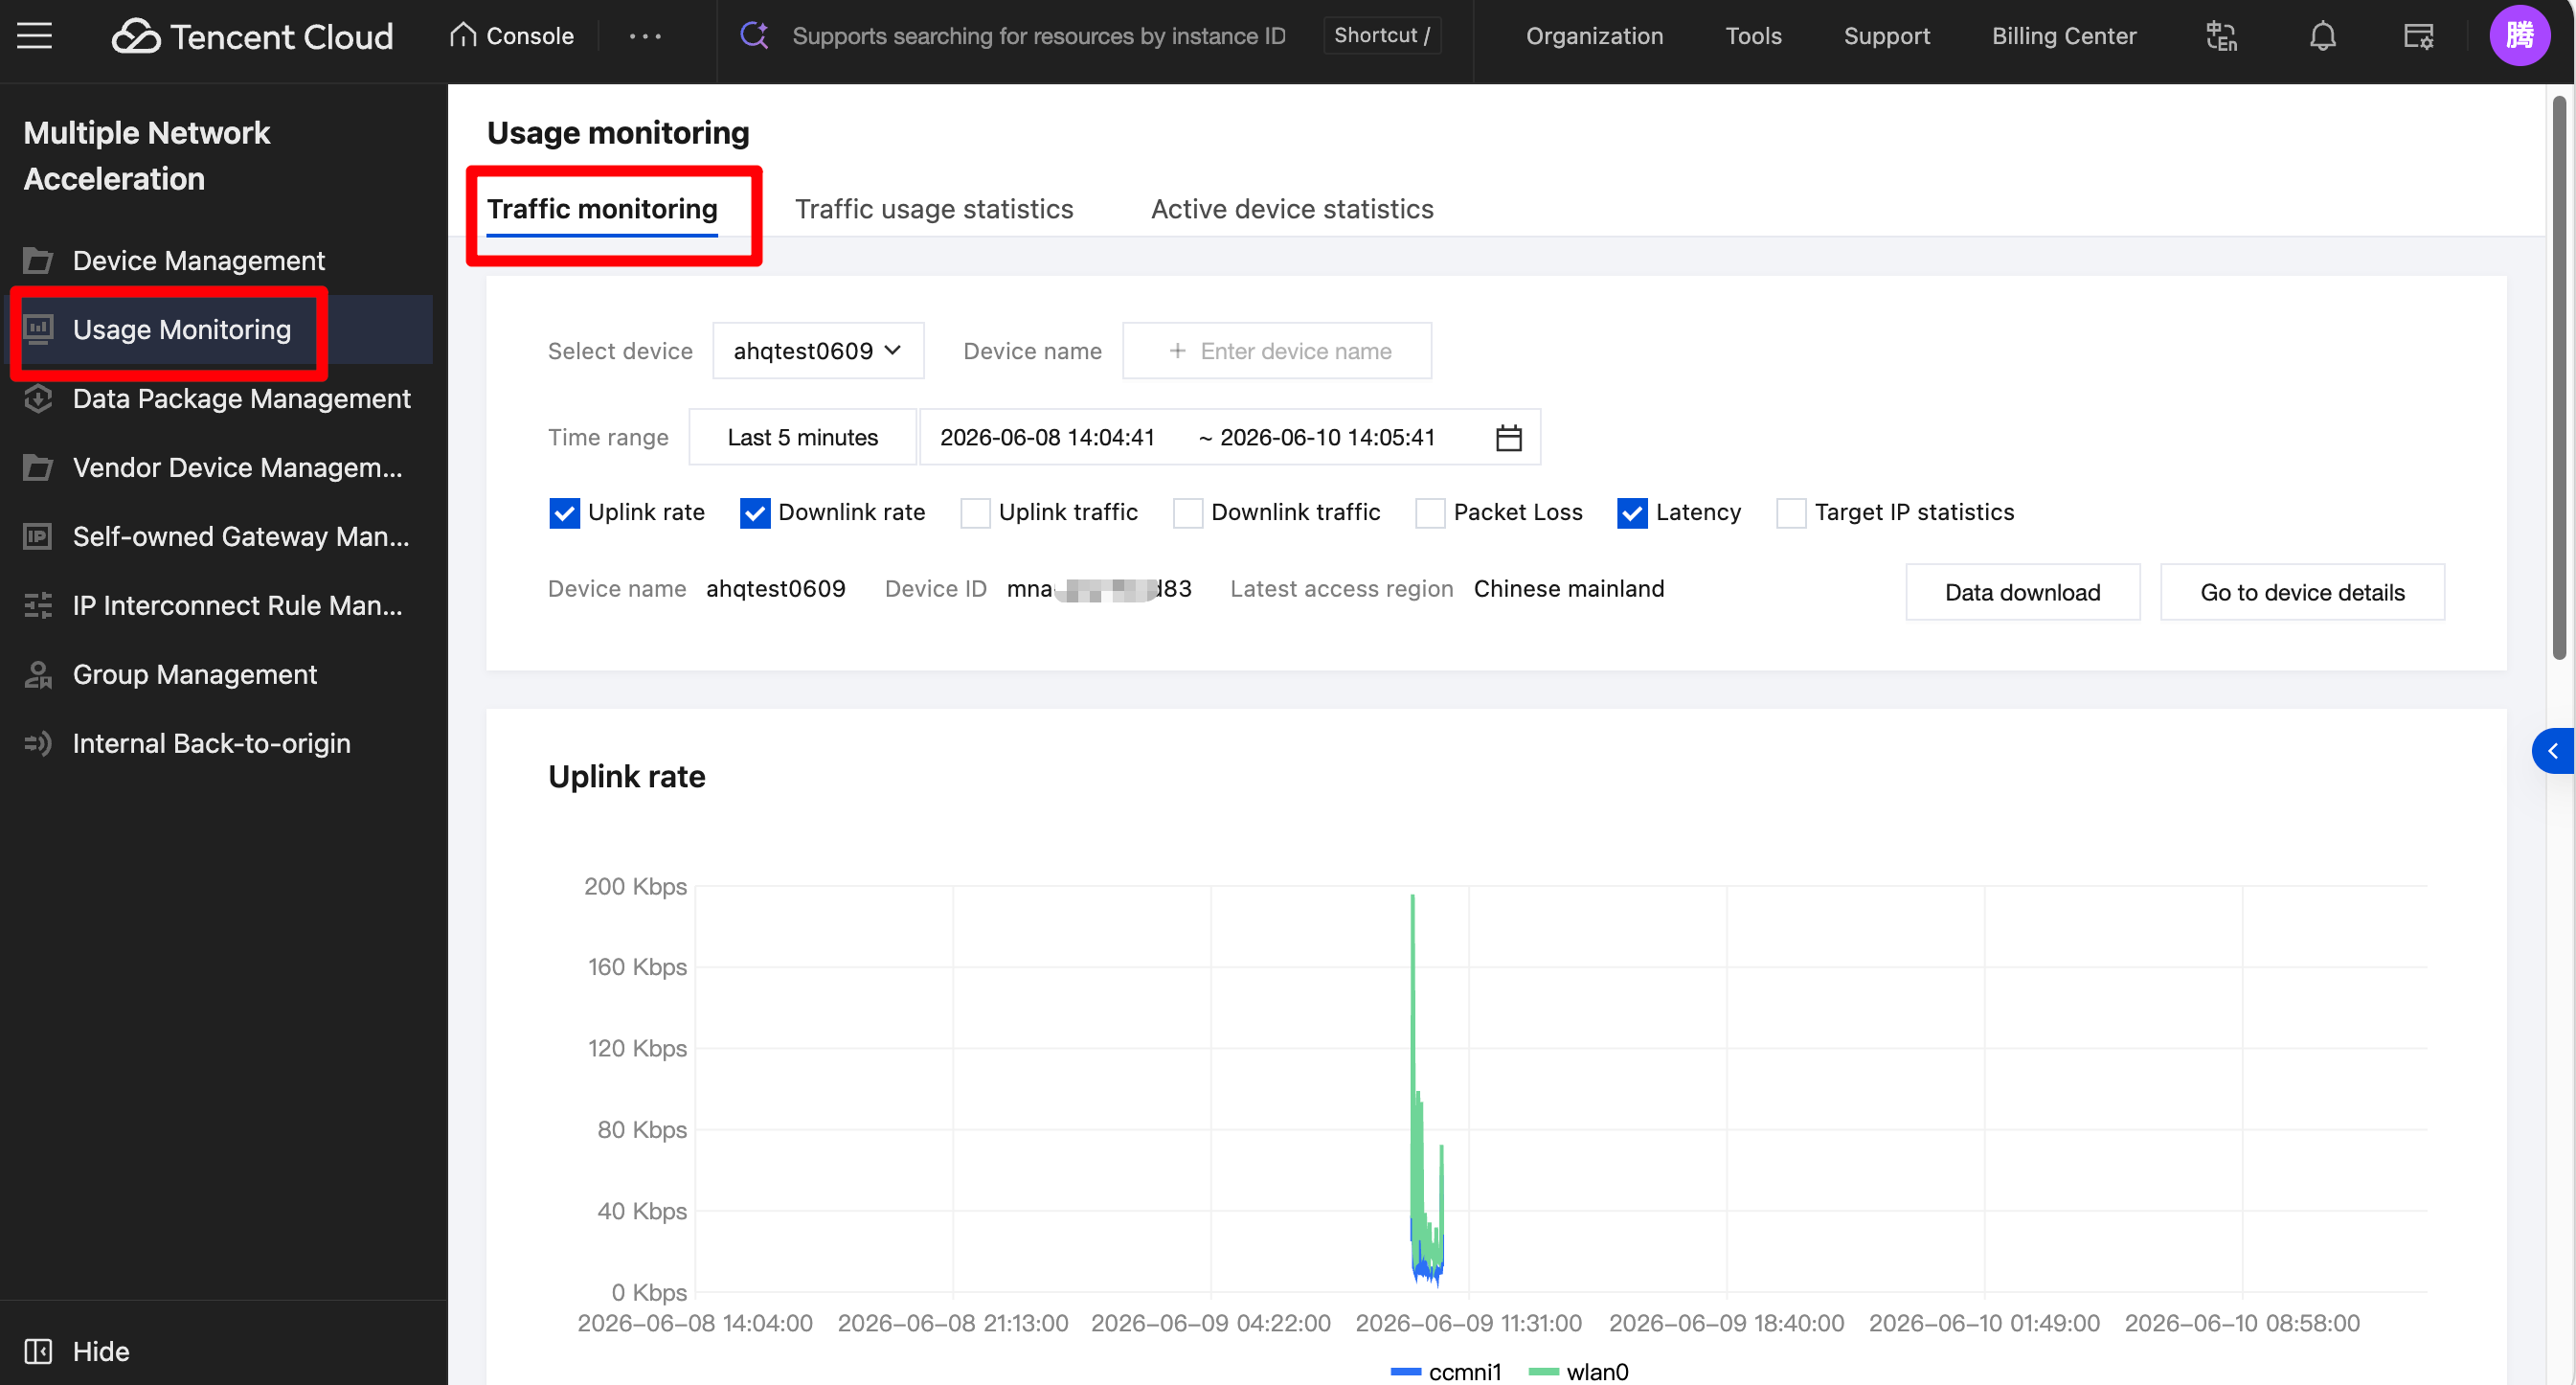
Go to the Console. On the Usage monitoring page, select Traffic Monitoring. You can then select the device you want to view by device. Choose an appropriate time and time granularity as needed to view the traffic monitoring for the corresponding device. For traffic monitoring parameters, you can select uplink rate, downlink rate, uplink traffic, downlink traffic, packet loss, latency, and target IP statistics. Click Data download to view and download the detailed data.
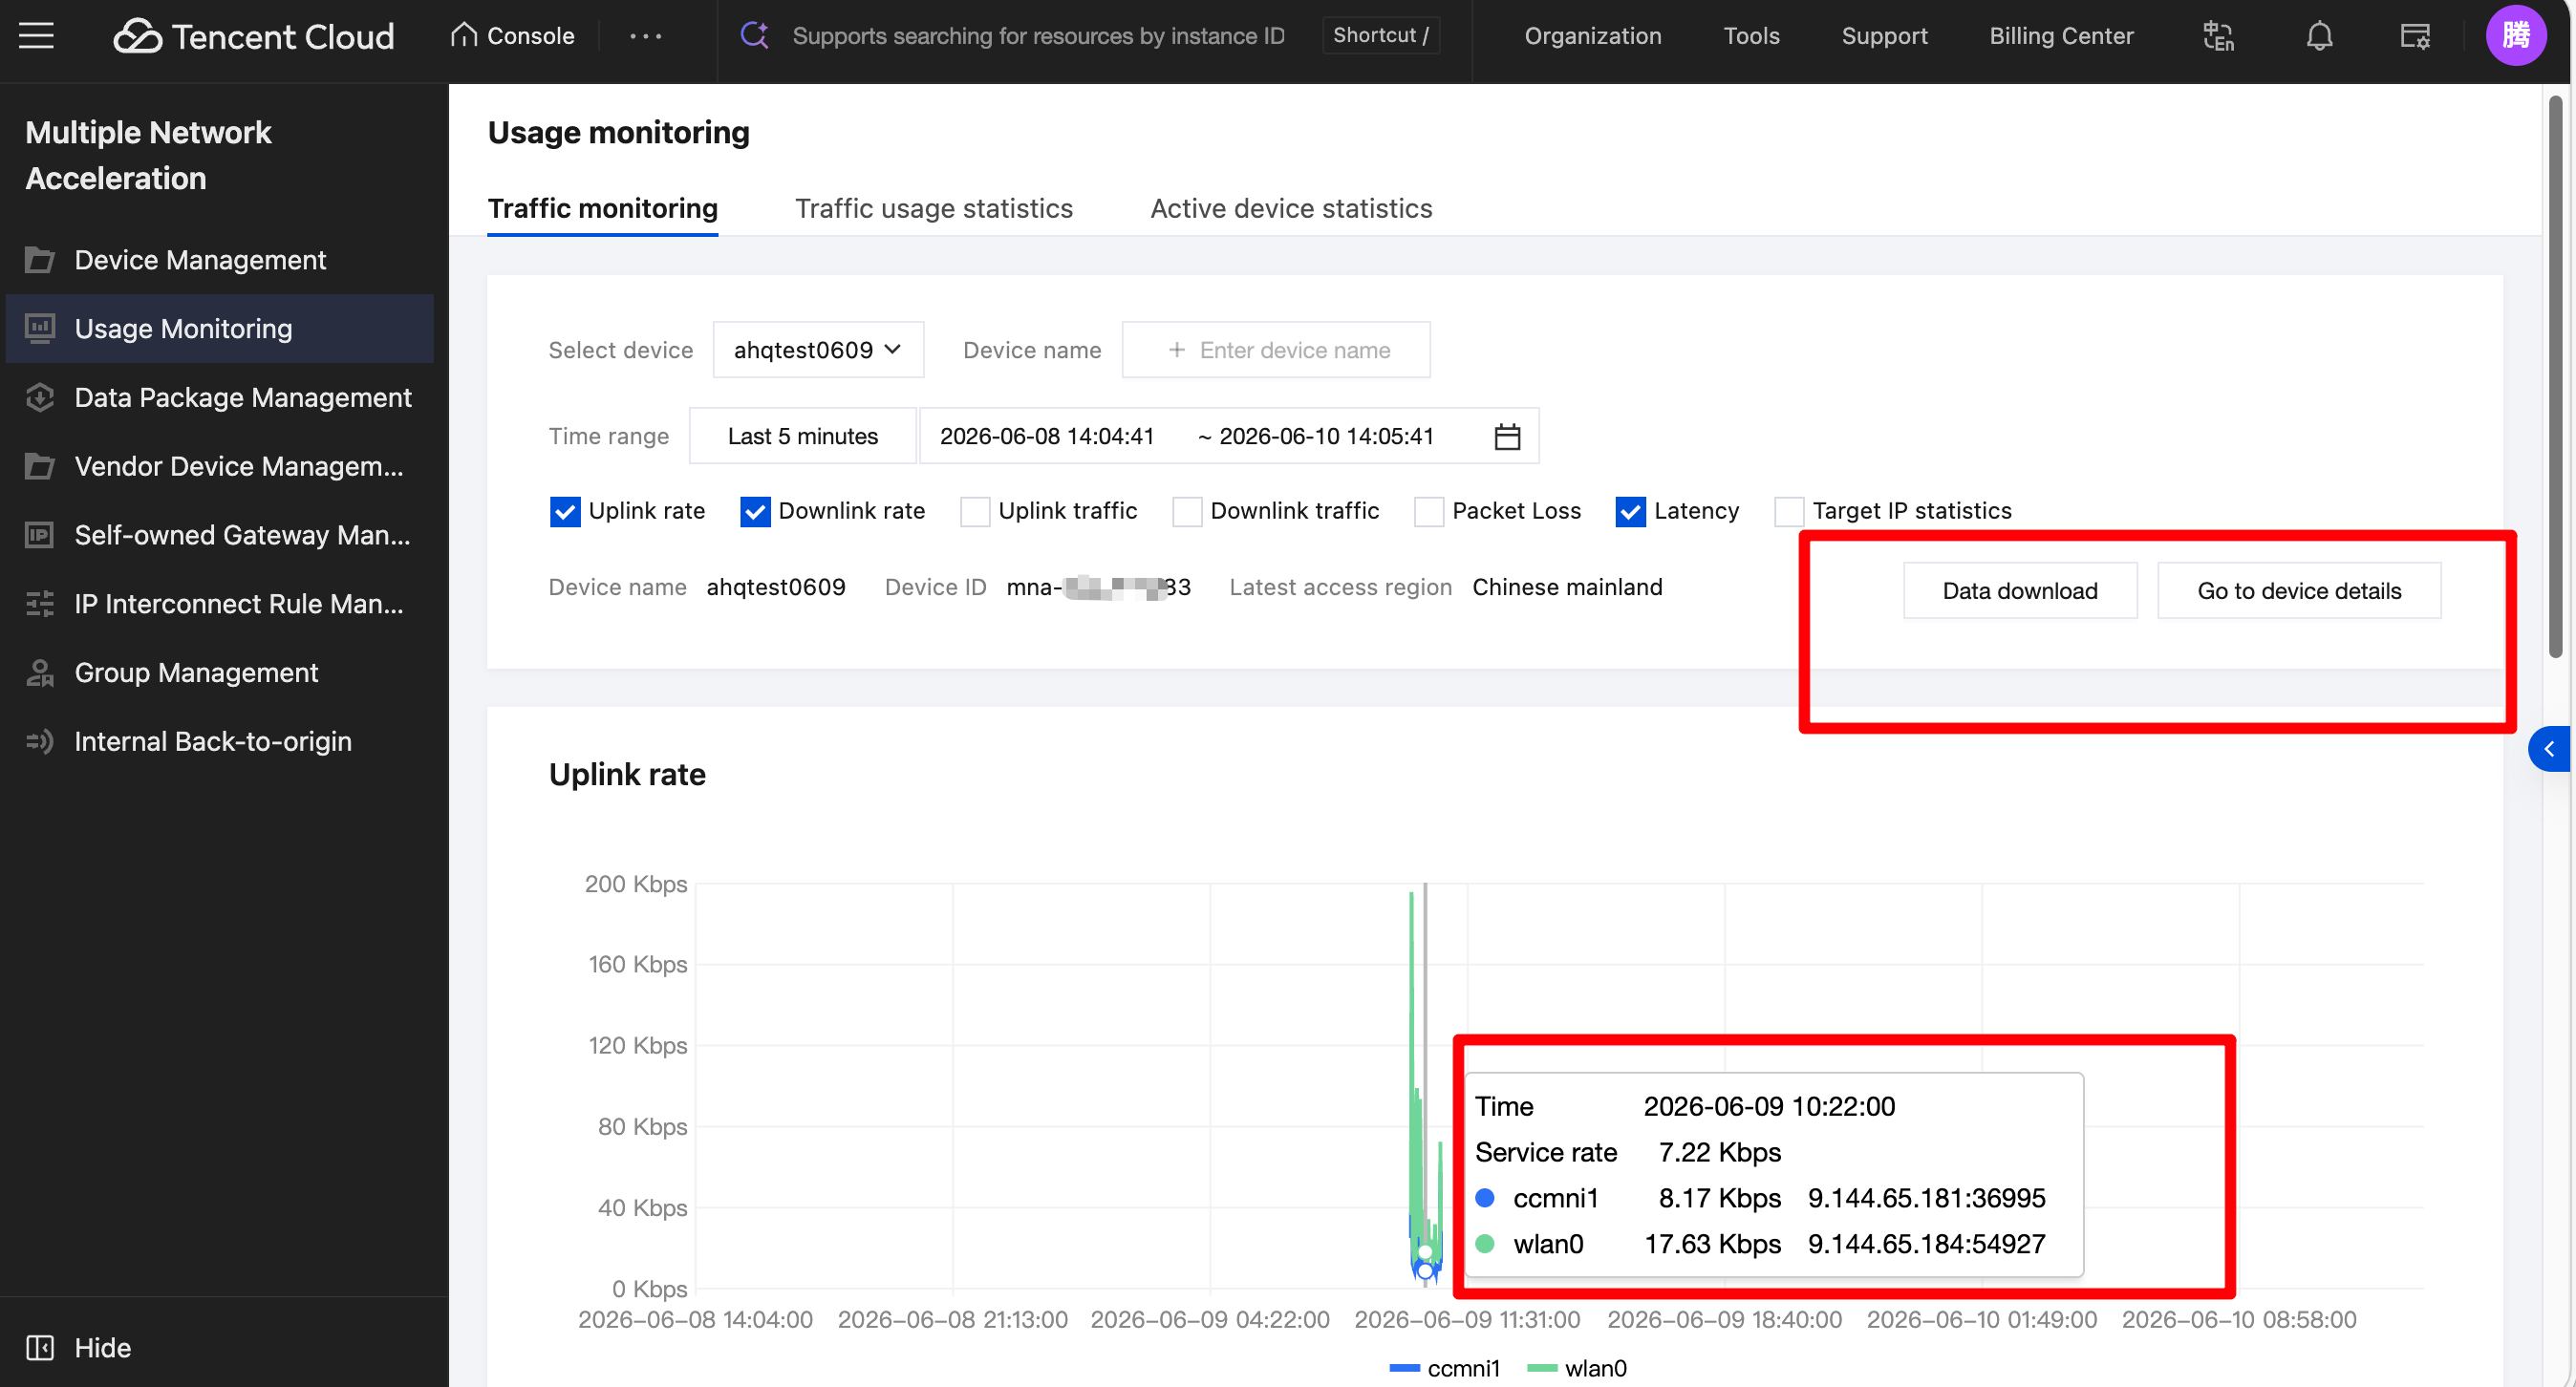
Hover the mouse over a specific point on the line chart to display the detailed data for that time point, as shown in the following figure.
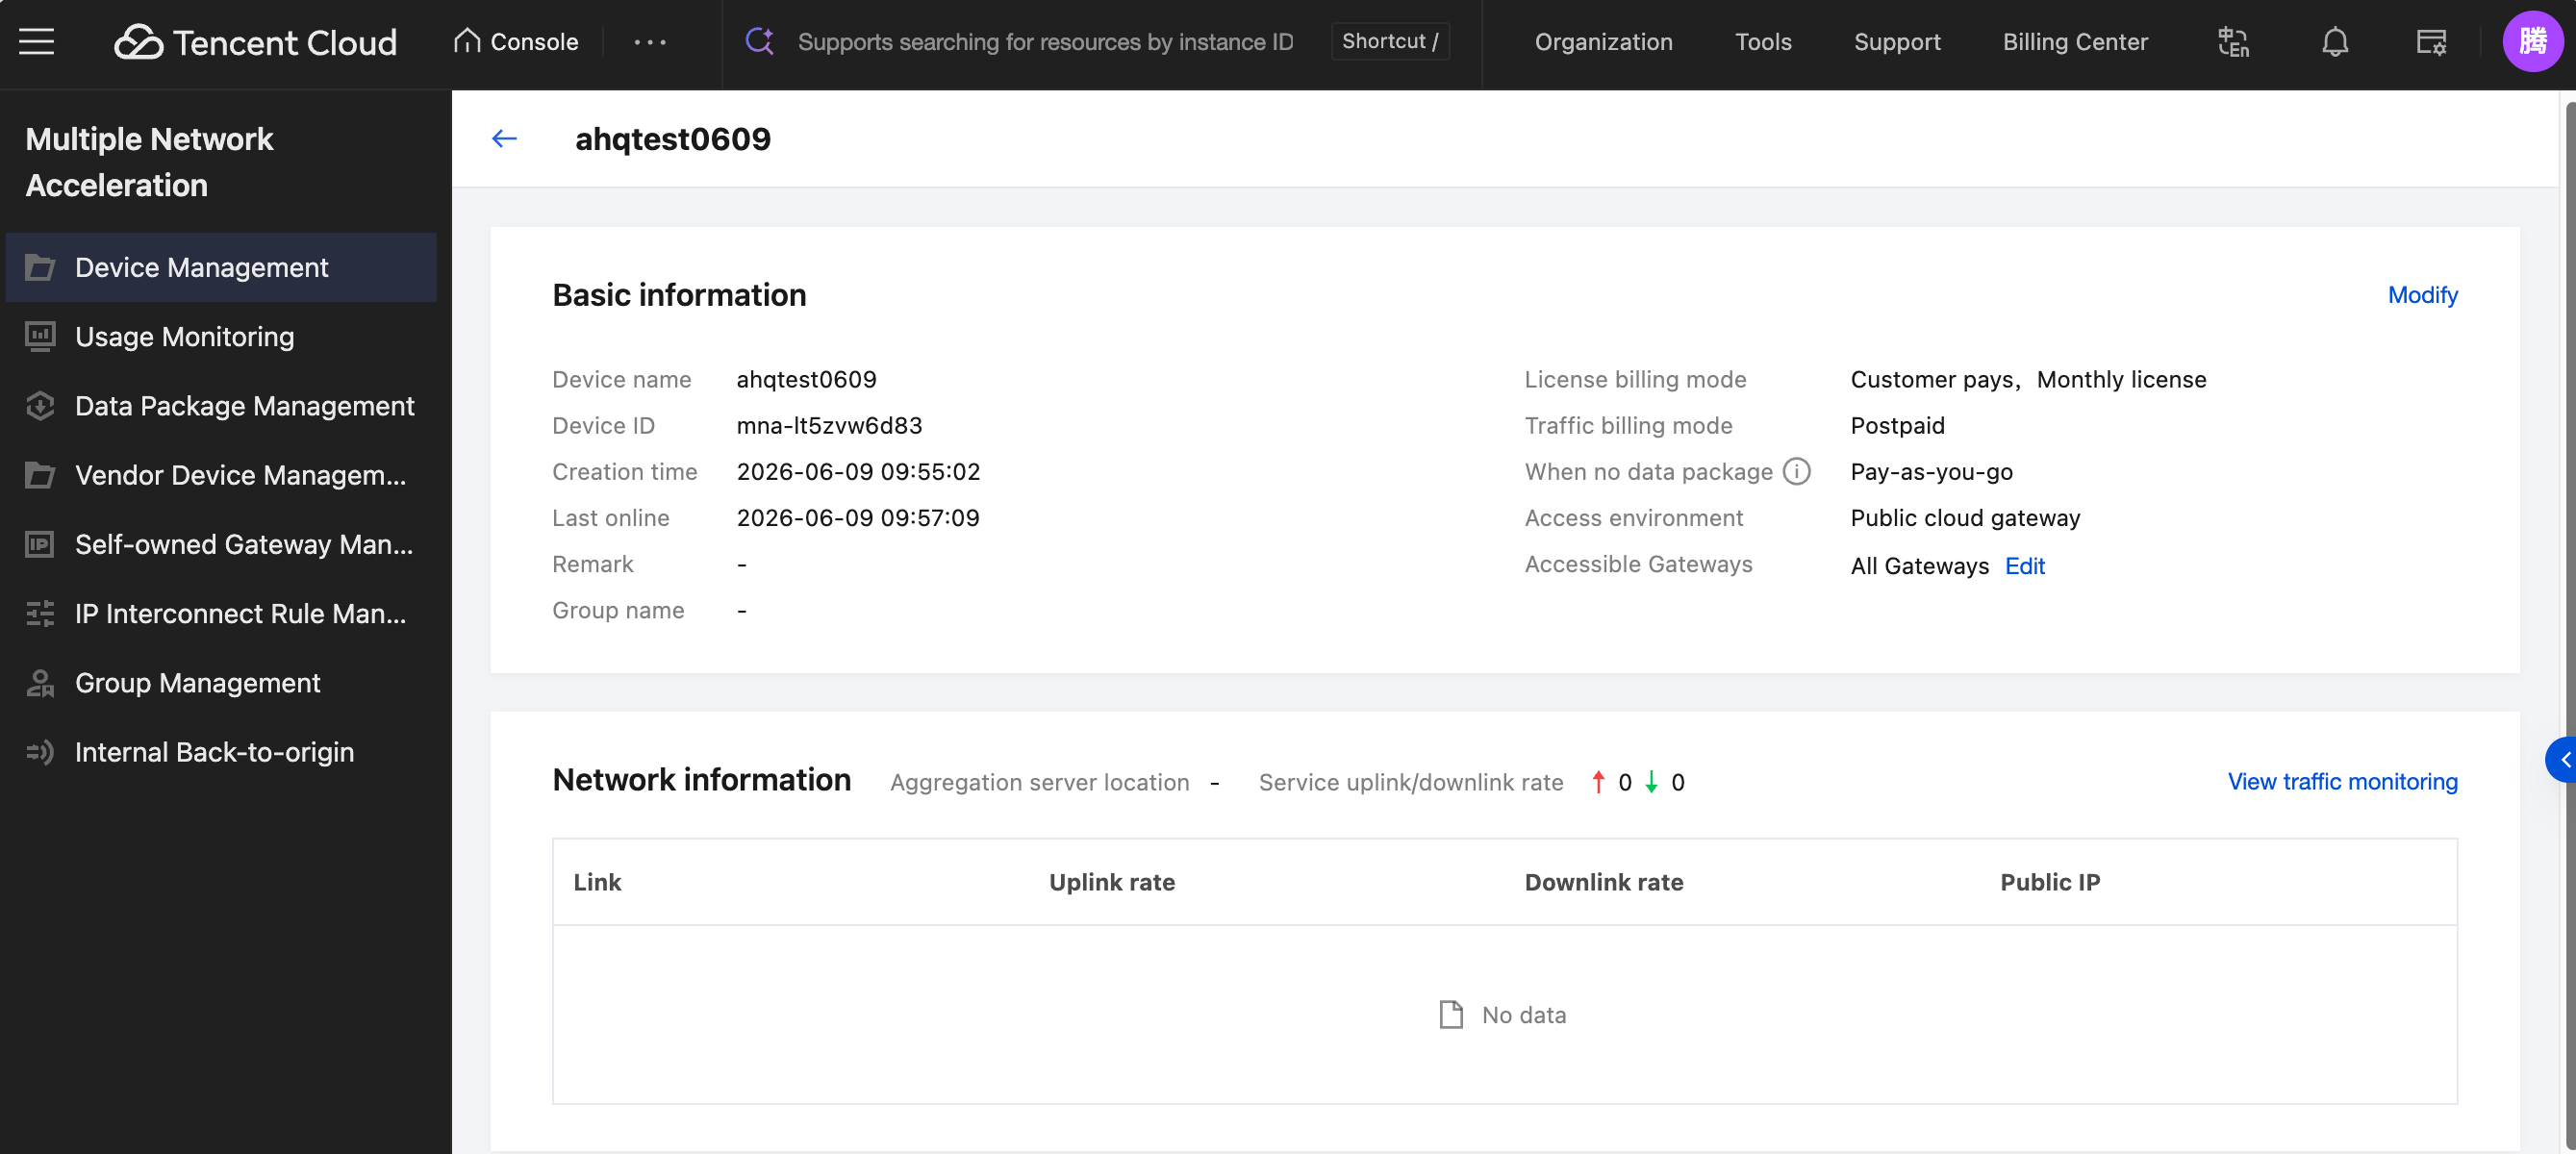
Click Go to device details to directly navigate to the corresponding device's Device management page, as shown in the following figure.