Viewing Monitoring Data
Download
포커스 모드
폰트 크기
TDMQ for RocketMQ supports routine monitoring of resources under your account. You can view monitoring data of various TDMQ for RocketMQ resources in the console in real time to understand the health status of the cluster.
Viewing Monitoring Data
1. Log in to the TDMQ for RocketMQ console.
2. In the left sidebar, click Monitoring Dashboard, and select the region and cluster to view.
3. On the monitoring page, select the resource tab to view, set the time range, and view the monitoring data.
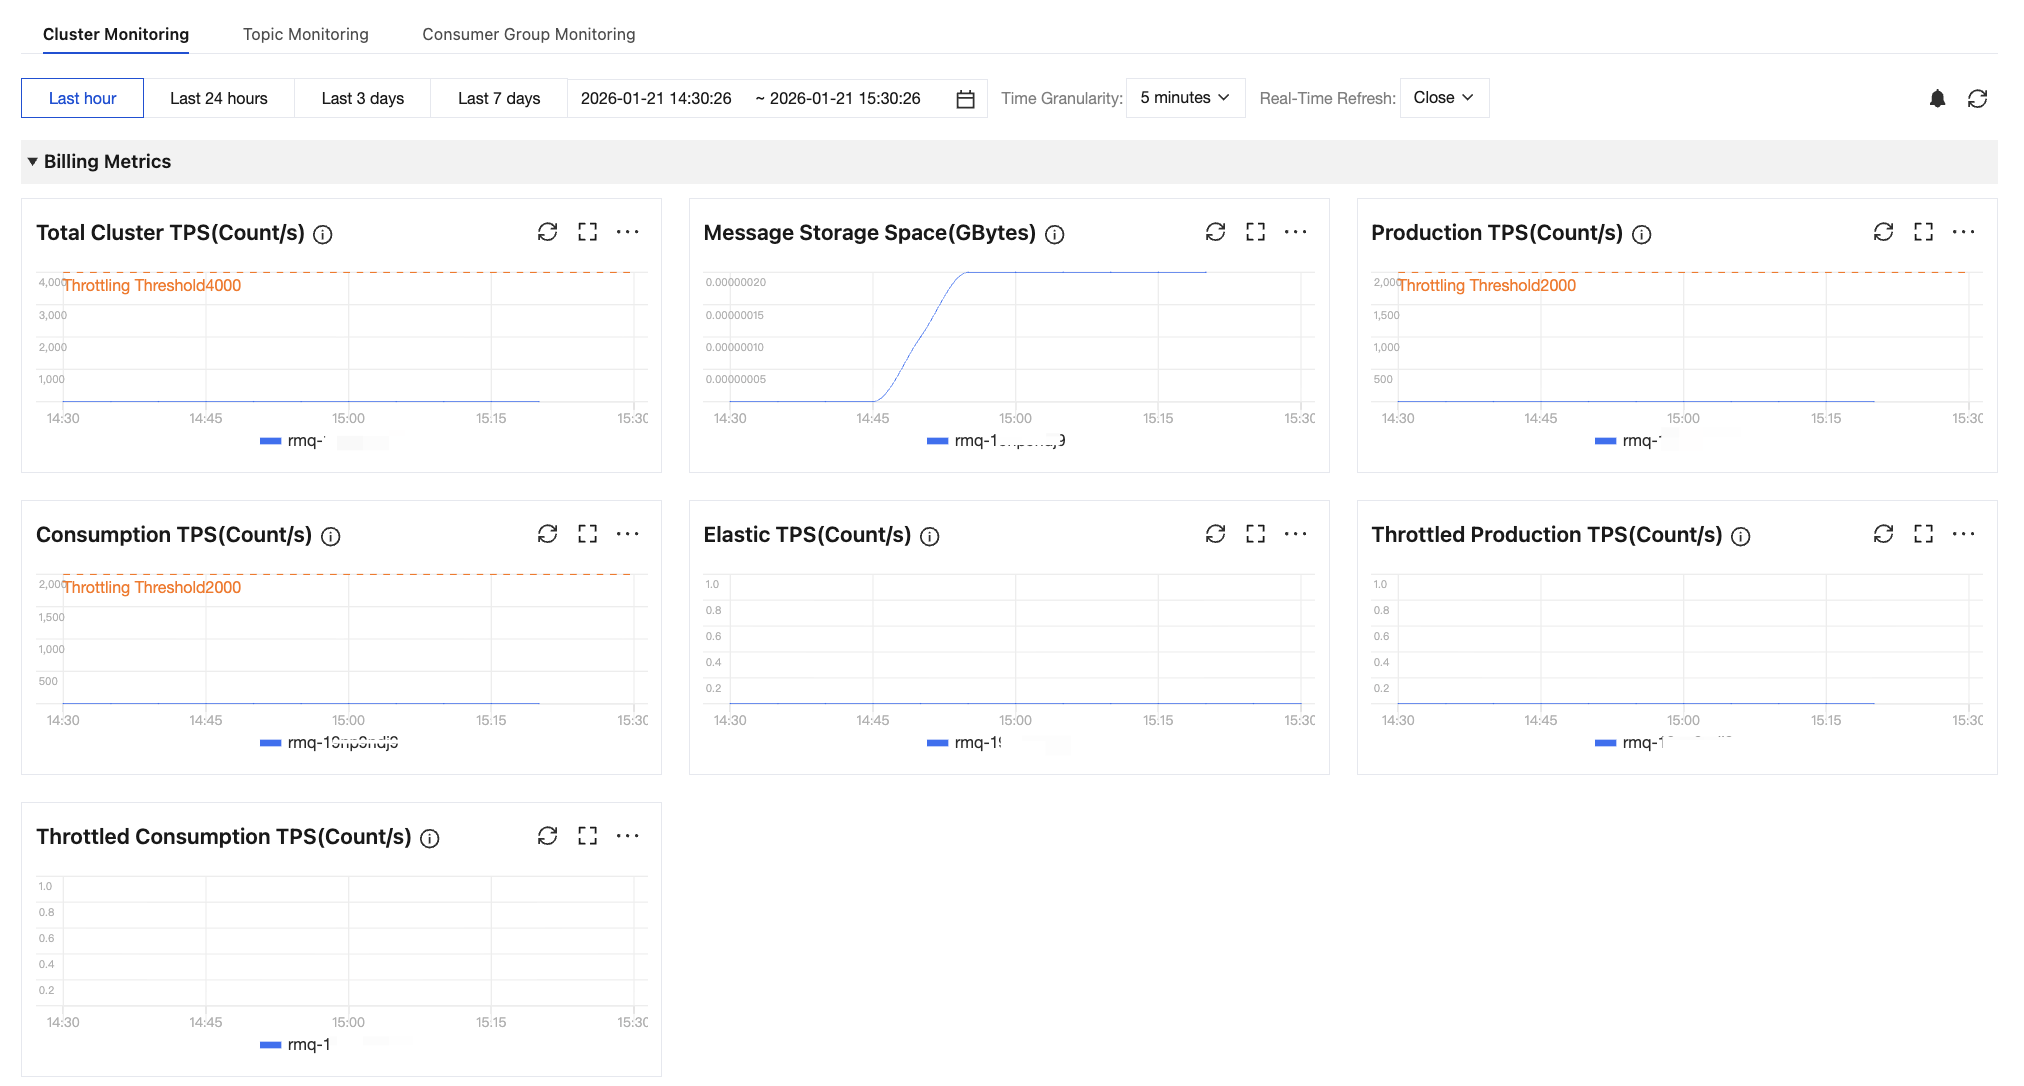
On the cluster monitoring page, you can select multiple topics within the cluster to view a comparison of their metrics, as shown in the following figure.
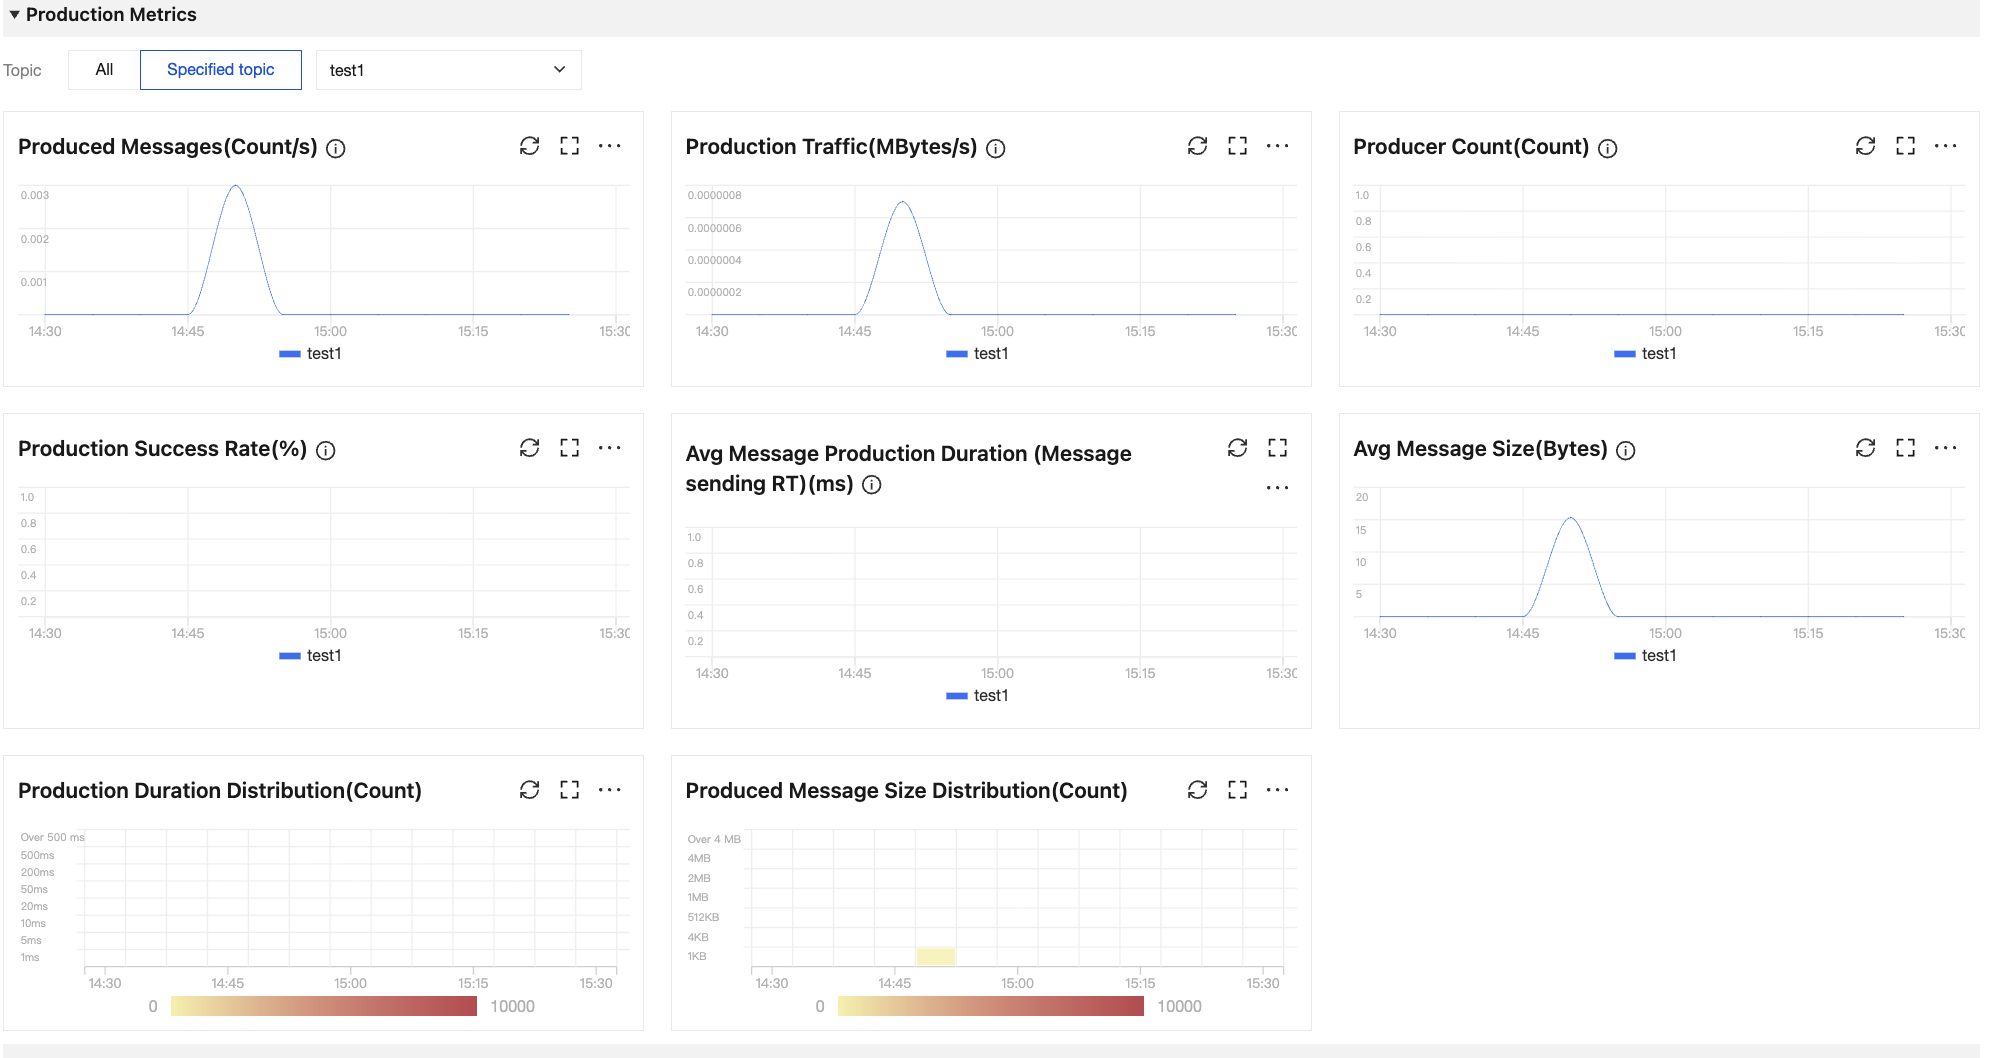
Similarly, you can view a comparison of relevant metrics for multiple groups within a subscription relationship under a specific topic. You can also view a comparison of relevant metrics for multiple topics within a subscription relationship under a specific group.
Time Selector Description
You can flexibly control monitoring data display through the following features: freely selecting time ranges, adjusting the time granularity, and setting refresh rates.
Operation | Icon | Description |
Selecting the time range | 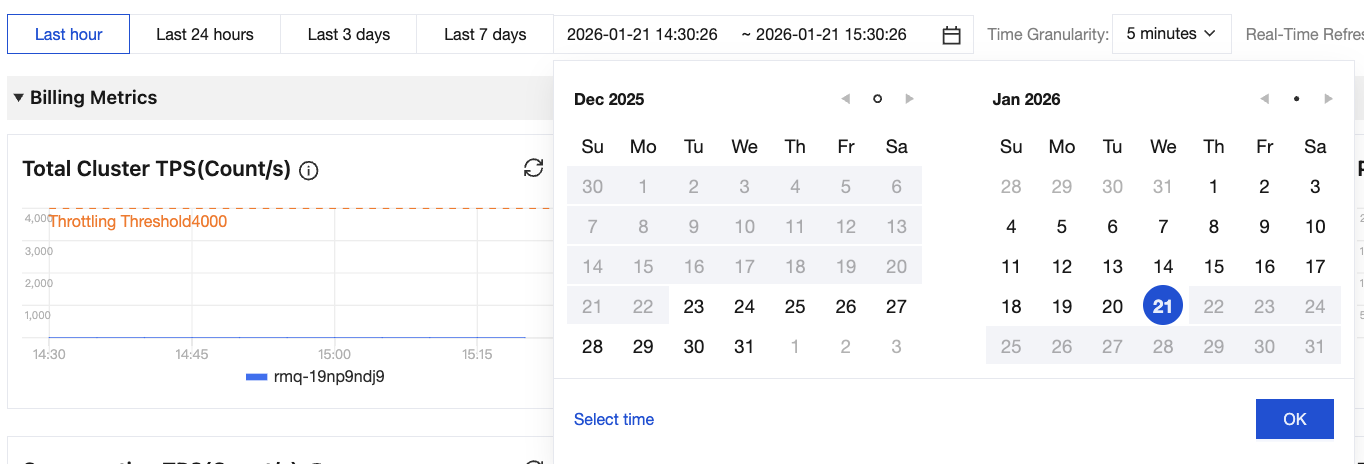 | You can click the time selection box to select the time range for monitoring data chart display. By default, the last hour is selected for data display. You can quickly select a specified time range through the top time values. You can select a long time range through the calendar. You can click Select Time in the lower-left corner to further select a time range accurate to seconds. |
Adjusting the time granularity | 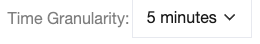 | You can select 1 minute, 5 minutes, or 1 hour from the Time Granularity drop-down list. |
Setting the real-time refresh rate | 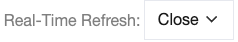 | You can set a real-time auto refresh interval for charts by clicking the Real-Time Refresh drop-down list. Options include 30 seconds, 1 minute, 5 minutes, or disabled. |
Chart Icon Description
The following table describes operations that can be performed for each monitoring chart provided by TDMQ for RocketMQ.
Operation | Icon | Description |
Viewing data | 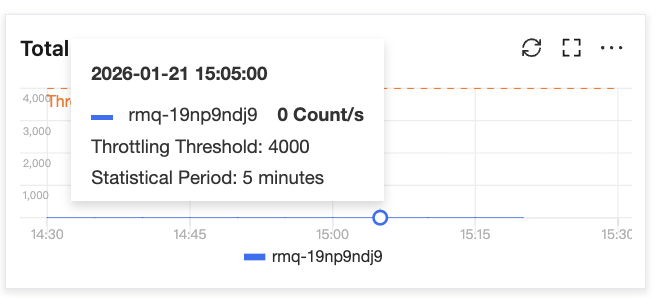 | You can hover the cursor over a chart to view detailed data at a time point. |
Refreshing data |  | You can click the icon to refresh a monitoring chart to display the latest data. |
Full-screen display |  | You can click it to view a chart in full-screen mode. Press Esc or the close icon in the upper-right corner to exit the full-screen mode. |
Exporting data |  | You can click it to export chart data as a CSV file or as a PNG image. |
피드백