Enabling One-Click Diagnosis
Download
フォーカスモード
フォントサイズ
TDMQ for CKafka (CKafka) has launched the one-click diagnosis feature, which can actively troubleshoot cluster issues and potential risks. Based on the accumulated Tencent Cloud expert experience, it provides solutions for issues, automatically summarizes health check results, and generates reports. The one-click diagnosis capability extracts key information, locates issues, and provides professional solutions and suggestions for users, achieving a closed-loop Ops experience.
Constraints and Limitations
Only CKafka Pro Edition instances support the one-click diagnosis feature.
You can only perform one-click diagnosis once per day. After using up the quota, you cannot click Diagnose Now. Use the quota reasonably.
Operation Steps
1. Log in to the CKafka console.
2. In the left sidebar, select Instance List. Click the ID of the target instance to go to the basic instance information page.
3. On the left side of the page, select the Smart Ops tab, and then select the Quick Diagnosis sub-tab. If you are using the one-click diagnosis capability for the first time, you will see the following page, where you can perform the following operations:
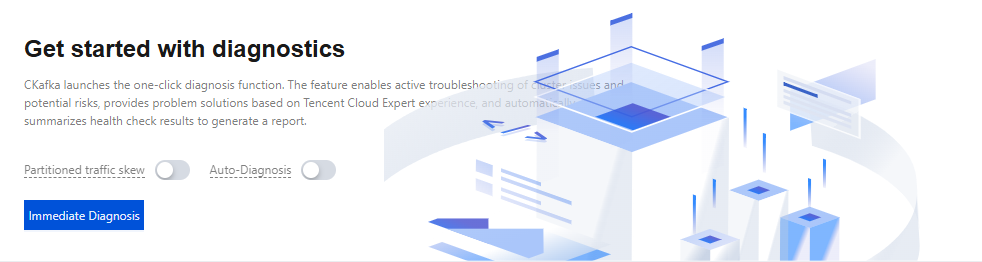
Immediate Now to start the diagnosis immediately. The diagnosis result will be displayed on the page after the diagnosis is completed.
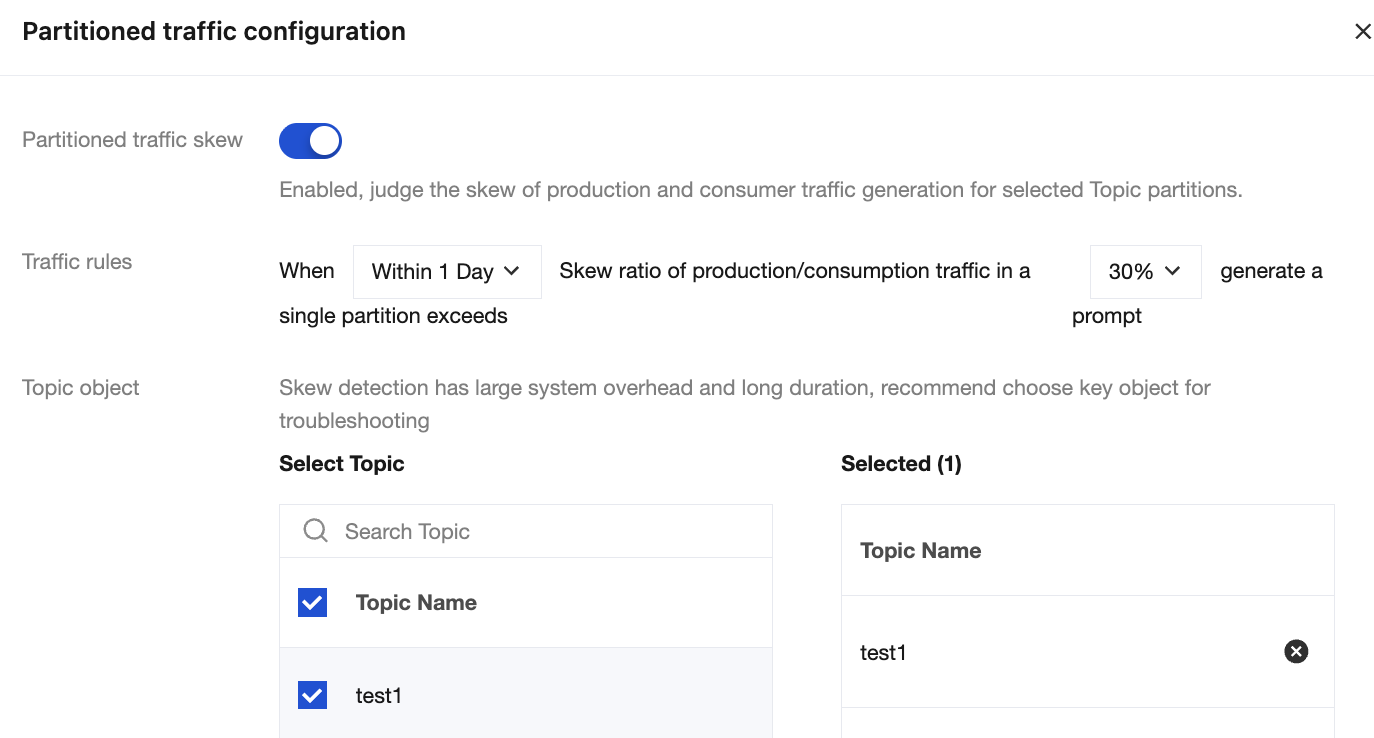
Enable Partitioned traffic skew. After it is enabled, the production and consumption traffic skew of partitions under the selected topic will be evaluated. The evaluation rule is whether the total production/consumption traffic volume of any single partition exceeds the specified proportion of the average traffic volume across all partitions in the topic within the specified time range.
Traffic rules: Set the time range and skew ratio for diagnosis of the partition traffic skew.
Time range: Within 30 minutes, within 1 hour, within 3 hours, within 6 hours, within 12 hours, or within 1 day.
Skew ratio: Ratio by which the total message production/consumption traffic volume of a single partition exceeds the average of all partitions in the topic. Supported range: 10%–100%.
Topic object: Topics to be diagnosed. You can select up to 10 topics. The diagnosis involves obtaining the top 10 partitions with the highest traffic volume under each topic and comparing their traffic volumes with the average value.
Enable Auto-Diagnosis. After it is enabled, diagnosis will be automatically triggered once per day at the specified time, and a diagnosis report will be generated. If you modify the diagnosis time and the diagnosis is not triggered on that day, it indicates that the scheduled diagnosis time has not arrived, and automatic diagnosis will be triggered at your modified time. If your modified diagnosis time has already passed, automatic diagnosis will not be triggered on that day.
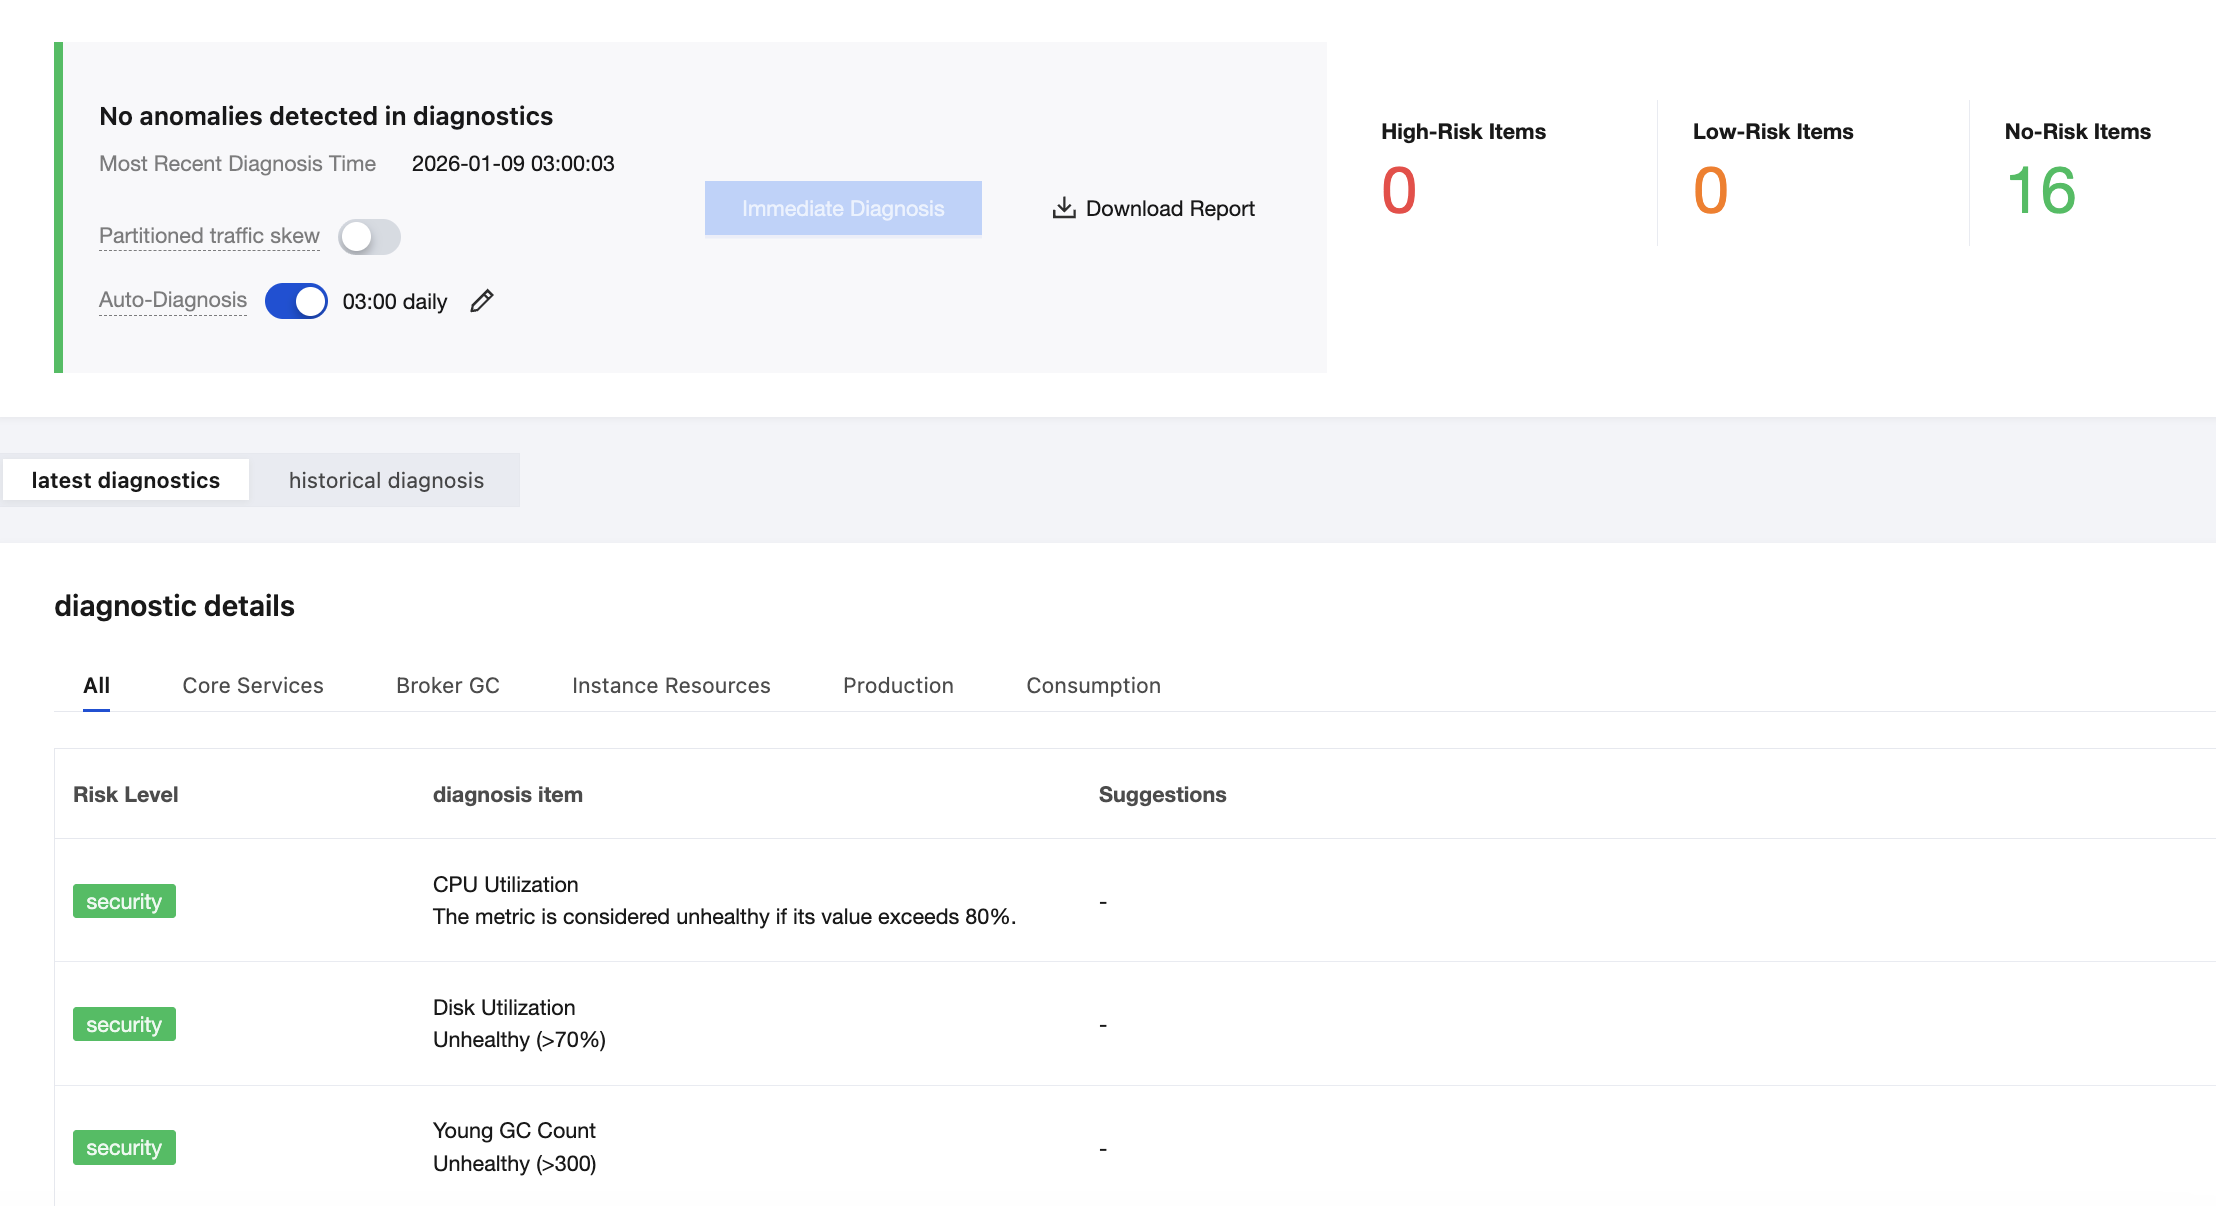
4. After completing the diagnosis normally, you can view the latest and historical diagnosis results at the bottom of the page. If the diagnosis conclusion is abnormal, you can click Download Report to the right of Diagnose Now, or view the report under the Latest Diagnosis tab, and promptly address identified issues by following the detailed explanations and recommendations for risk items in the diagnosis report to ensure normal business operations.
フィードバック