Overview
TKE Serverless provides out-of-the-box event dashboards and can automatically configure the event overview dashboard and aggregated exception search dashboard for the cluster with event storage enabled. With user-defined filters and built-in CLS global event search, TKE Serverless makes it convenient for you to comprehensively observe, find, analyze, and locate problems in the TKE console.
Feature Description
Three dashboards are configured in Event Search, namely Event Overview, Aggregated Exception Search, and Global Search. Follow the steps below to enter the Event Search page and use the features:
2. Enable Event Storage. For more information, see Event Storage. 3. On the left sidebar, select Log Management > Event Search.
Event overview
On the Event Overview tab, you can filter events based on dimensions such as time, namespace, level, reason, resource type, and resource object, view the aggregated statistics of the core event, and display data comparison within a period. Specifically, you can view dashboards of the total number of events and distribution, node exceptions, Pod OOM errors, and important event trends as well as the top exception list.
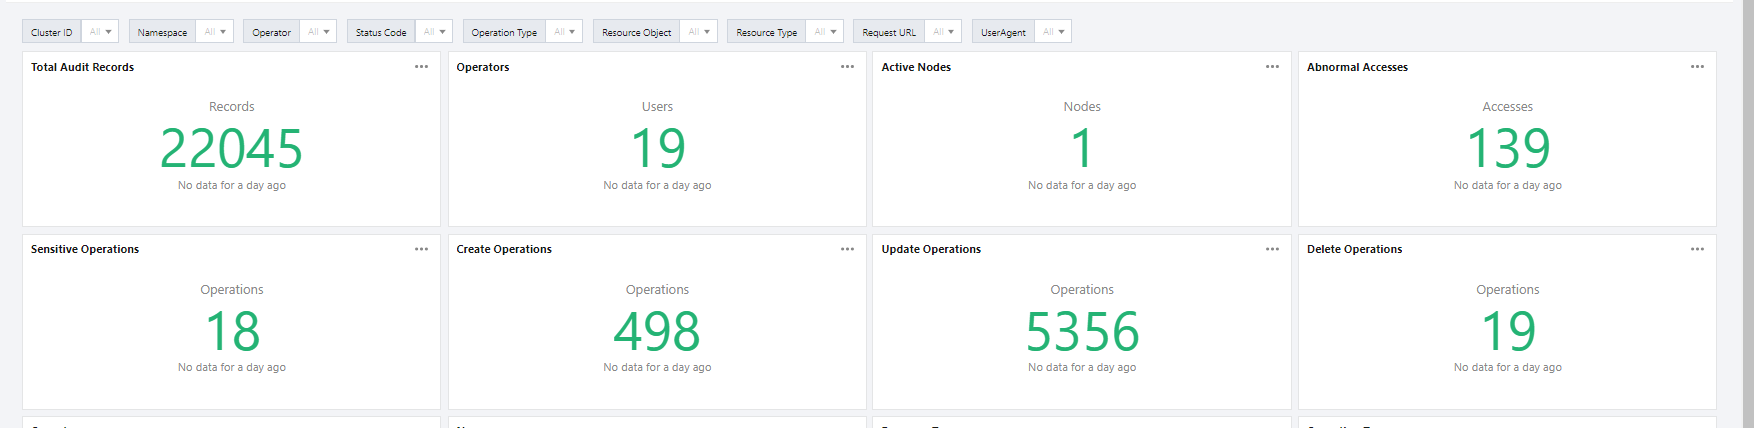
You can view more statistics on this page as shown below:
The total number of events, level distribution, causes of exceptions, and object distribution are as shown below:
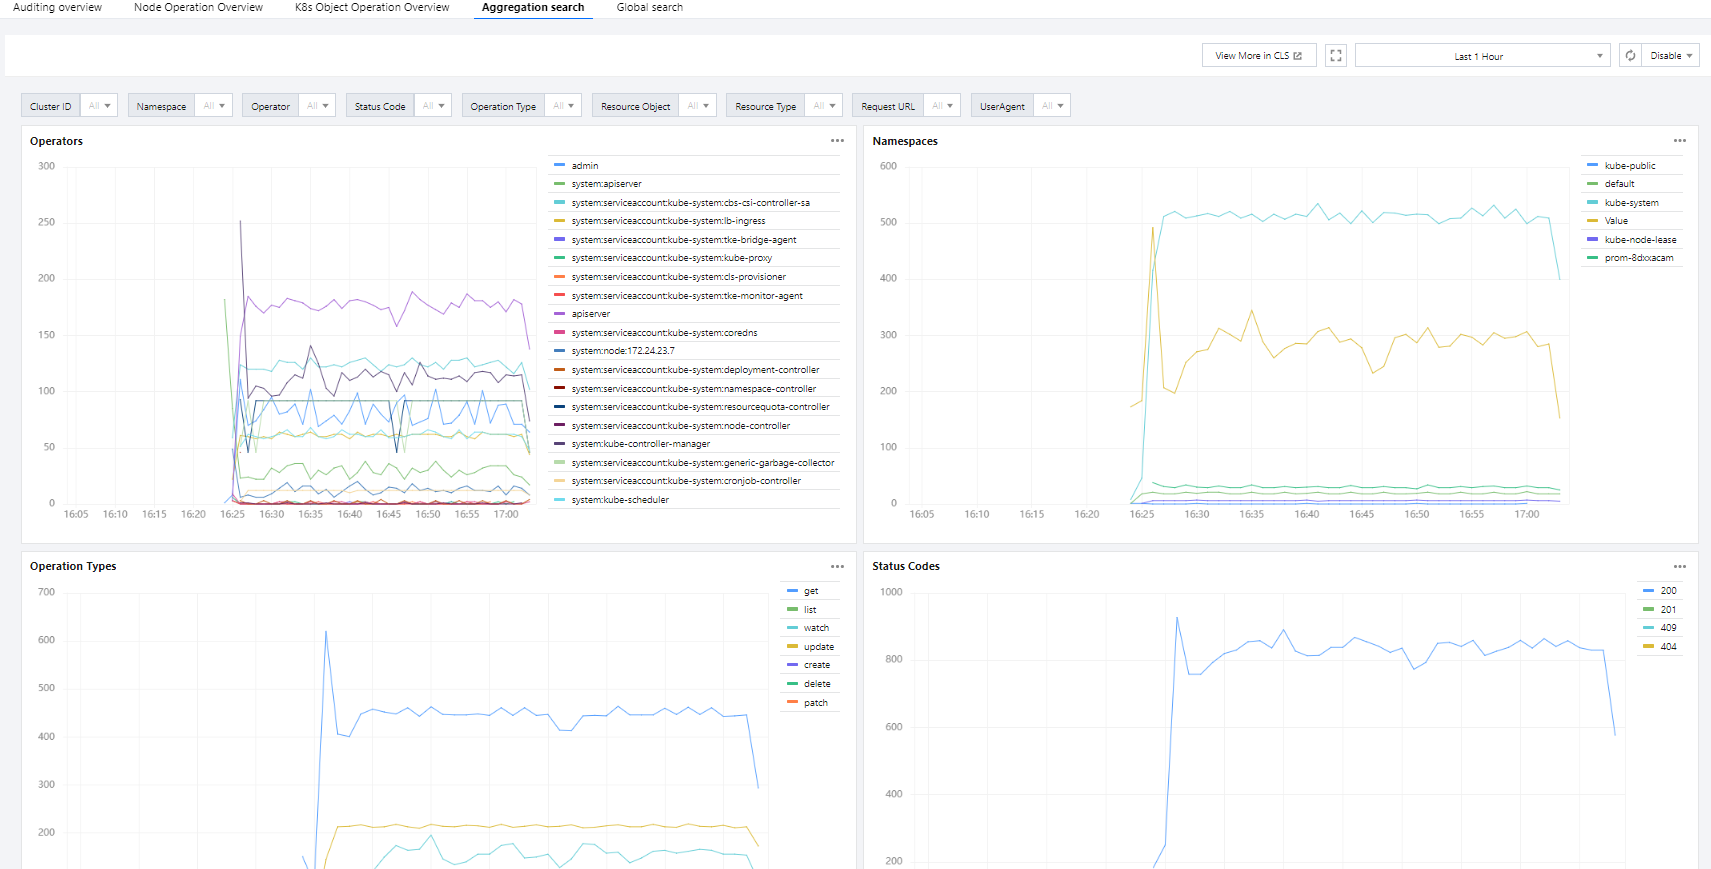
The aggregated information of common events is as shown below:
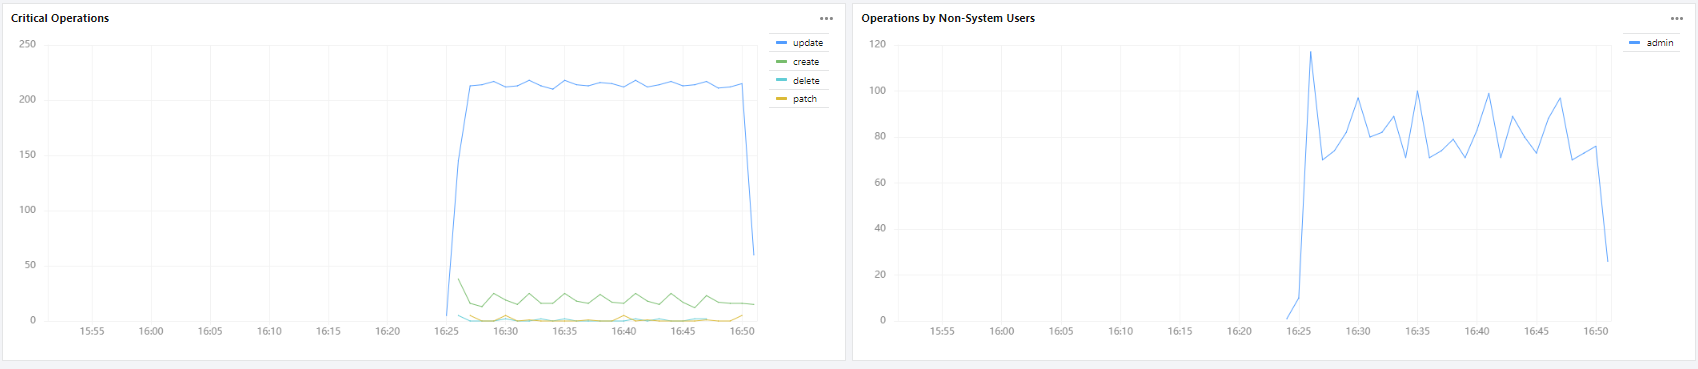
Event trends and the top exception list are as shown below:
Aggregated exception search
On the Aggregated Exception Search tab, you can set filters to view the cause and object distribution trends of exceptions over a specified period of time. You can also search for exceptions in the list below the trend diagrams to quickly locate problems as shown below:
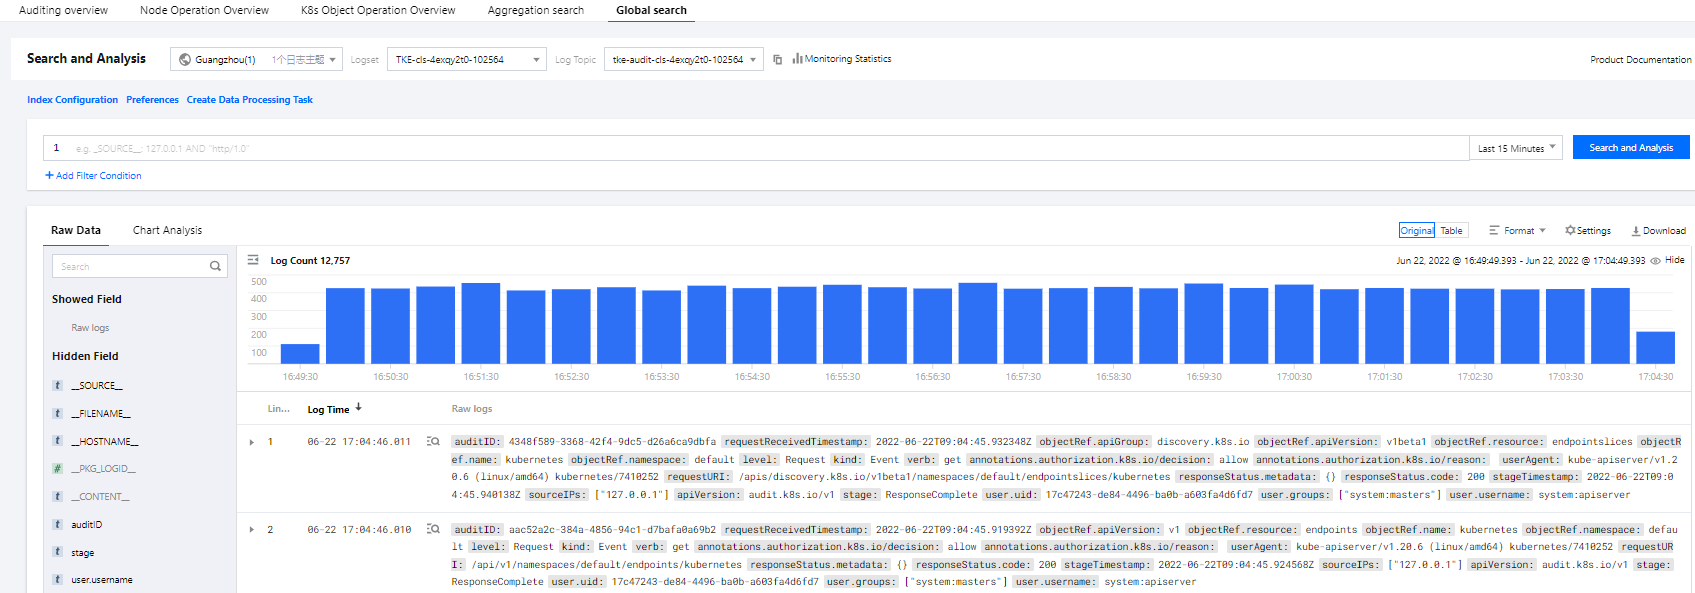
Global search
The global search dashboard with the built-in CLS search and analysis page makes it convenient for you to quickly search for all events in the TKE console as shown below:
Configuring alarm by dashboard
You can configure alarms based on the preset dashboards as instructed below, so that alarms will be triggered when the configured conditions are reached:
1. Click on the right of the target dashboard and select Quickly Add Alarm from the drop-down list as shown below: