You can configure alarm rules for monitoring metrics to prevent your system operations from being disrupted when these metrics reach a certain value. When monitoring data meets the configured conditions, the system can check it automatically and send alarm notifications to the admin. This allows you to stay on top of business exceptions and solve them quickly.
Alarm Metric Dimensions
TencentDB for MongoDB provides alarm configurations in three dimensions: instance, replica set, and node. You can set alarm rules for metrics of each dimension. The details are as follows:
Instance: The instance dimension is for the entire MongoDB cluster. It monitors the number of requests, disks, latency, and connections of the entire cluster.
Replica set: Each replica set of TencentDB for MongoDB adopts a one-primary-multiple-secondary architecture, and each shard of the sharded cluster is also a replica set structure, so the database documents are stored in the replica set. This dimension is for the architecture of the stored document. It monitors the cache dirty data, cache utilization, request hit rate, disk utilization, oplog storage time, and primary-secondary delay.
Node(Mongod, Mongos): This dimension is for all nodes in the database cluster. It monitors the usage of Mongod and Mongos nodes, including CPU, memory, disk, inbound and outbound traffic, number of read and write requests, waiting queues, and number of connections.
Alarm Metric
Before alarms are configured, familiarize yourself with the monitoring metrics defined for different policy dimensions and view the alarm configuration recommendations for key metrics. For metrics without specific recommendations, configure them based on your actual business needs.
Instance dimension
Monitoring Metric
Unit
Description
Alarm Configuration Recommendation
Write Requests
-
Number of write requests received by the instance.
-
Read Requests
-
Number of read requests received by the instance.
-
Update Requests
-
Number of update requests received by the instance.
-
Deletion Requests
-
Number of deletion requests received by the instance.
-
Count Requests
-
Number of total requests received by the instance.
-
Aggregate Requests
-
Number of aggregate requests received by the instance.
-
Successfully Executed Requests
-
Number of requests received by the instance that are executed successfully.
-
Disk Utilization
%
The percentage of the used space to the total space of the current disk.
Monitoring cycle: 1 minute. If the utilization is greater than or equal to 90% and the metric exception persists for 3 data points, an alarm will be triggered every 30 minutes.
Requests Consuming 10-50 ms
-
Number of requests with an execution time between 10 and 50 ms.
-
Requests Consuming 50-100 ms
-
Number of requests with an execution time between 50 and 100 ms.
-
Requests Consuming More Than 100 ms
-
Number of requests with an execution time of more than 100 ms.
Monitoring cycle: 1 minute. If the count is greater than or equal to 100 and the metric exception persists for 3 data points, an alarm will be triggered every 30 minutes.
Connection Utilization
%
The percentage of current connections to the maximum connections of the cluster.
Monitoring cycle: 1 minute. If the utilization is greater than or equal to 90% and the metric exception persists for 3 data points, an alarm will be triggered every 30 minutes.
Requests per Second
-
Number of requests received by the instance per second.
-
Command Requests
-
Number of command requests received by the cluster other than INSERT, UPDATE, DELETE, and QUERY requests.
-
Number of Connections
-
Number of TCP connections from cluster clients.
-
Replica set dimension
Monitoring Metric
Unit
Description
Alarm Configuration Recommendation
Dirty Data in Cache
%
The percentage of dirty data in the cache (in bytes) to the maximum cache size.
Monitoring cycle: 1 minute. If the percentage is greater than or equal to 20% and the metric exception persists for -3 data points, an alarm will be triggered every 30 minutes.
Cache Utilization
%
The ratio of the actual cache usage to the configured maximum cache size.
-
Disk Utilization
%
The percentage of the used space to the total space of the current disk.
Monitoring cycle: 1 minute. If the utilization is greater than or equal to 90% and the metric exception persists for 3 data points, an alarm will be triggered every 30 minutes.
Cache Hit Rate
%
The ratio of the number of requests that retrieve data from the cache to the total number of requests.
-
Oplog retention period
hours
Oplog is used to record the operation log of the database, and this metric counts its storage time.
-
Average primary-secondary delay in Unit Time
s
In the replica set architecture, the secondary node periodically polls the oplog (operation log) of the primary node to replicate the data from it. This metric counts the primary-secondary delay in data sync.
Monitoring cycle: 1 minute. If the latency is greater than or equal to 1800 seconds and the metric exception persists for 3 data points, an alarm will be triggered every 30 minutes.
Mongod node
Monitoring Metric
Unit
Description
Alarm Configuration Recommendation
CPU utilization
%
Indicates the percentage of CPU time spent on executing processes compared to total CPU time.
Monitoring cycle: 1 minute. If the utilization is greater than or equal to 80% and the metric exception persists for - data points, an alarm will be triggered every 30 minutes.
Memory utilization
%
The percentage of the used space in the current memory to the total memory space.
-
Inbound network traffic
MB/s
Statistics of inbound traffic per second for the node.
-
Outbound network traffic
MB/s
Statistics of outbound traffic per second for the node.
-
Read Requests in Queue
Pcs
Number of read requests waiting in the queue.
Monitoring cycle: 1 minute. If the count is greater than or equal to 40 and the metric exception persists for - data points, an alarm will be triggered every 30 minutes.
Write Requests in Queue
Pcs
Number of write requests waiting in the queue.
Monitoring cycle: 1 minute. If the count is greater than or equal to 40 and the metric exception persists for - data points, an alarm will be triggered every 30 minutes.
Number of Connections
Pcs
Number of client connections.
-
Used Disk Space
MB
Used node disk capacity.
-
WiredTiger Active Reads
Pcs
Number of active read requests in the memory.
Monitoring cycle: 1 minute. If the count is greater than or equal to 40 and the metric exception persists for - data points, an alarm will be triggered every 30 minutes.
WiredTiger Active Writes
Pcs
Number of active write requests in the memory.
Monitoring cycle: 1 minute. If the count is greater than or equal to 40 and the metric exception persists for - data points, an alarm will be triggered every 30 minutes.
Data Entries Deleted via TTL
Pcs
The number of data entries automatically deleted by the database after the TTL expires.
-
TTL Run Times
-
The number of times data is checked within the TTL time set in the database.
-
Mongos node
Monitoring Metric
Unit
Description
Alarm Configuration Recommendation
CPU utilization
%
Indicates the percentage of CPU time spent on executing processes compared to total CPU time.
Monitoring cycle: 1 minute. If the utilization is greater than or equal to 80% and the metric exception persists for - data points, an alarm will be triggered every 30 minutes.
Memory utilization
%
Indicates the percentage of memory currently in use on the Mongos node compared to total memory capacity.
-
Inbound network traffic
MB/s
Statistics of inbound traffic per second for the node.
-
Outbound network traffic
MB/s
Statistics of outbound traffic per second for the node.
-
Billing Overview
TCOP supports free configuration of alarm policies and monitoring of key instance metrics. Currently, only alarm SMS and phone calls are charged. For details, see Billing Overview.
2. In the MongoDB drop-down list on the left sidebar, select Replica Set Instance or Shard Instance. The directions for replica set instances and sharded cluster instances are similar.
3. Above the
4. In the instance list, find the target instance.
5. In the row of the target instance, enter the Create Policy page of TCOP in any of the following ways:
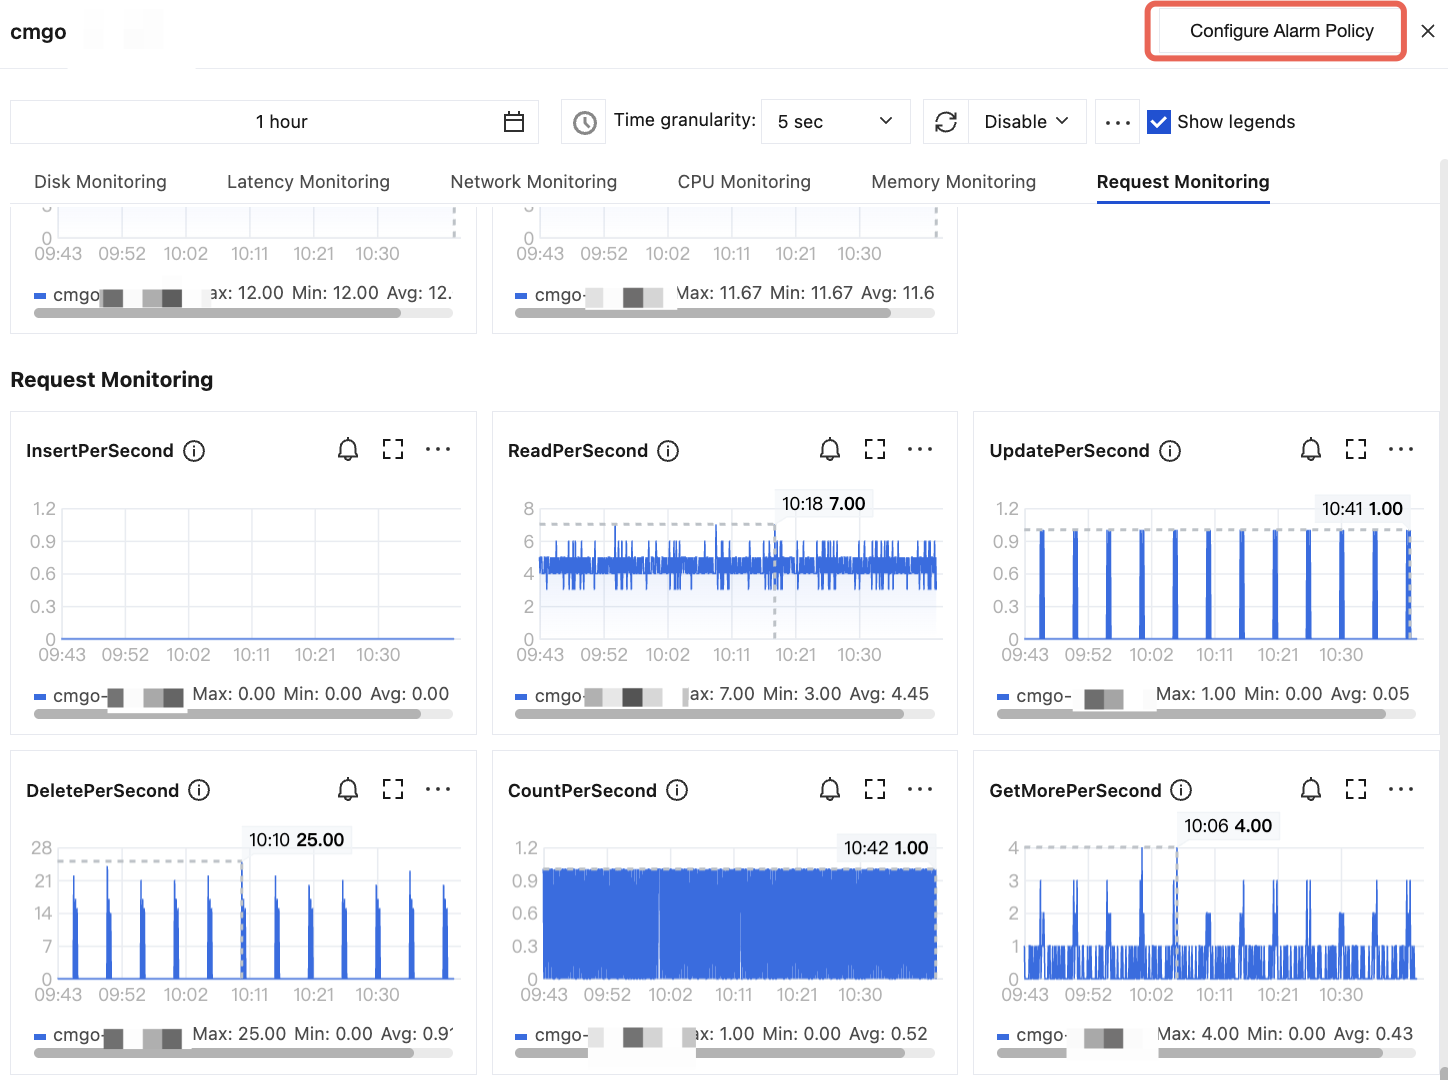
Click in the
column and click Configure Alarm Policy in the top-right corner of the instance monitoring dashboard.
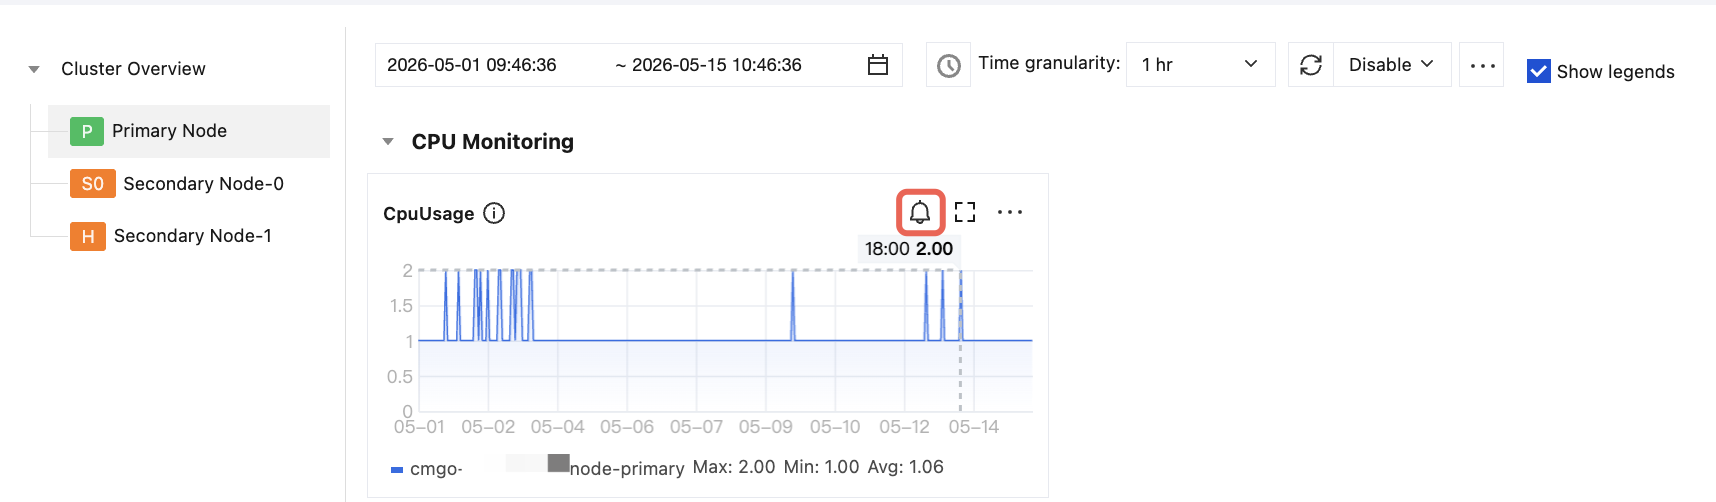
Click the instance ID in blue to enter the Instance Details page. Then, select the System Monitoring tab and on each monitoring metric view card, click the button shown in the figure below.
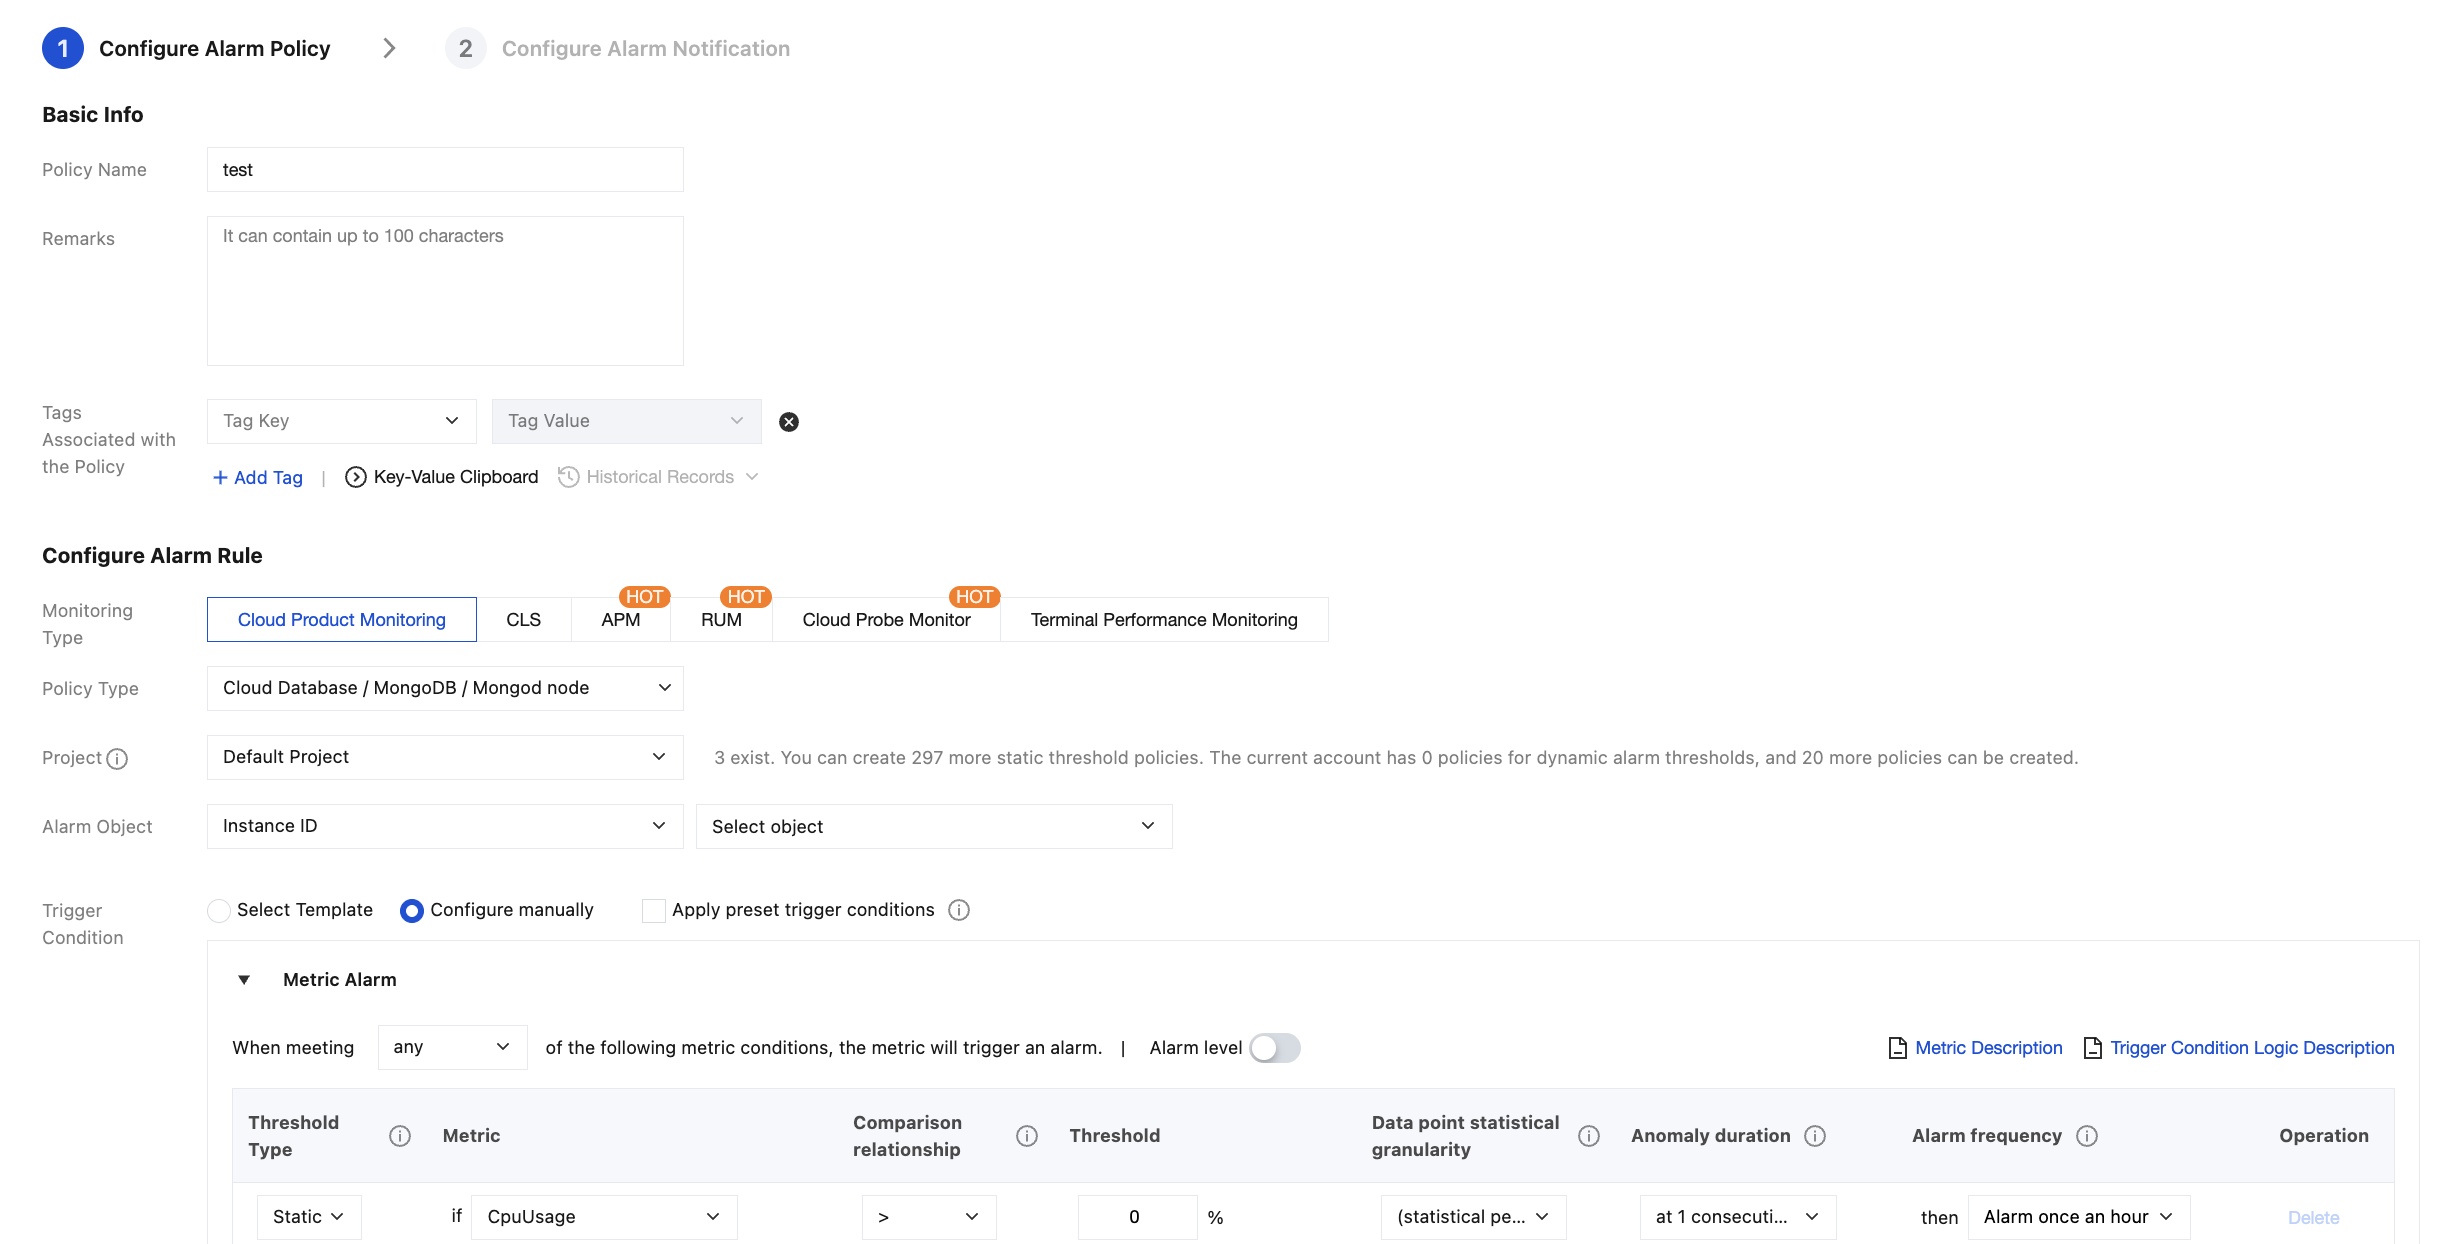
6. On the Create Alarm Policy page, configure a new alarm policy as shown below. For more information on the basic concepts of alarm policy, see Creating Alarm Policy
Parameter
Description
Policy Name
Customize the alarm policy name for easier identification.
Remarks
Briefly describe the alarm policy for easier identification.
Tags Associated with the Policy
Assign tags to the alarm policy.
Monitoring Type
Select Cloud Product Monitoring.
Policy Type
Set the policy type to Cloud Database / MongoDB / Instance, Cloud Database / MongoDB / Mongod Node, Cloud Database / MongoDB / Mongos Node or Cloud Database / MongoDB / Replica Set.
Project
Specify a project for the alarm policy. You can quickly locate all alarm policies of a project in the alarm policy list.
Alarm Object
Select Instance ID: In Select Object, specify the specific database instance.
Select Instance Group: In the instance group selection area, specify a database instance group. For information on how to create an instance group, see Instance Group.
If you select All Objects, the alarm policy will be bound to all instances the current account has permission on.
Trigger Condition
Select Template: Select a template file from the drop-down list. Alarms will be reported according to the preset trigger conditions of the template file. For specific configuration, see Configuring Trigger Condition Templates.
Manual Configuration: You can select Apply preset trigger conditions to apply the default alarm policy, or configure the threshold condition for each metric that triggers an alarm one by one in the Metric Alarm area below. Threshold types in the metric alarm area:
If you select Static, you can manually set a fixed threshold, and alarms will be triggered when the threshold is reached.
If you select Dynamic, exceptions will be determined based on the dynamic threshold boundaries calculated by machine learning algorithms.
7. Click Next step: Configure Alarm Notification, and then select a system preset notification template or a user-defined notification template. For detailed operations, see Notification Template.
8. After confirming that the configuration is correct, click Complete. For more information on alarms, see Alarm Overview.