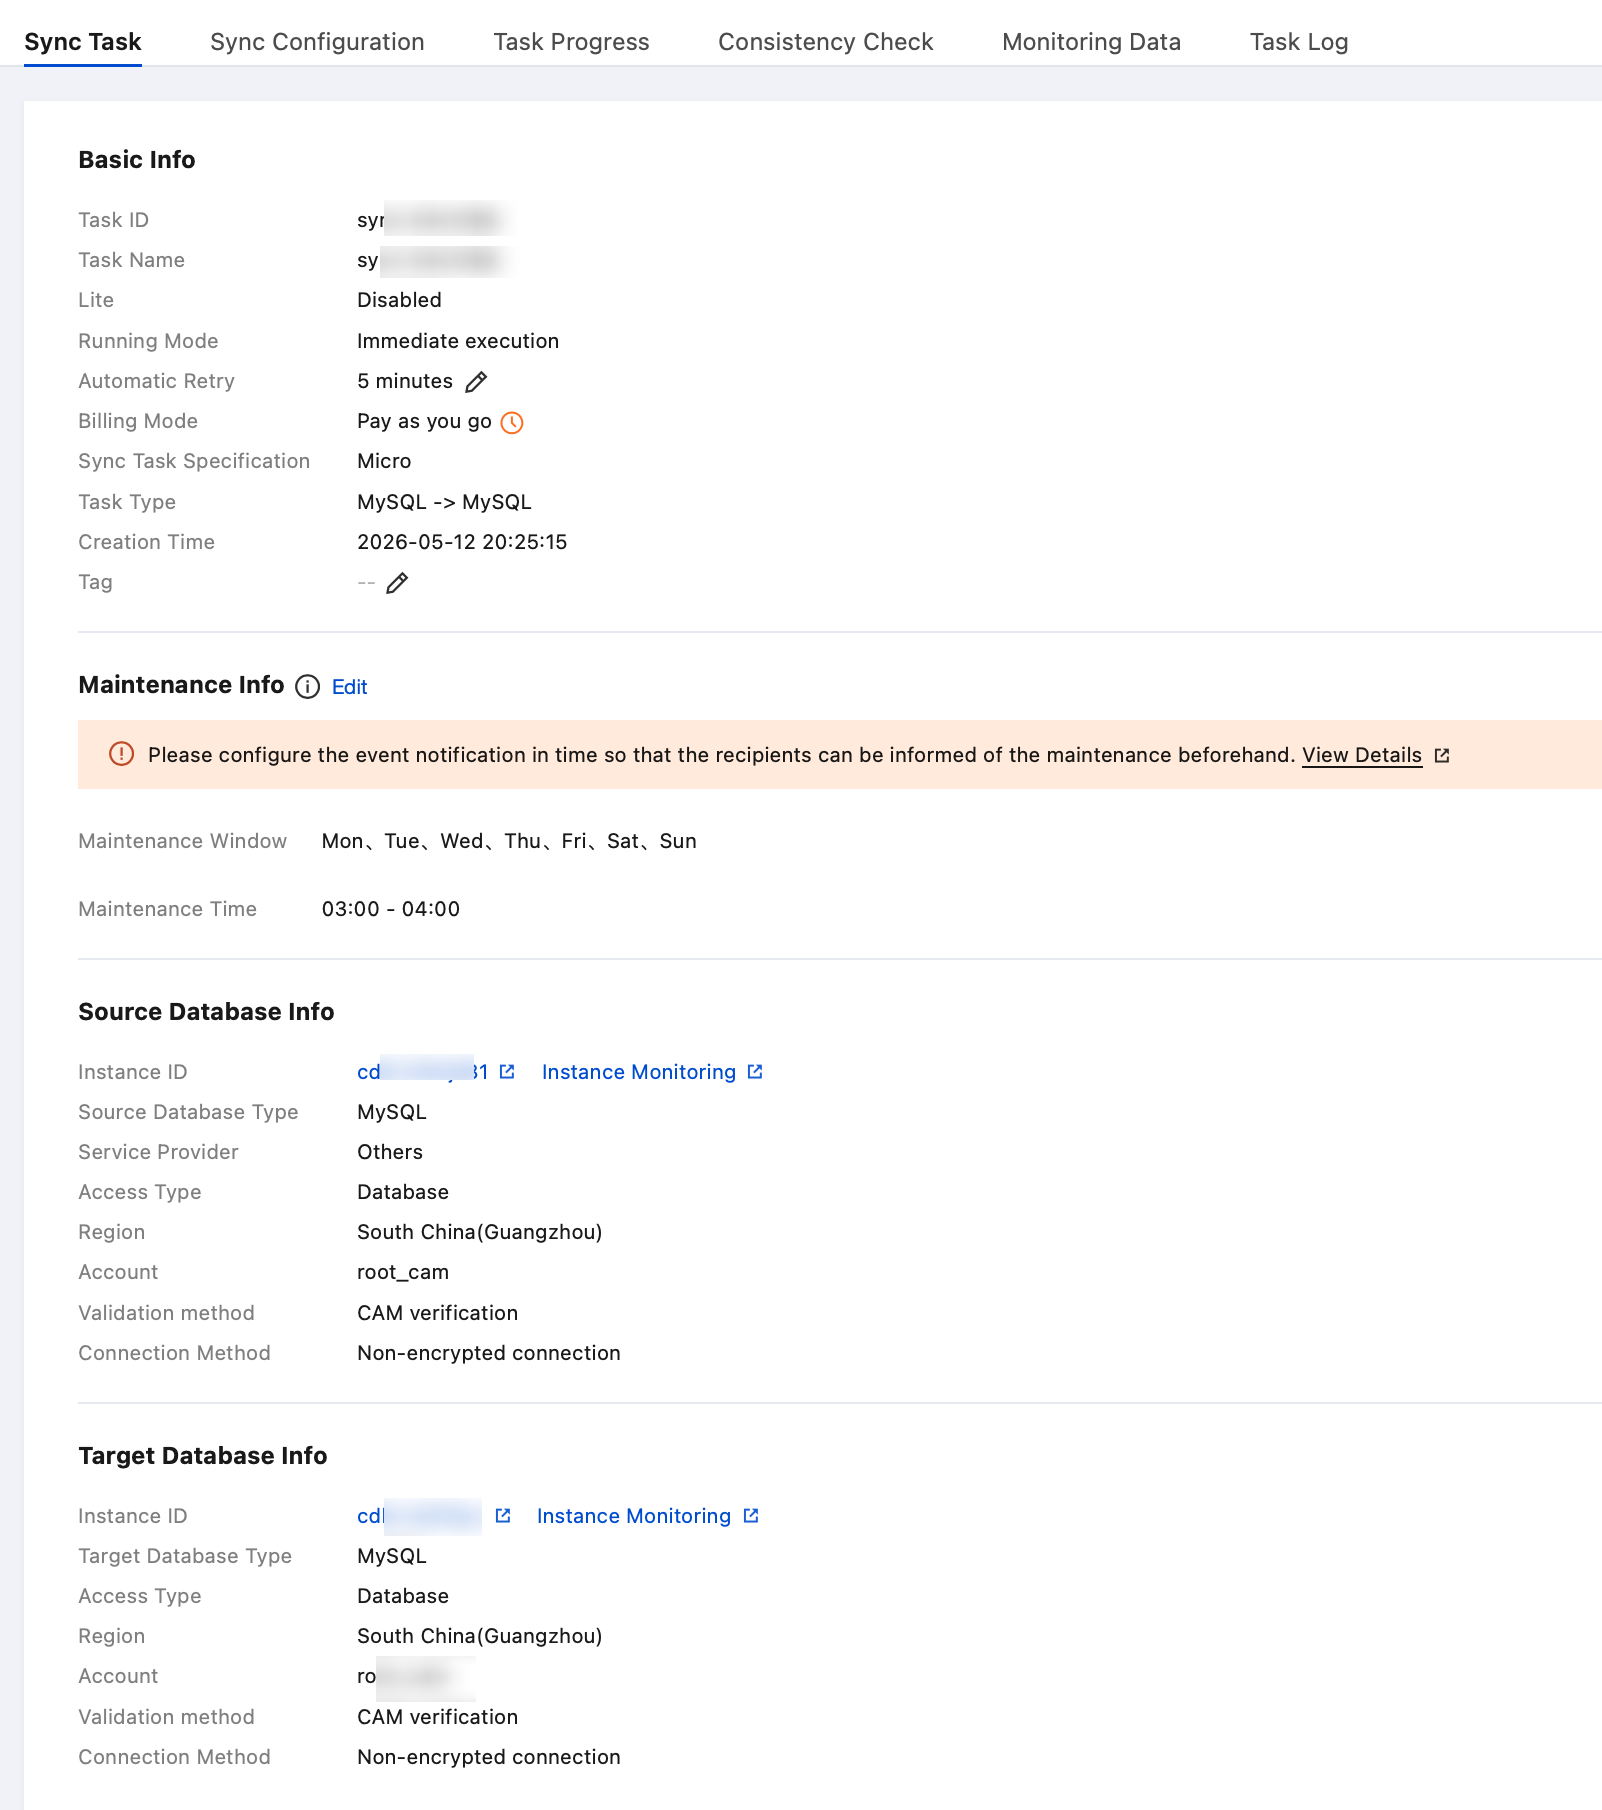
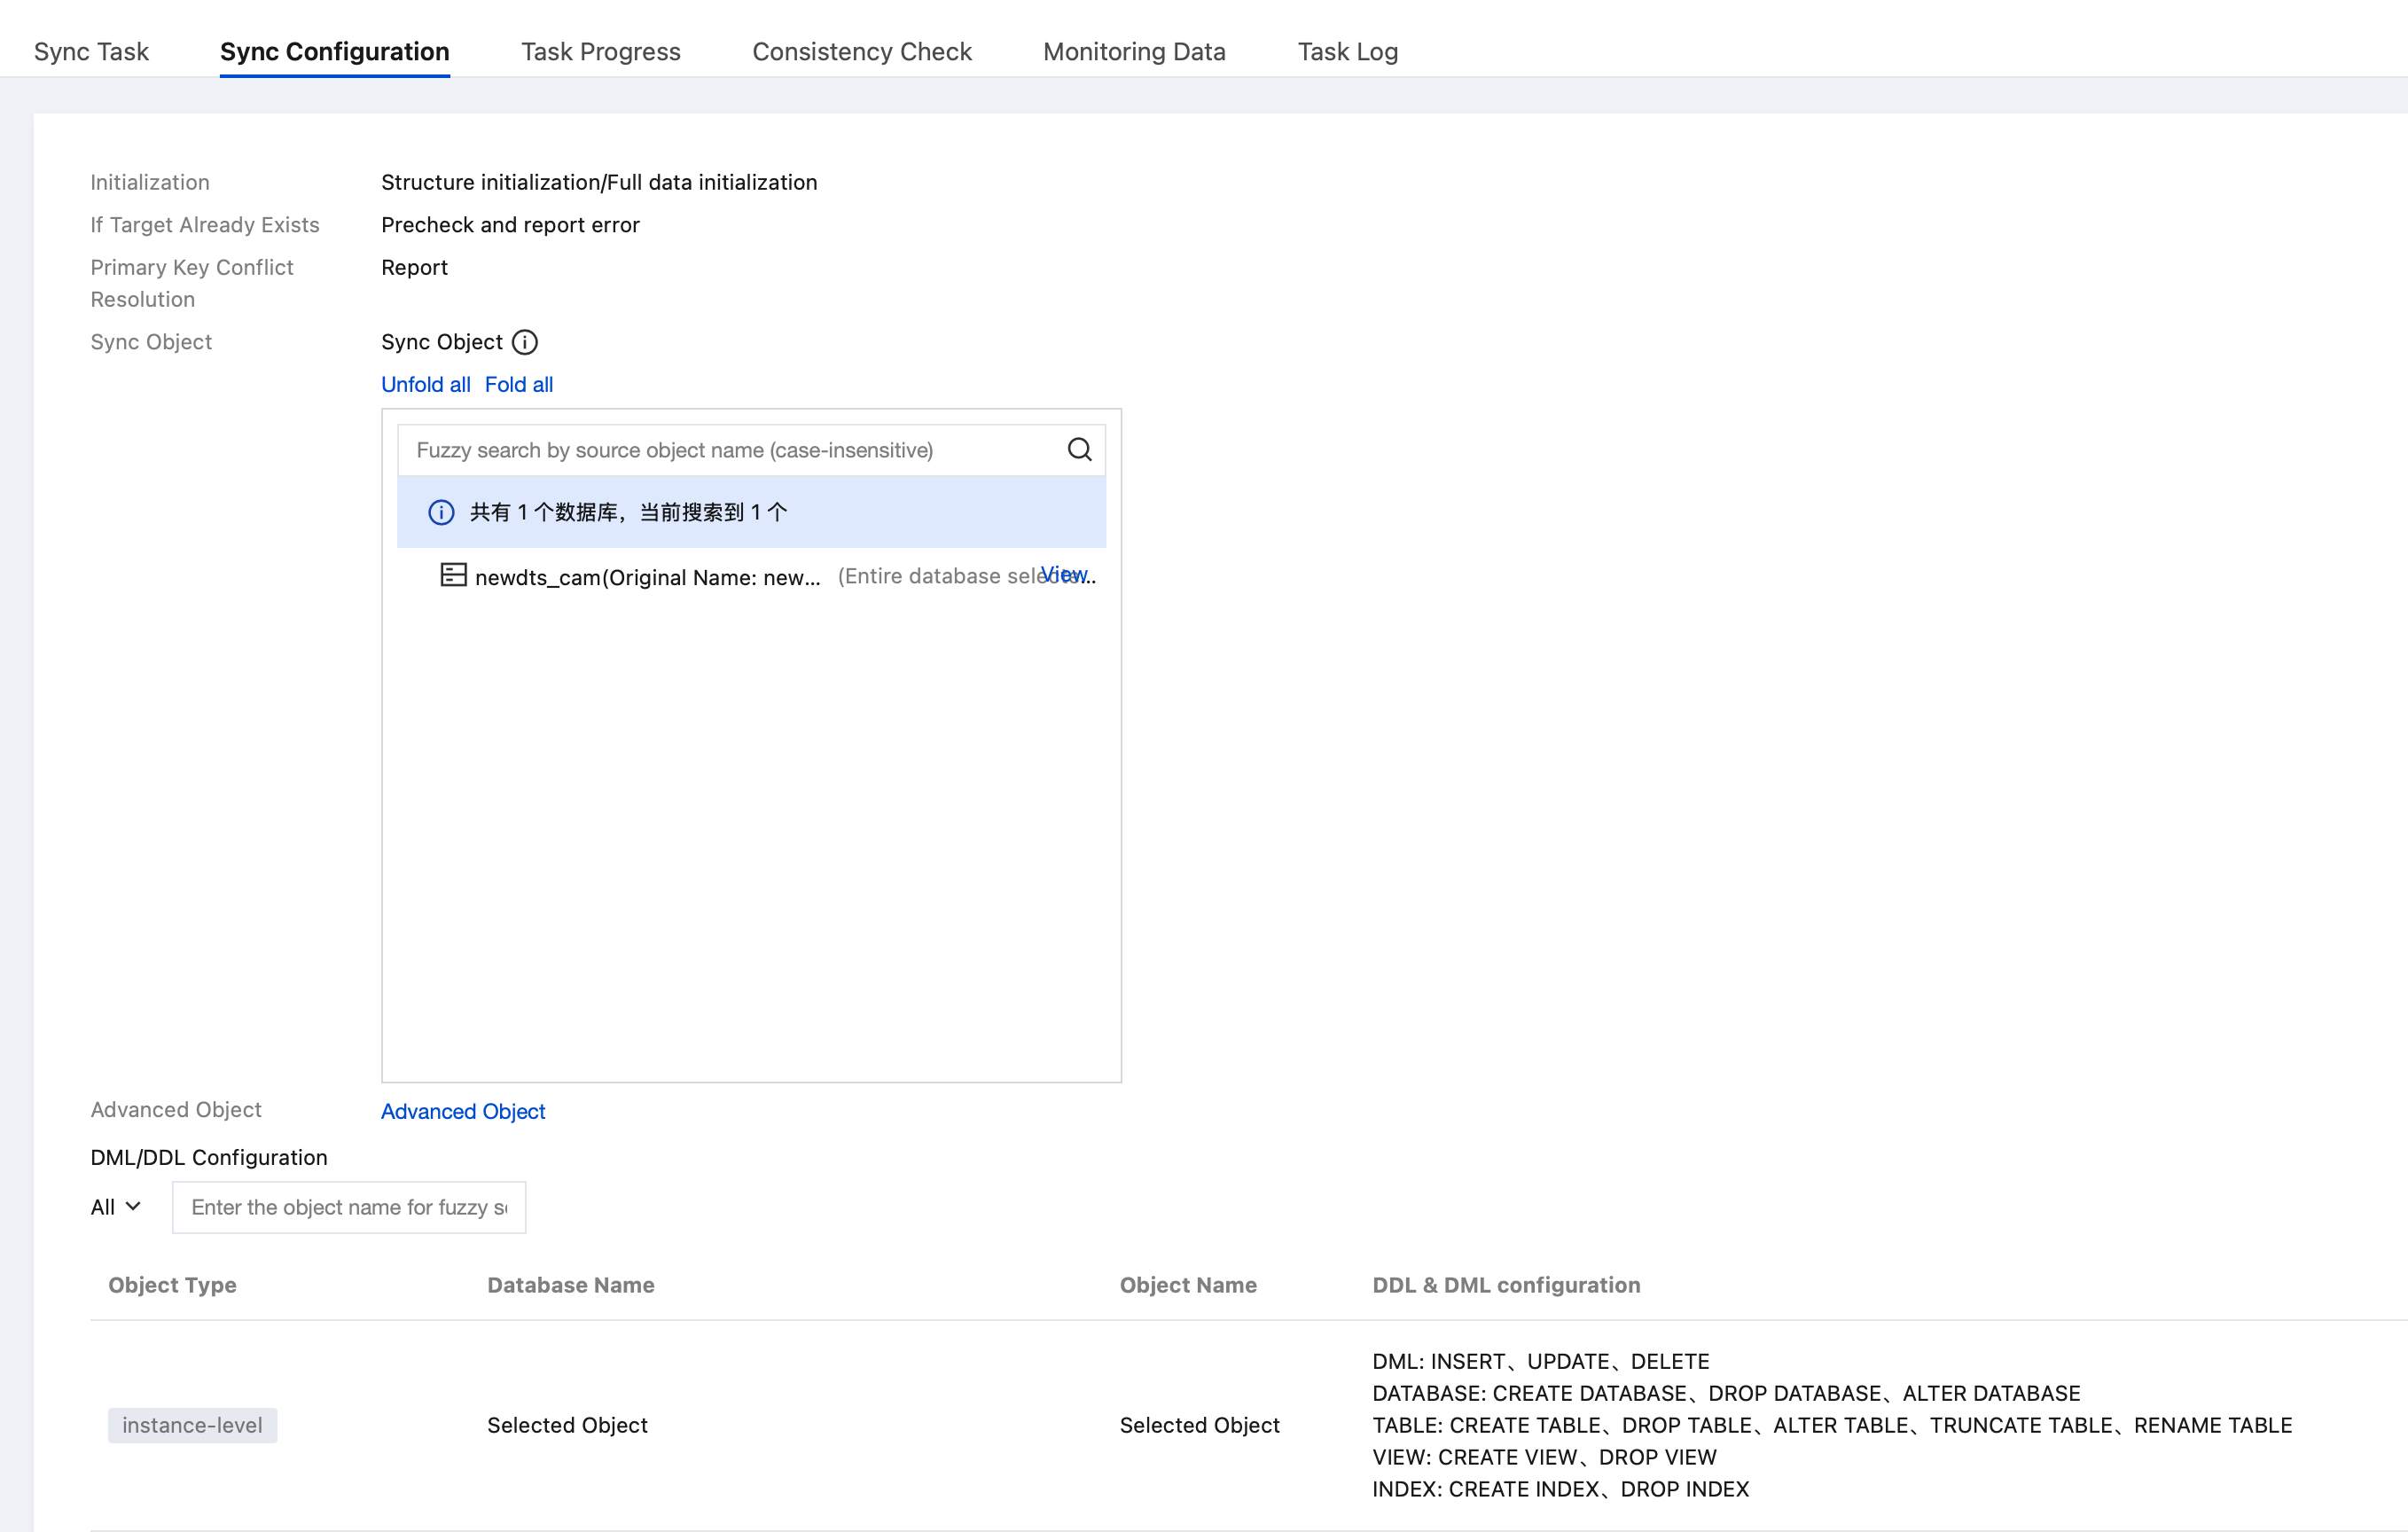
Users can view synchronization tasks, synchronization configurations, structure initialization, data initialization, monitoring data, task logs, and other information in the task details.
Prerequisites
You have successfully created a data synchronization task, logged in to the DTS console, and accessed the data synchronization page.
Operation Steps
Method 1: In the Data Synchronization list, select the specified synchronization task and click the task name.
Method 2: In the Data Synchronization list, select the specified synchronization task and click View in the Operation column.
Viewing the Synchronization Task
Users can view basic task information, source database information, and target database information.
Viewing Synchronization Configuration
Users can view the configuration related to the synchronization task.
Viewing Progress Details
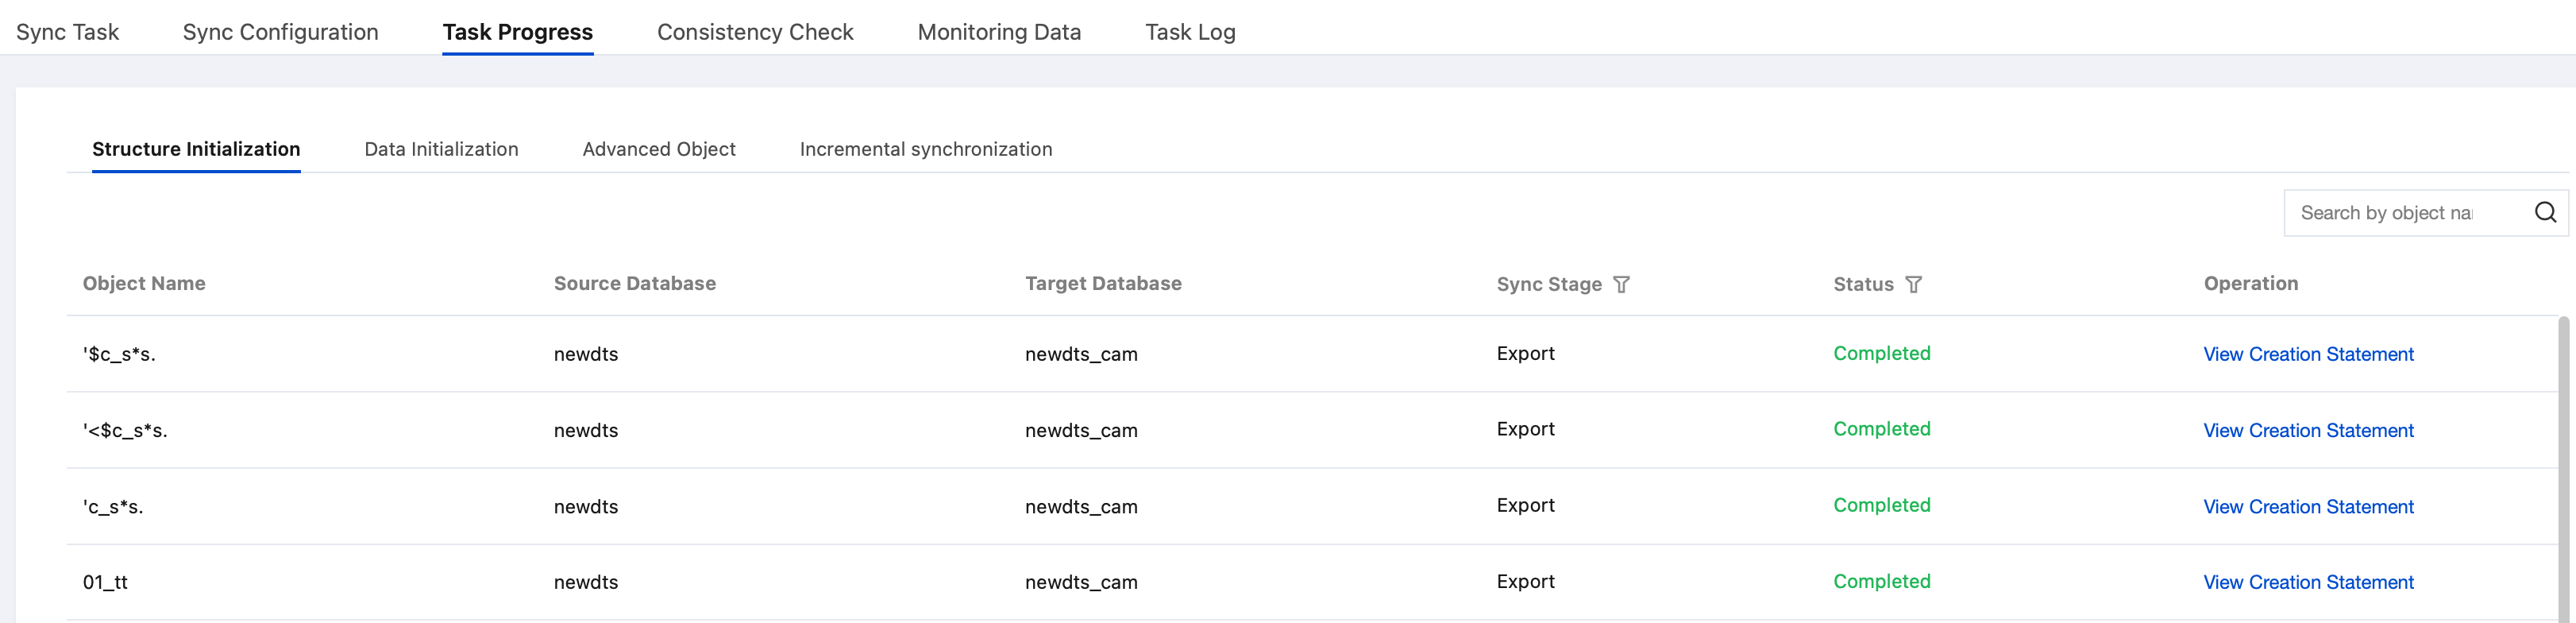
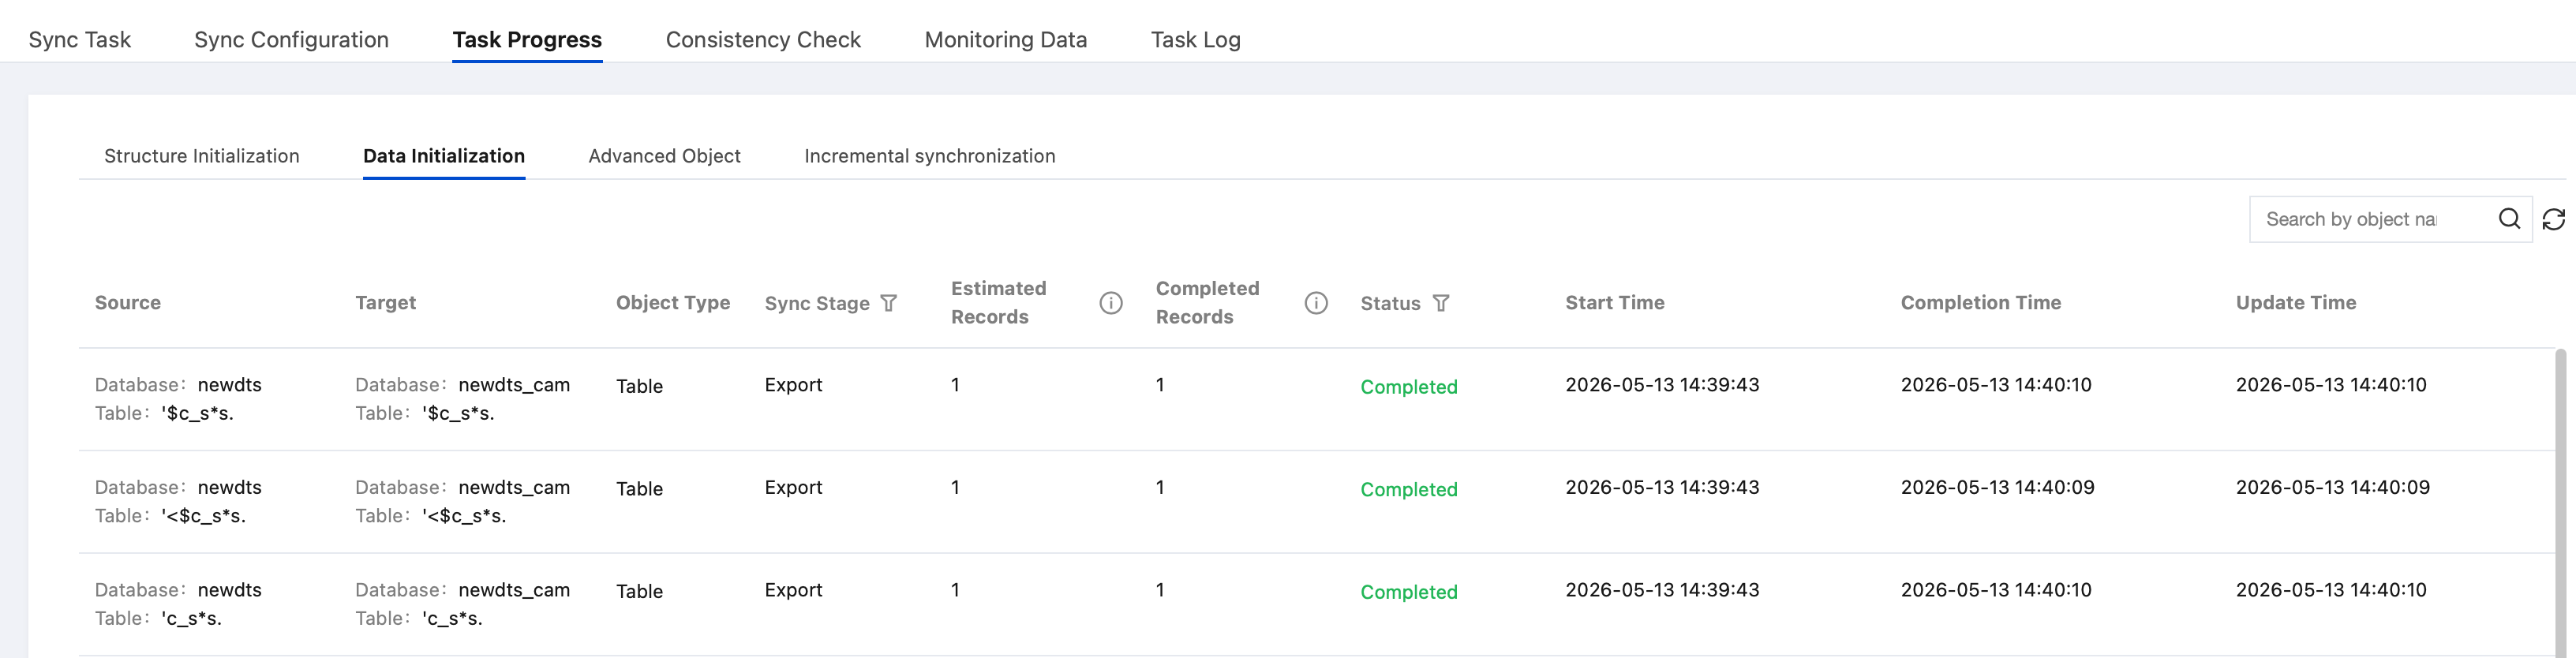
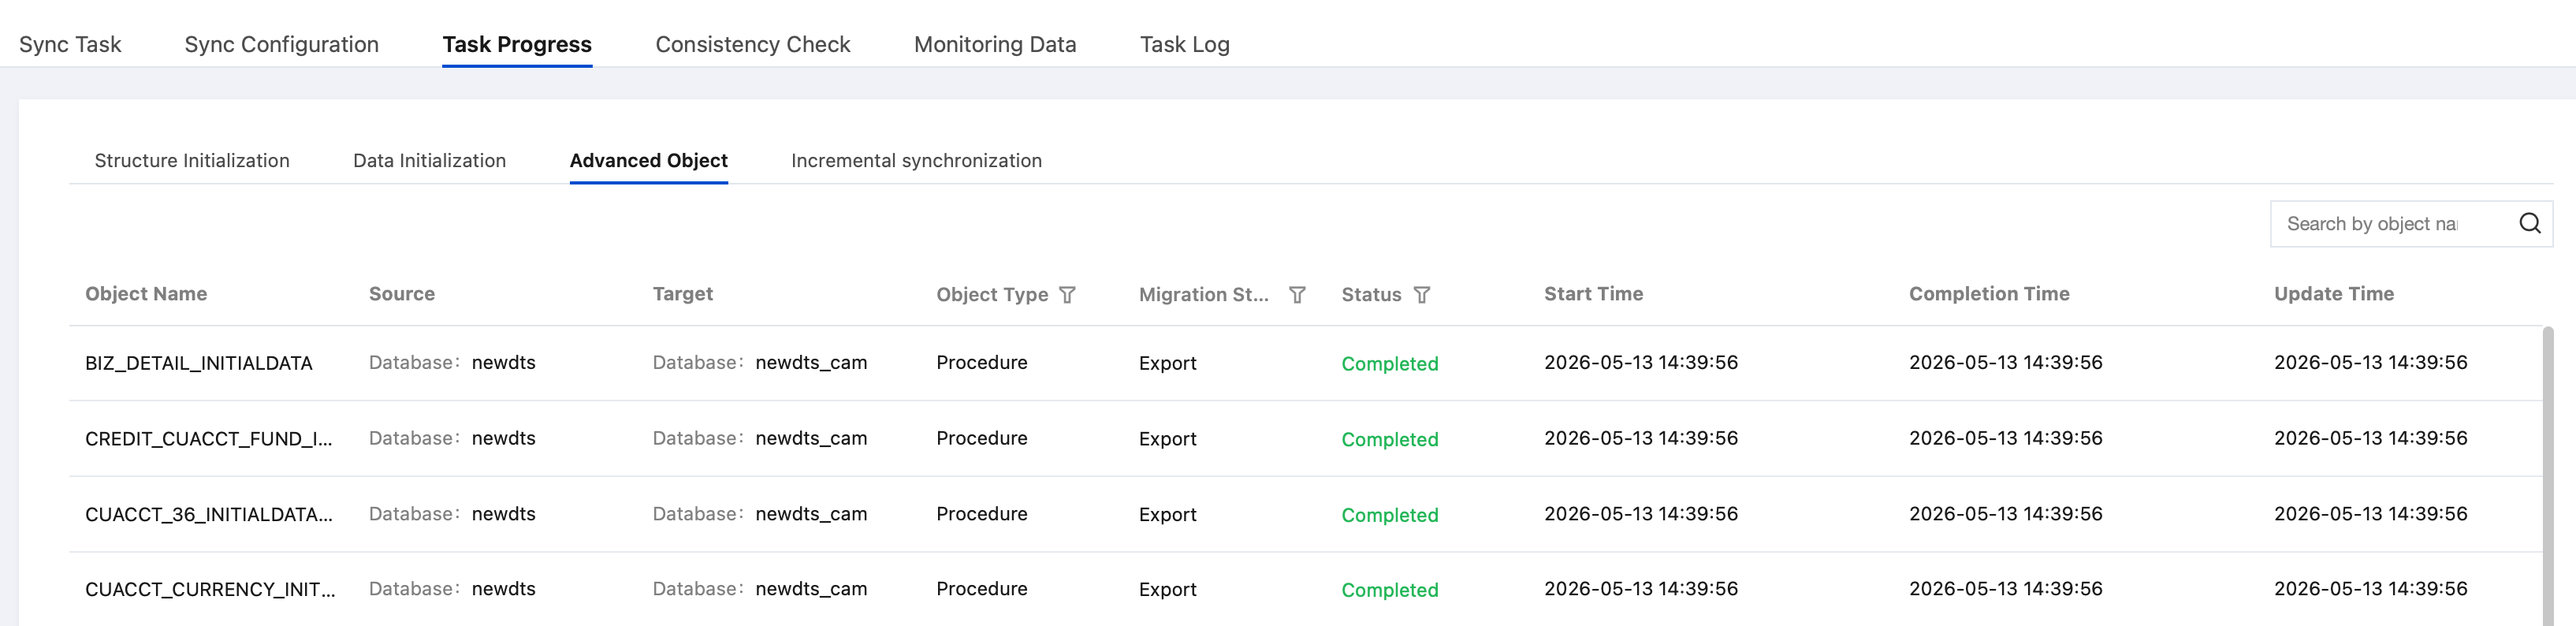
Users can view detailed information about the task progress, including structure initialization, data initialization, and advanced objects. More detailed information includes the migration status of synchronization objects, the estimated number of data rows, and the number of completed rows.
1. Structure initialization
The structure information about table and view objects is displayed on the Structure Initialization tab.
2. Data initialization
For tasks in the failed statuses, users can click View Failure Reason to troubleshoot the cause.
3. Incremental synchronization
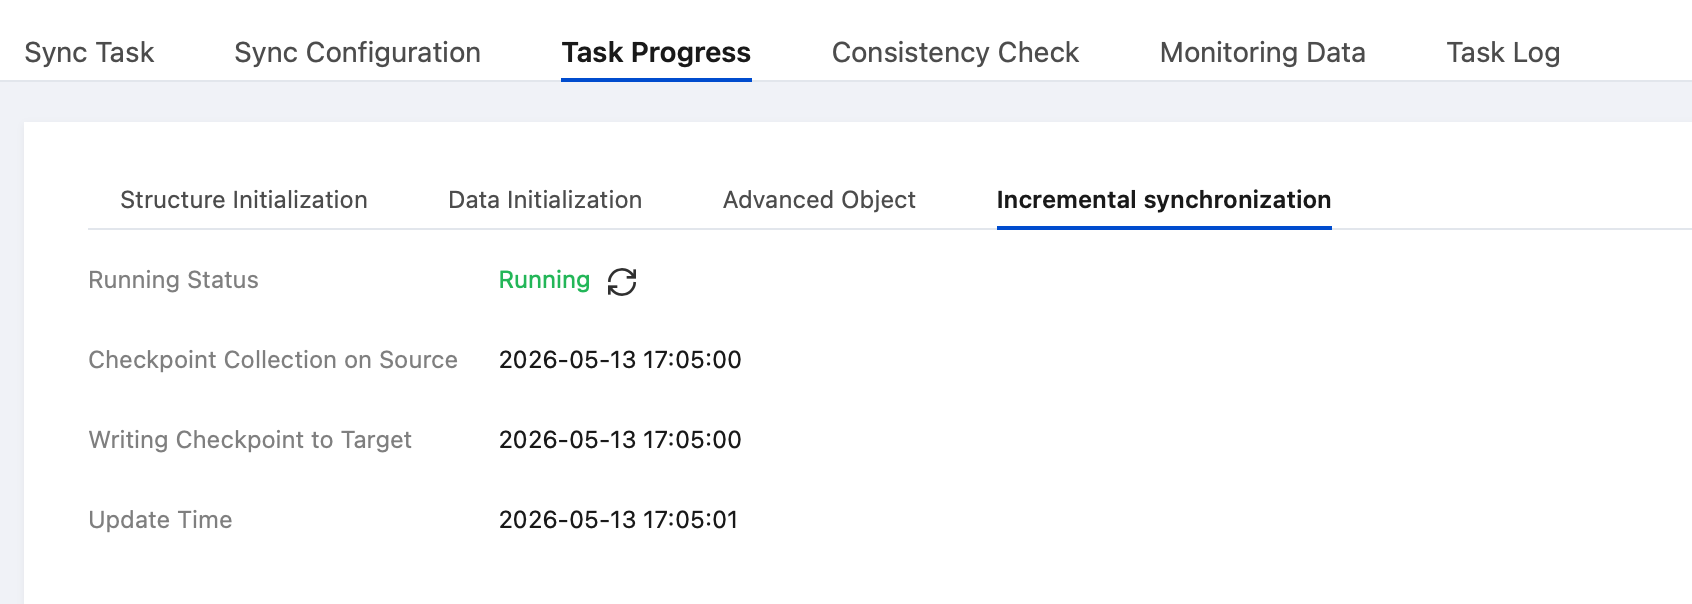
The following content is displayed during the incremental synchronization phase:
The latency in the write checkpoint in the target database refers to the latency between the write checkpoint in the target database and the collection checkpoint in the source database, excluding the latency between the collection checkpoint in the source database and the source database. For example, if the displayed latency here is 30 seconds, and there is an additional 40-second latency between the collection checkpoint in the source database and the source database, the total latency would be 70 seconds.
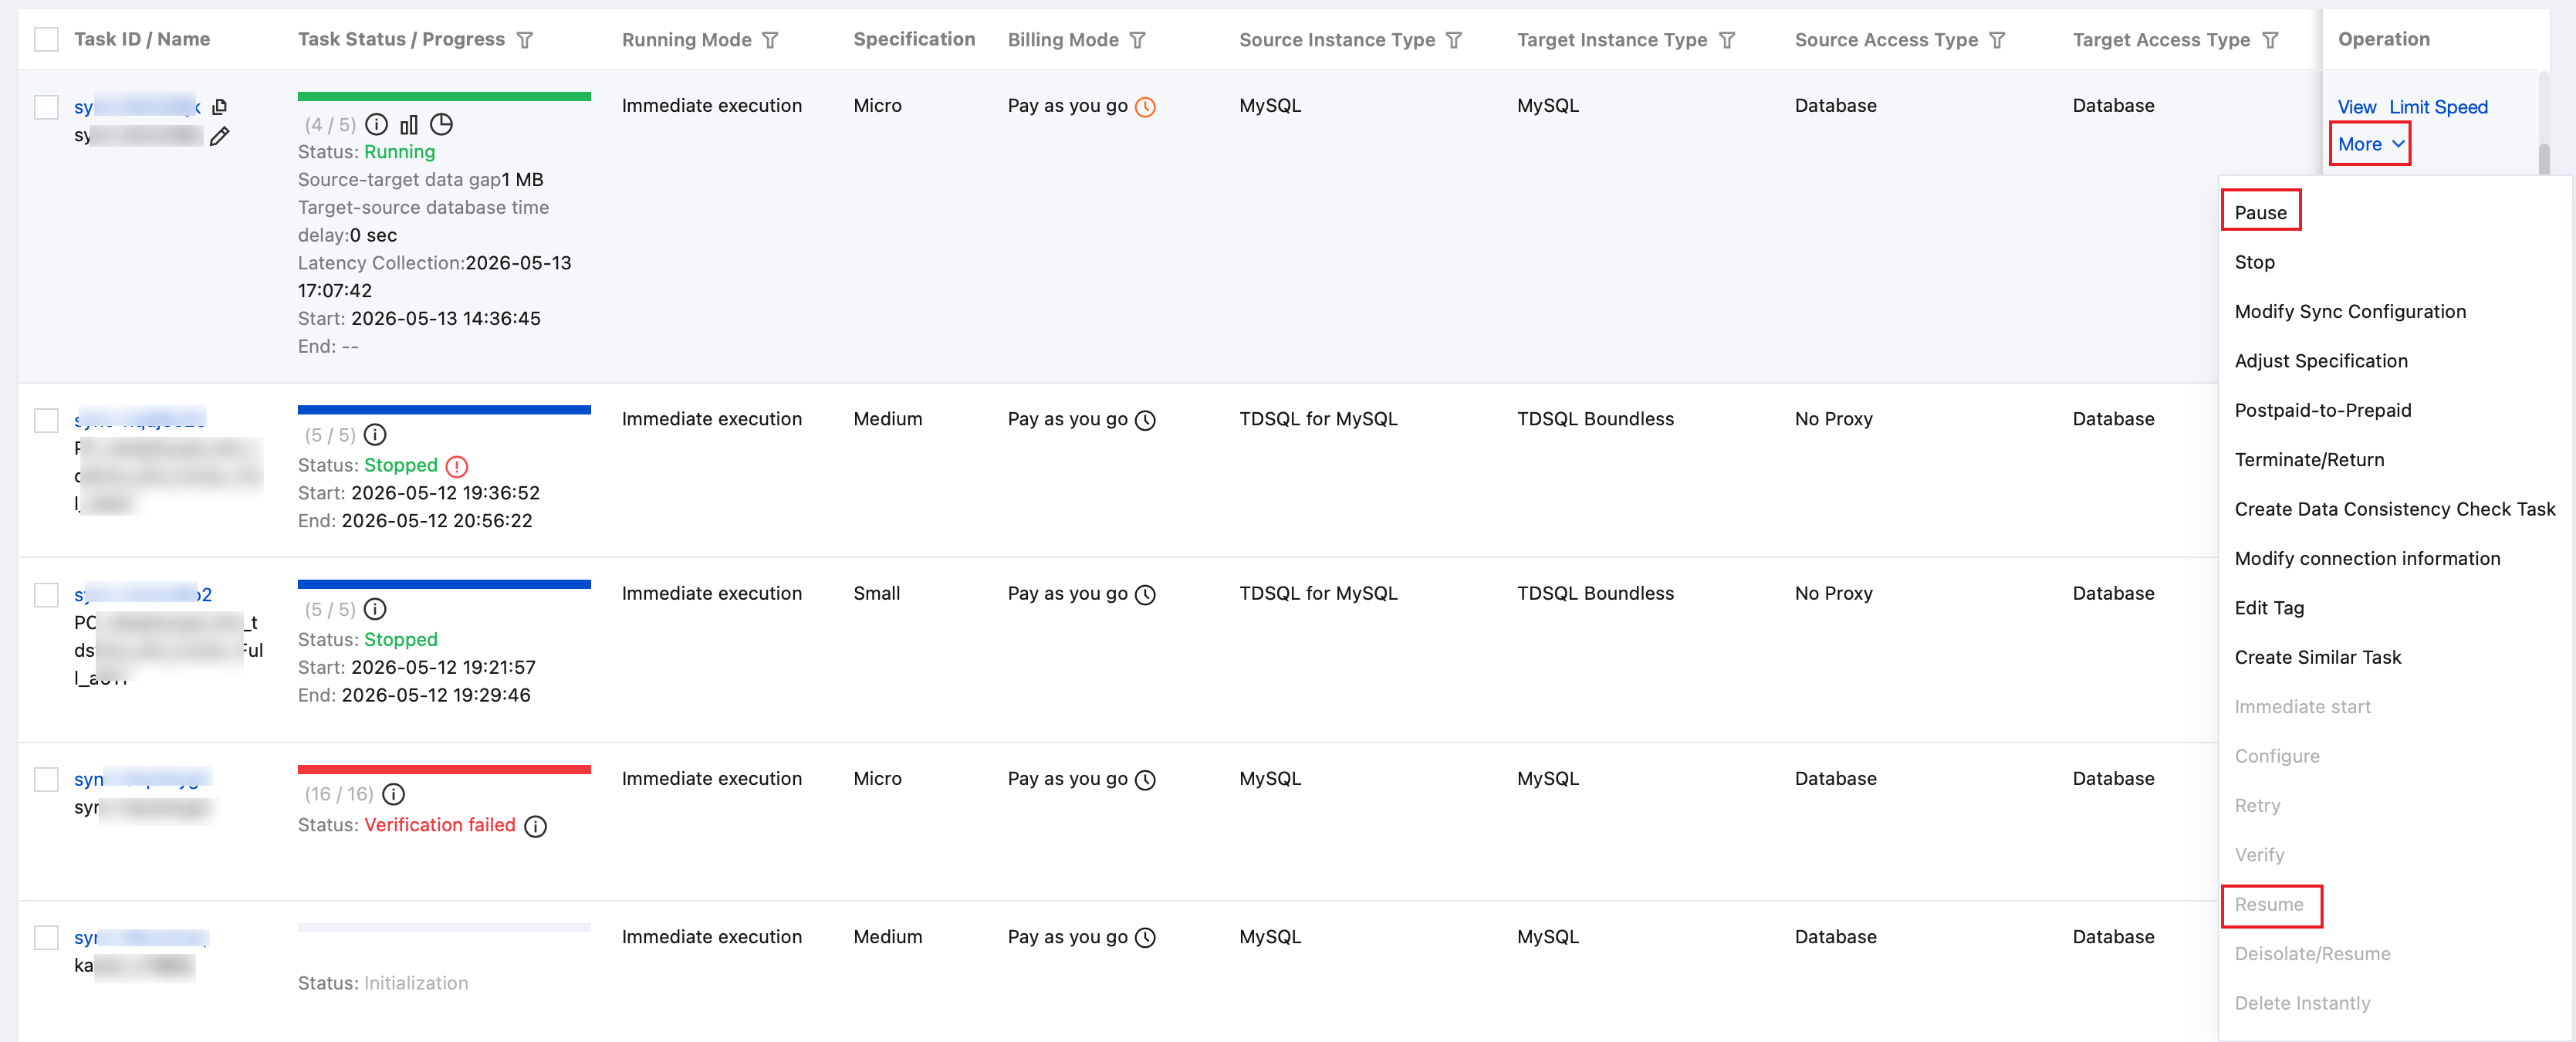
If you do not see checkpoint information on the Incremental Synchronization tab, manually trigger a task restart to display it. In the Operation column, first click Pause. After the task status changes to Paused, click Resume. When the task status changes to Running again, the checkpoint information will be displayed.
4. Advanced objects
Viewing Monitoring Data
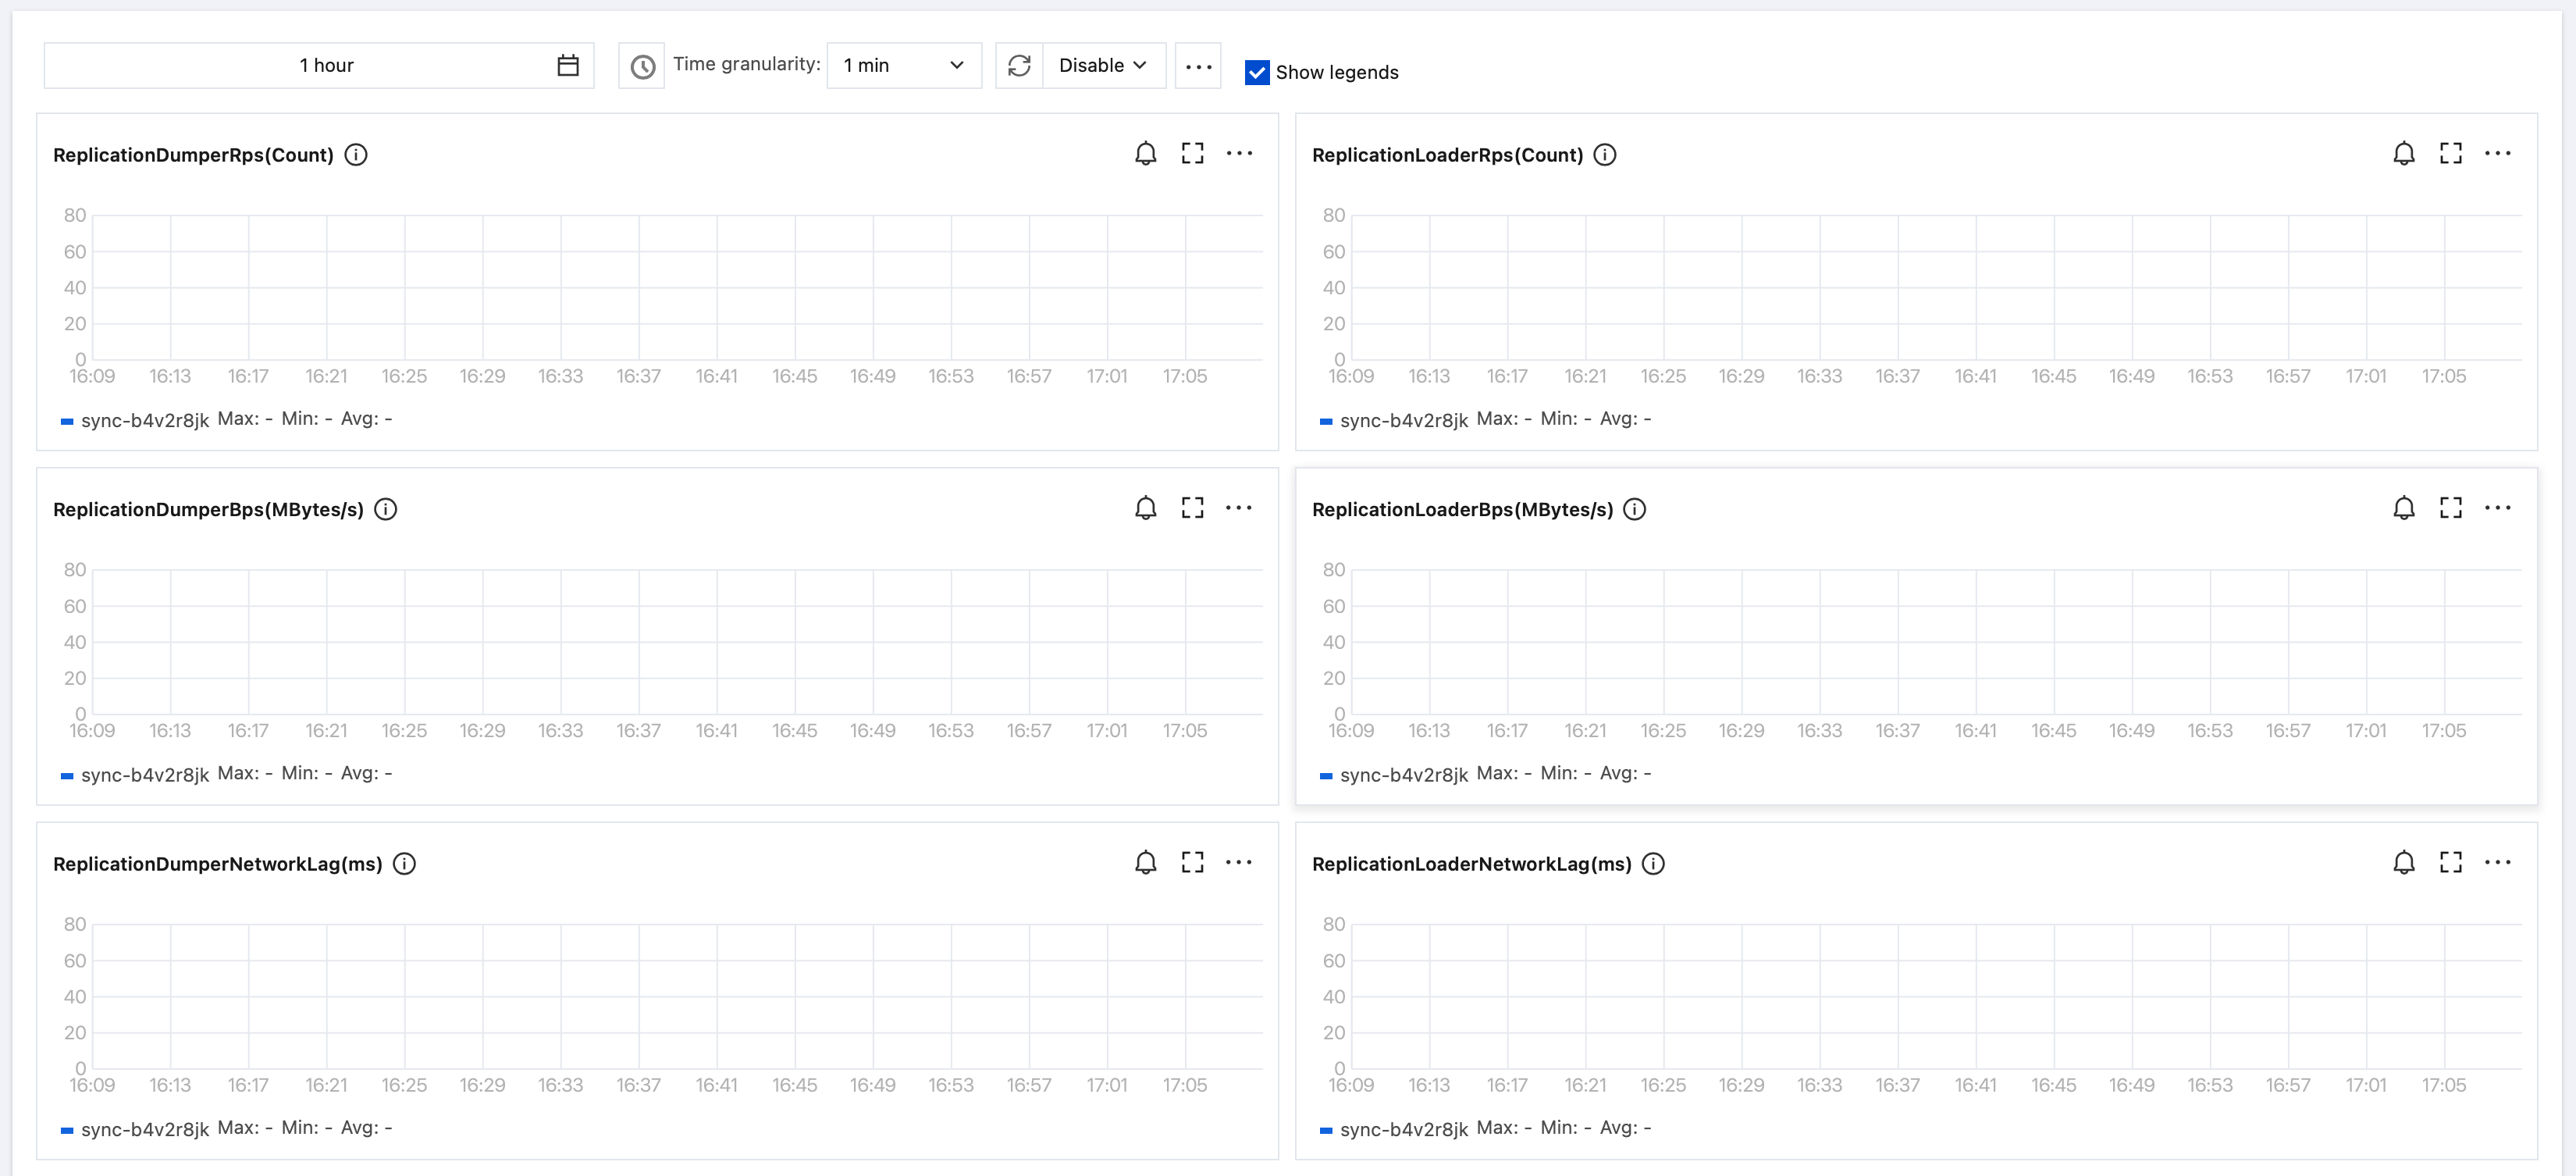
You can view the current synchronization speed, latency, and other metrics of the task. If the latency is excessive, handle it as instructed in Data Synchronization Latency.
Viewing Task Logs
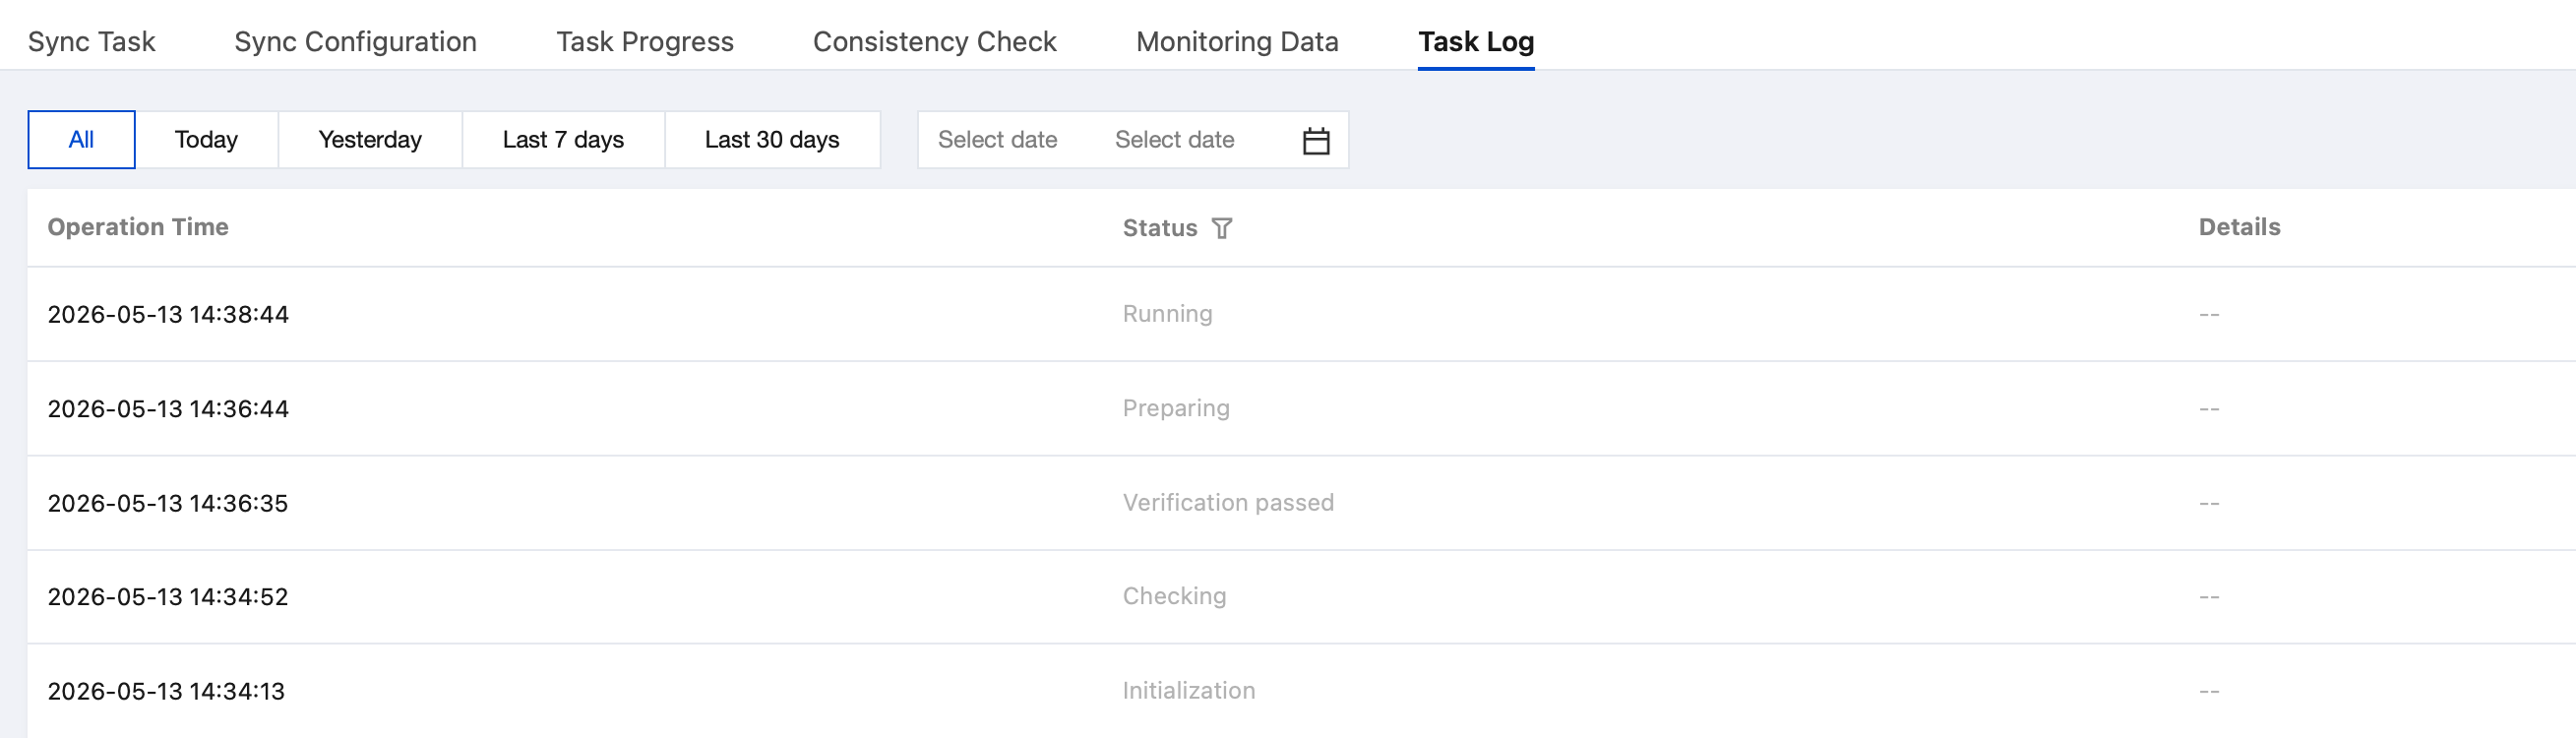
This section supports filtering by specified time range and task status.