Release Notes
Announcements
Parameter | Description |
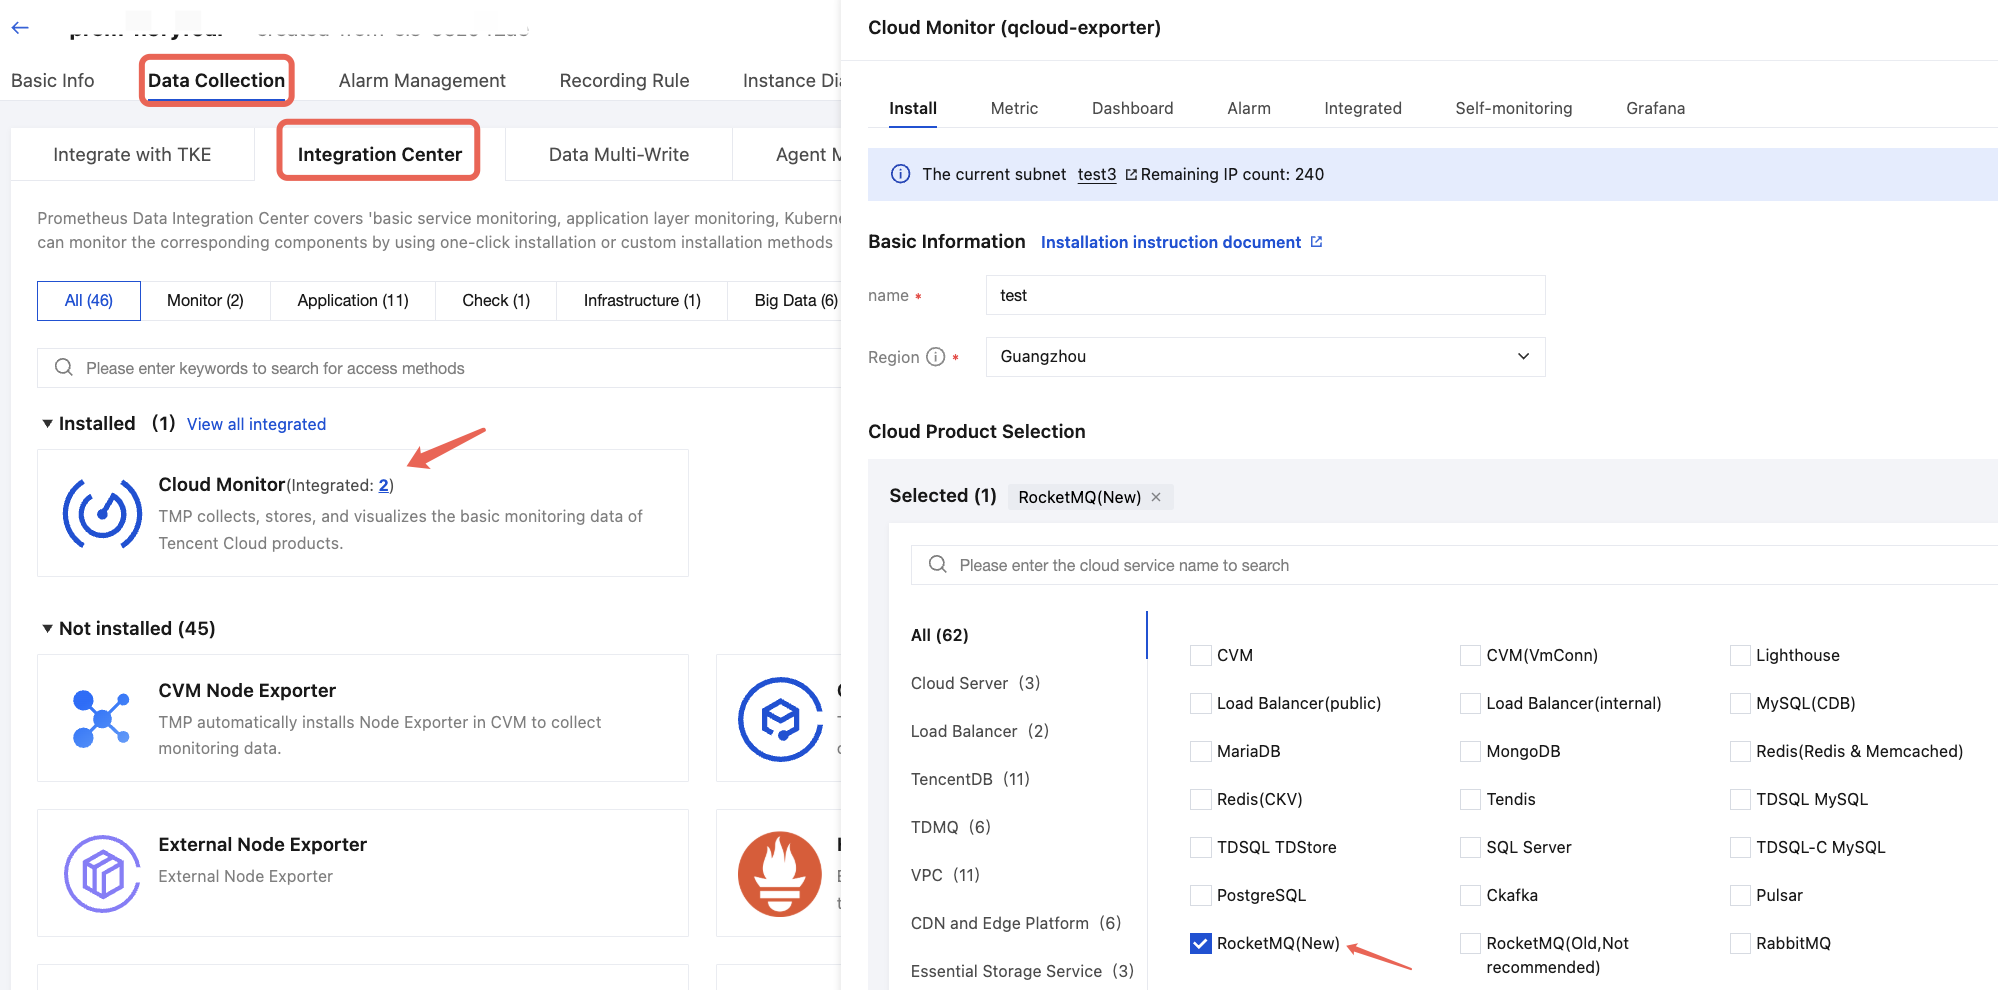
Name | Integration name, which should meet the following naming requirements: The name must be unique. The name should conform to the following regular expression: '^[a-z0-9]([-a-z0-9]*[a-z0-9])?(\\.[a-z0-9]([-a-z0-9]*[a-z0-9])?)*$'. |
Region | Region where the TDMQ for RocketMQ instance to be collected is located. It is required. |
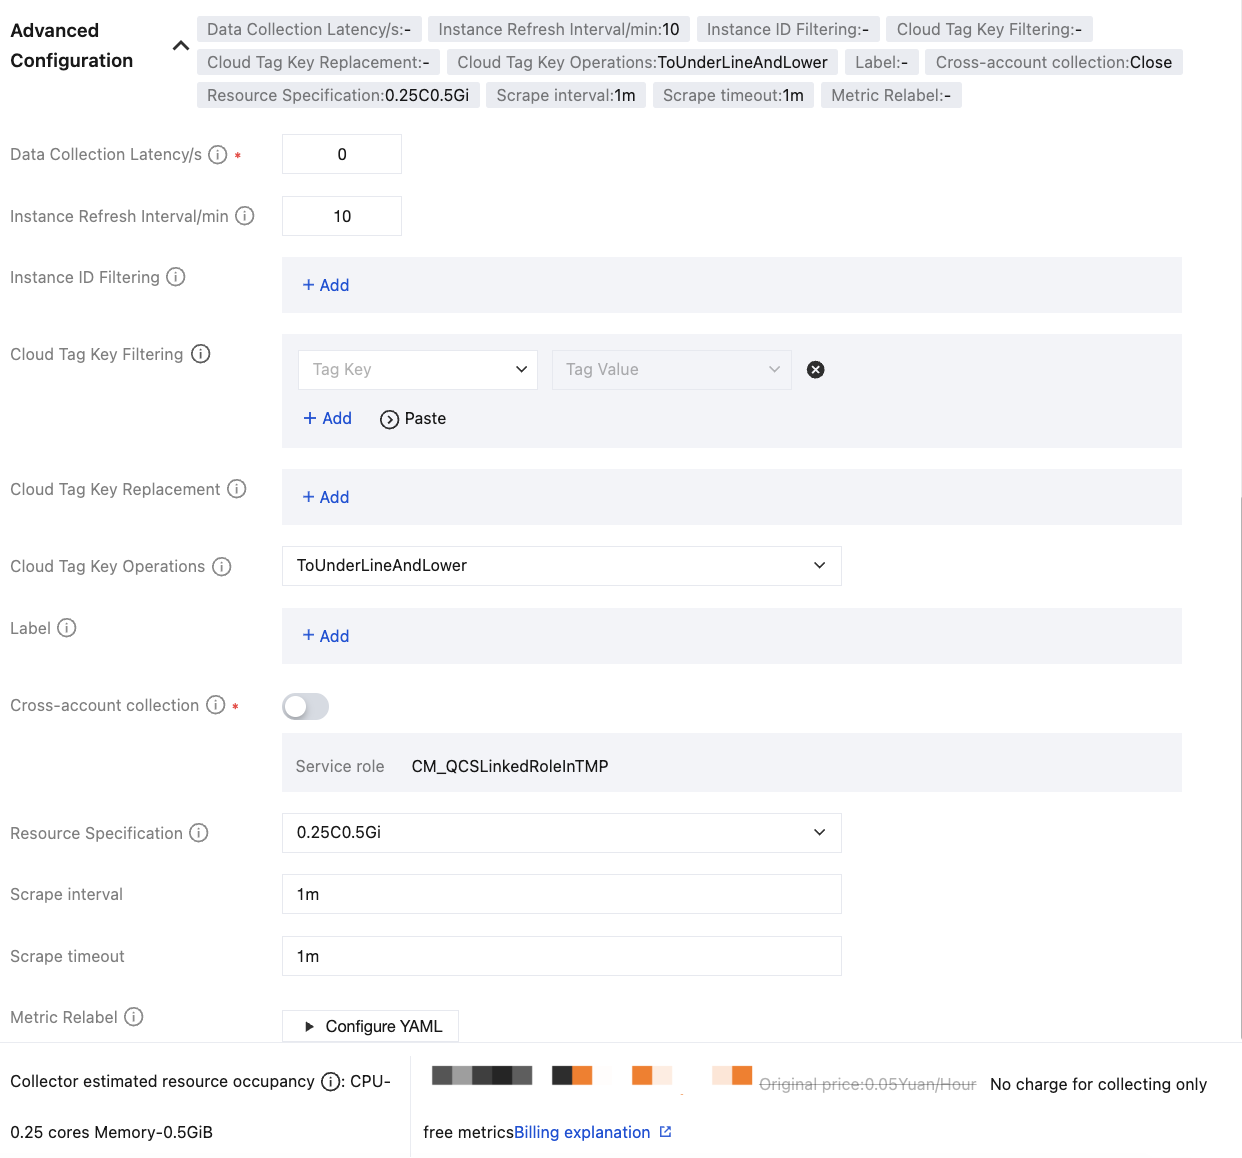
Data Collection Latency/s | The unit is seconds. If it is set to 0, the timestamp of the original data will be ignored. If it is set to a value greater than 0, the timestamp of the original data will be reported. Since there is a certain delay in reporting monitoring data to the Basic Monitoring module, this delay will be reflected in the latest data. Data pulling range: (Current time – Data collection delay – Fixed interval, Current time – Data collection delay) |
Instance Refresh Interval/min | The unit is minutes. The minimum value is 10. At each instance refresh interval, the integration center re-pulls instance information. If the instance name or cloud tag is modified or an instance is added or deleted, the monitoring data is updated within one instance refresh interval. |
Instance ID Filtering | It is optional. If it is left blank, data from all instances under the root account is collected by default. If a key-value pair is specified, only data from the specified instances is selected. When a key-value pair is specified, the key is RocketMQ (New), and the value is the TDMQ for RocketMQ instance IDs you want to monitor, which are separated by commas (,). |
Cloud Tag Key Filtering | It is optional. A key-value pair is specified. One tag key can correspond to multiple tag values, which are separated by vertical bars (|). Take the intersection of different tag keys and take the union of multiple tag values under the same tag key. If instance ID filtering is also configured, cloud tag filtering does not take effect. |
Cloud Tag Key Replacement | It is optional. It is used to replace invalid tag keys with valid values. For example, convert Chinese names to custom English names. |
Cloud Tag Key Operations | By default, the integration module converts uppercase letters in tag keys into underscores followed by lowercase letters. Supported tag key conversion operations are as follows: ToUnderLineAndLower: default operation. ToLower: indicates converting all letters to lowercase. NoOperation: indicates that no conversion is performed. |
Label | It is optional. You can add additional custom tags to the metrics collected by the integration module. |
Cross-account collection | Current account role: custom role, used to obtain the temporary key for the current account. Target account role: custom role, used to obtain the temporary key for the target account. Target account UIN: root account ID of the target account. |
Metric Relabel | It is optional. It is the native metricRelabelings configuration for Prometheus Operator. The configuration method is the same as metric_relabel_configs in TMP scrapping configuration, with only different naming conventions for certain fields. |
Apakah halaman ini membantu?
Anda juga dapat Menghubungi Penjualan atau Mengirimkan Tiket untuk meminta bantuan.
masukan