Scenarios
TDMQ for RabbitMQ clusters currently provide Prometheus Exporter to collect metric information from nodes, including but not limited to basic monitoring metrics such as queues, channels, and connections, as well as metrics exposed by Broker JMX. Prometheus aggregates, visualizes, and analyzes all relevant metrics.
Constraints and Limitations
Only Managed Edition clusters support Prometheus for monitoring.
Operation Steps
Step 1: Obtaining Prometheus Monitoring Objects
2. In the left sidebar, choose Cluster, select a region, and click the ID of the target cluster to go to the basic cluster information page.
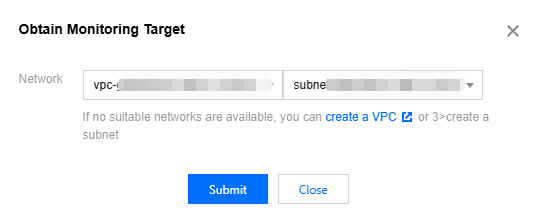
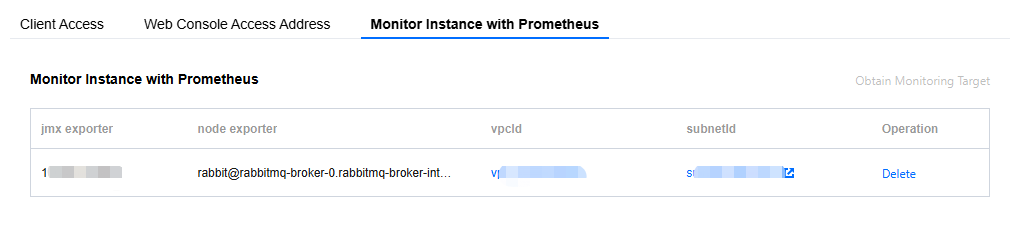
3. In the Monitoring Instance with Prometheus section, click Obtain Monitoring Targets in the upper right corner, and select a Virtual Private Cloud (VPC) network and subnet.
4. Click Submit
to obtain a group of monitoring objects. Step 2: Collecting Monitoring Data Using Prometheus
Note:
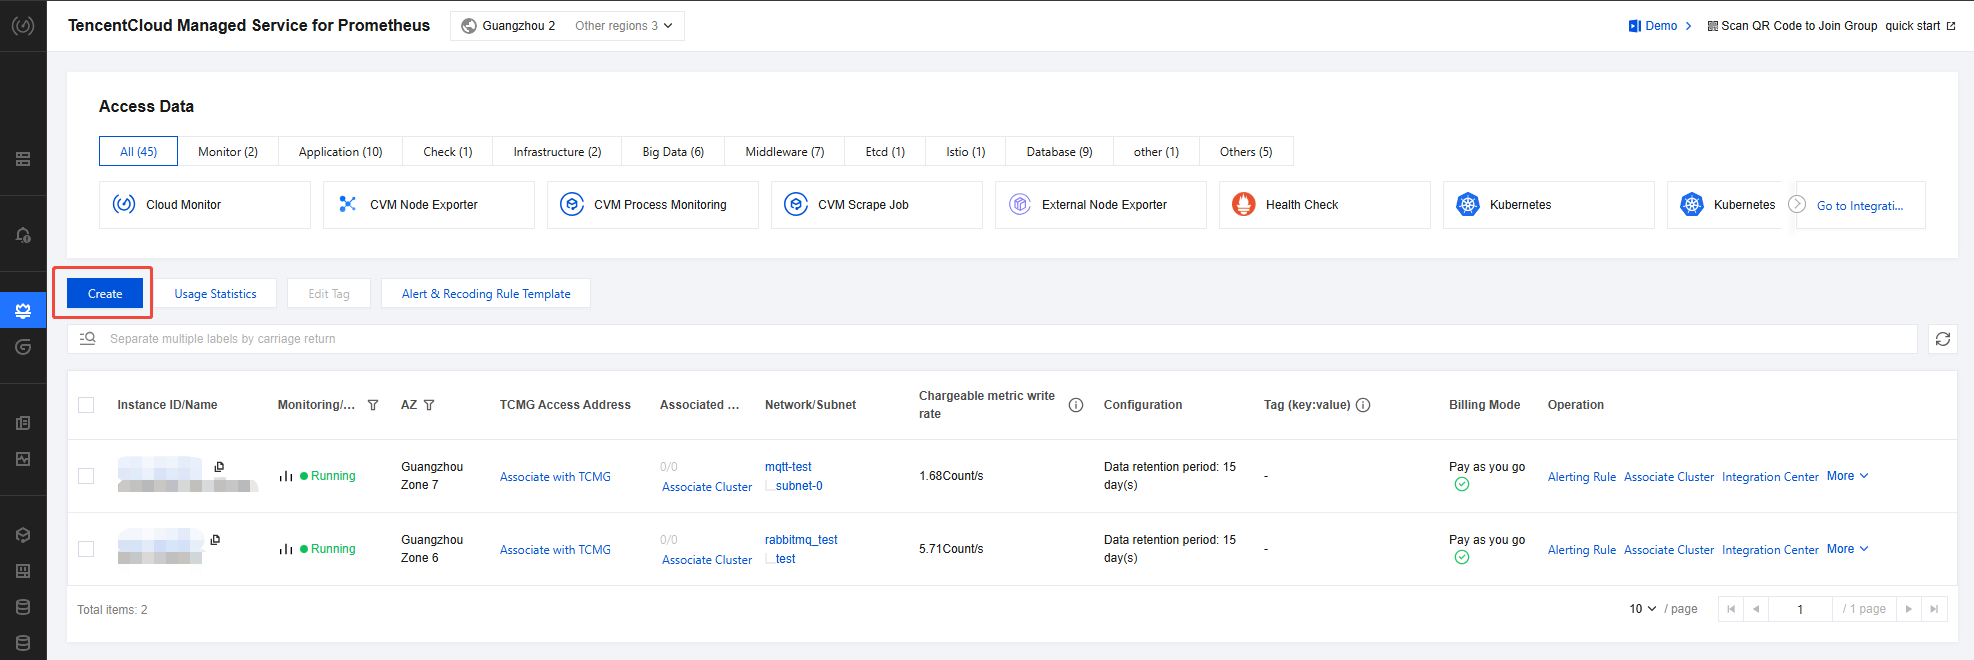
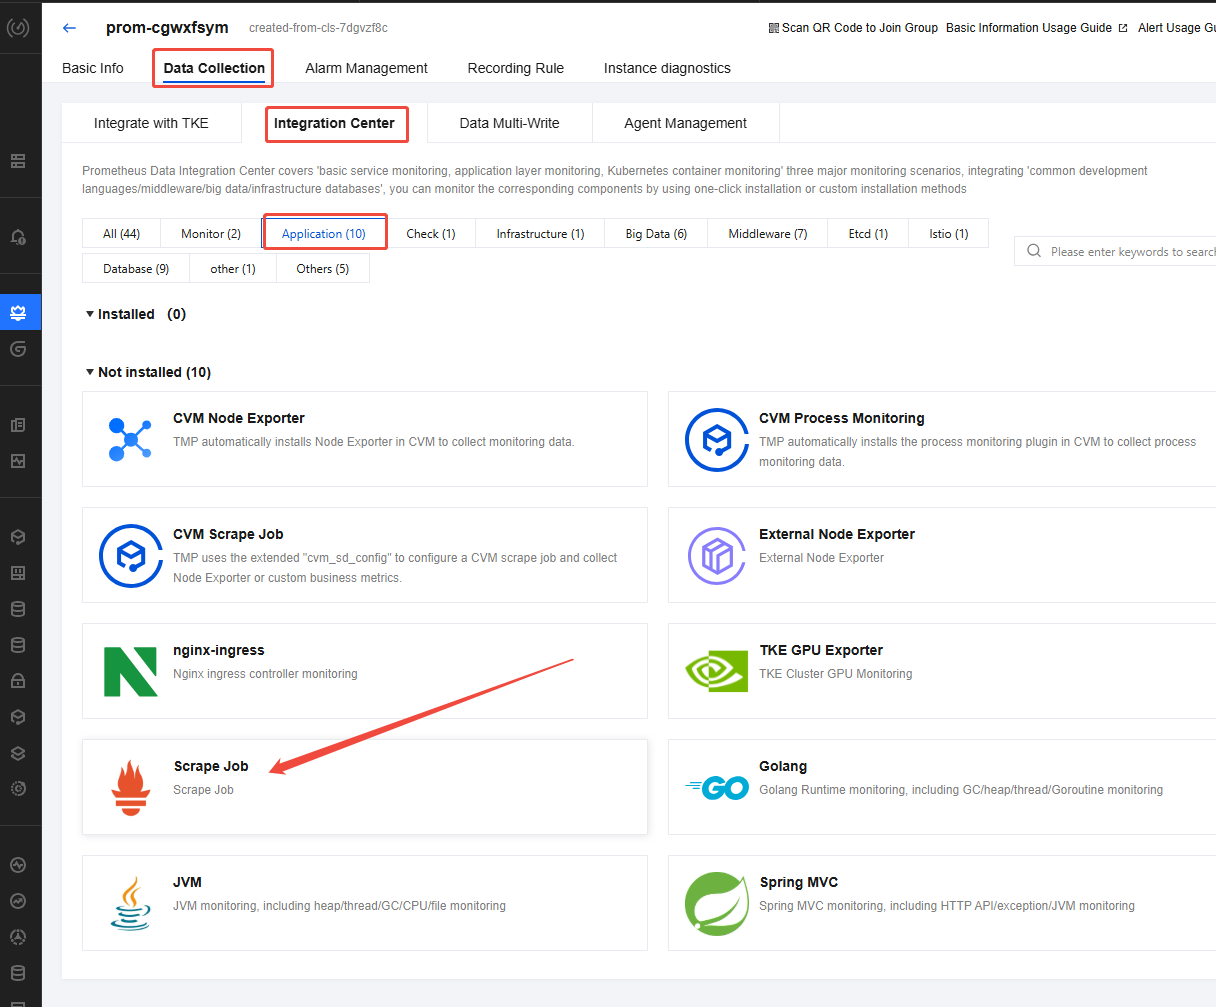
When you create a Prometheus instance, the bound VPC and subnet must be consistent with the vpcId and subnetId specified in Step 1-4. Otherwise, network connectivity issues may occur. 2. In the instance list, click a Prometheus instance to go to the instance details page. Choose Data Collection > Integration Center, click Application, and find and click Scrape Job.
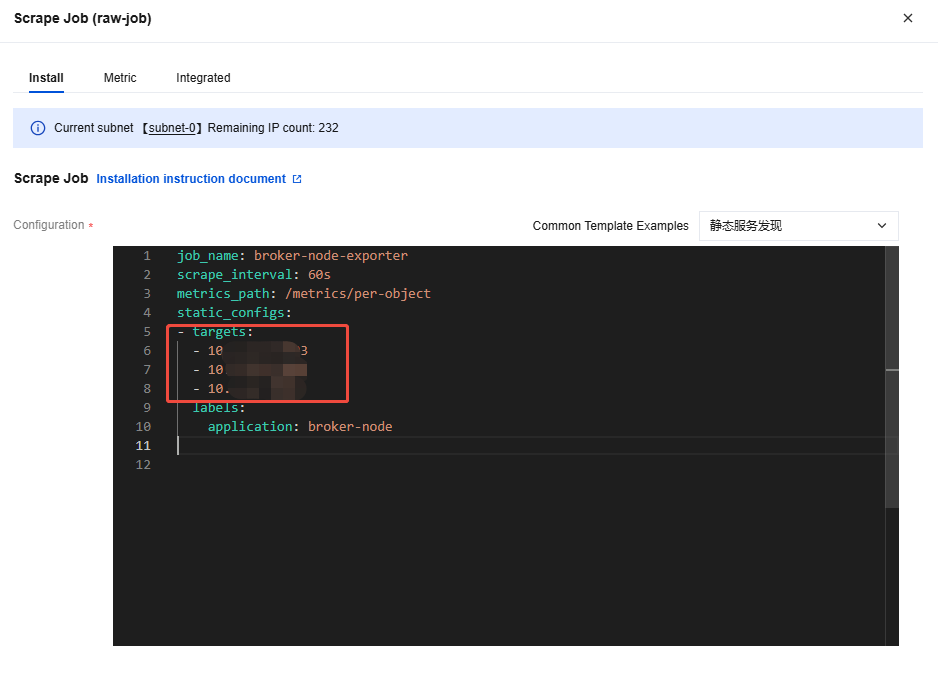
3. In the pop-up scrape task drawer, specify the collection configuration as shown in the sample code below, and click Save.
job_name: broker-node-exporter
scrape_interval: 60s
metrics_path: /metrics/per-object
static_configs:
- targets:
- 10.x.x.x:7003
- 10.x.x.x:7002
- 10.x.x.x:7001
labels:
application: broker-node
job_name: Enter broker-node-exporter.
scrape_interval: Specify the collection interval.
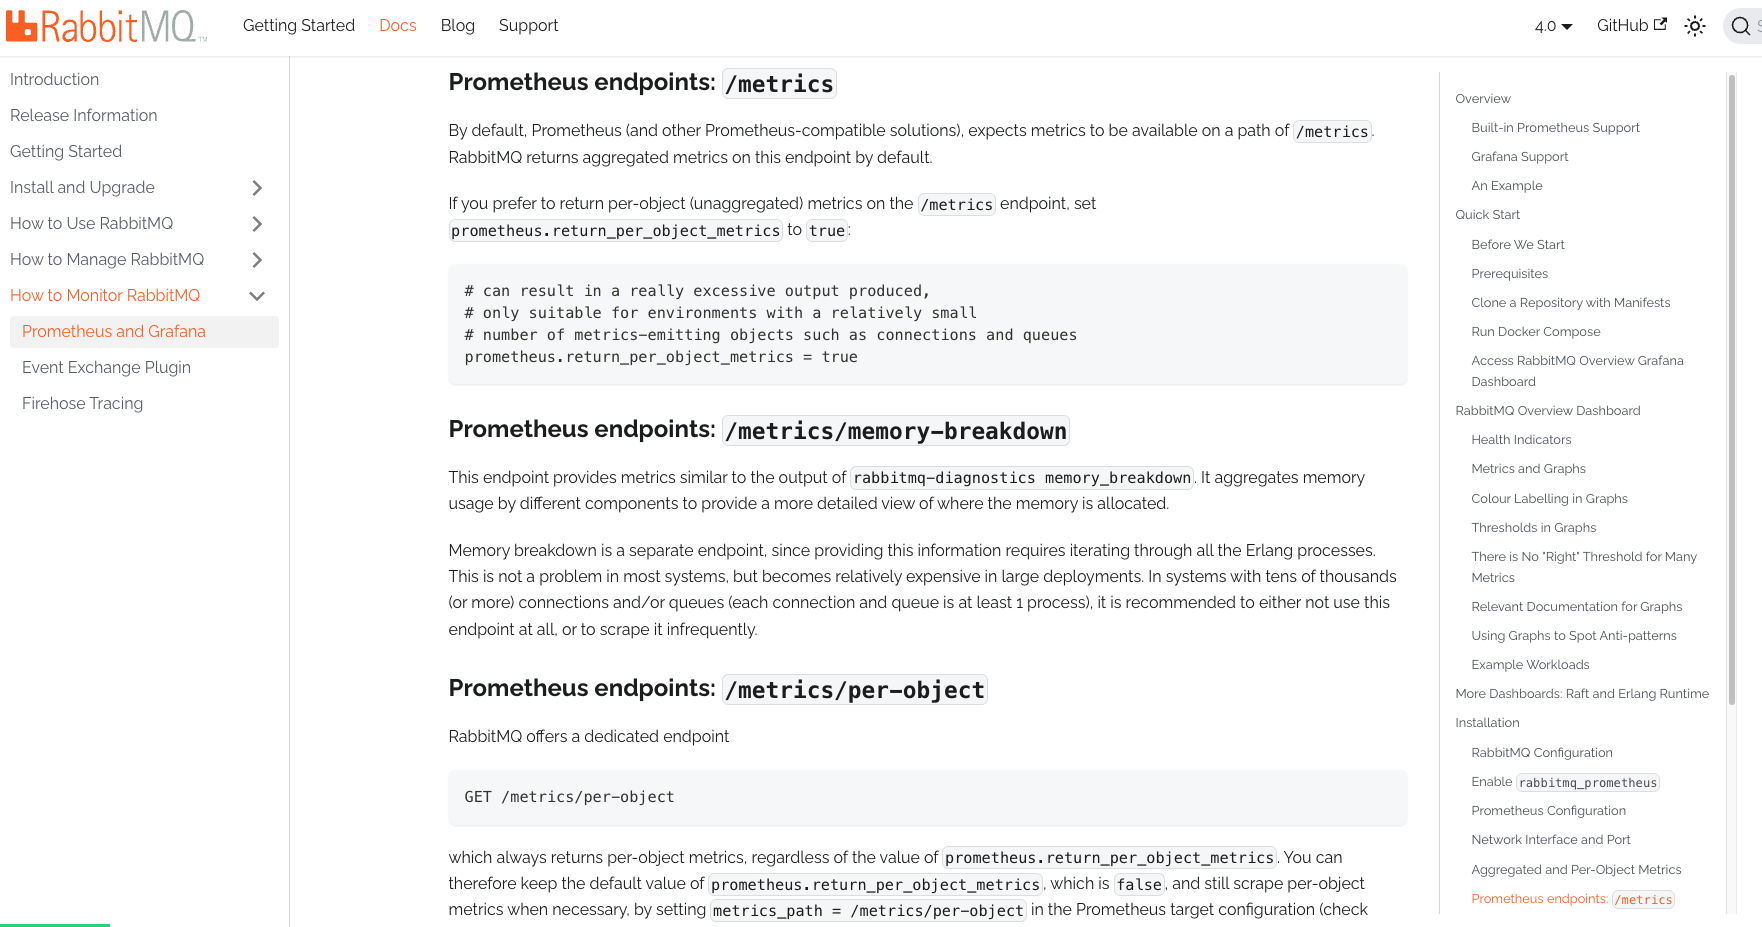
metrics_path:
/metrics indicates that only metrics in the cluster dimension are obtained.
/metrics/per-object indicates that all metrics are obtained.
targets: Enter jmx exporter in Step 1-4. application: Enter broker-node.
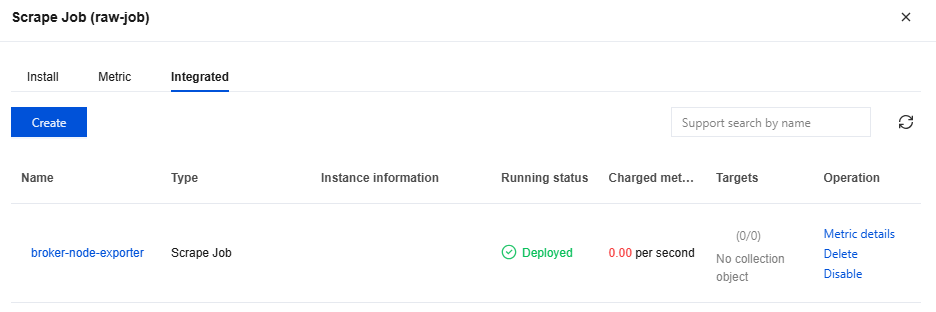
4. On the scrape task page, click the Integrated tab. Wait for 2 to 3 minutes, and you will see the running status change to Deployed. In the Targets column, you can also view specific data scraping objects. Click Metric details to see the scraped RabbitMQ broker metrics.
Step 3: Viewing Monitoring Data Using Grafana
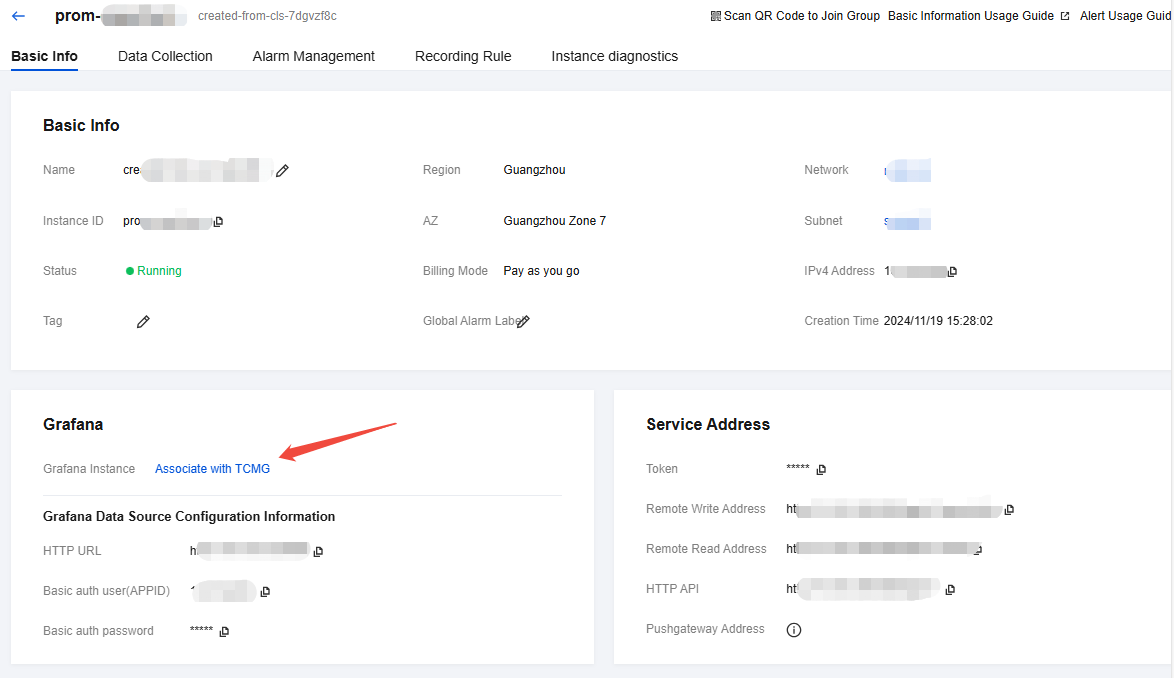
1. Return to the Prometheus instance details > Basic Info page, bind a Grafana instance in the Grafana card. If no Grafana instance exists, create one first. For the creation guide, see TencentCloud Managed Service for Grafana. Note:
The VPC network and subnet of the bound or newly created Grafana instance must be consistent with the vpcId and subnetId specified in Steps 1-4; otherwise, network connectivity issues may occur.
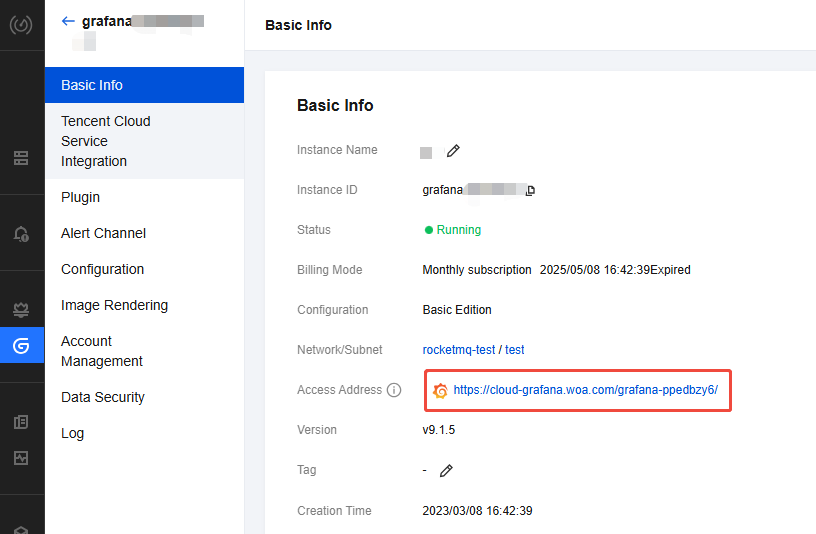
2. After the Grafana instance is bound, click Grafana Instance to go to the instance details page, and then click Access Address in Basic Information to redirect to the Grafana console.
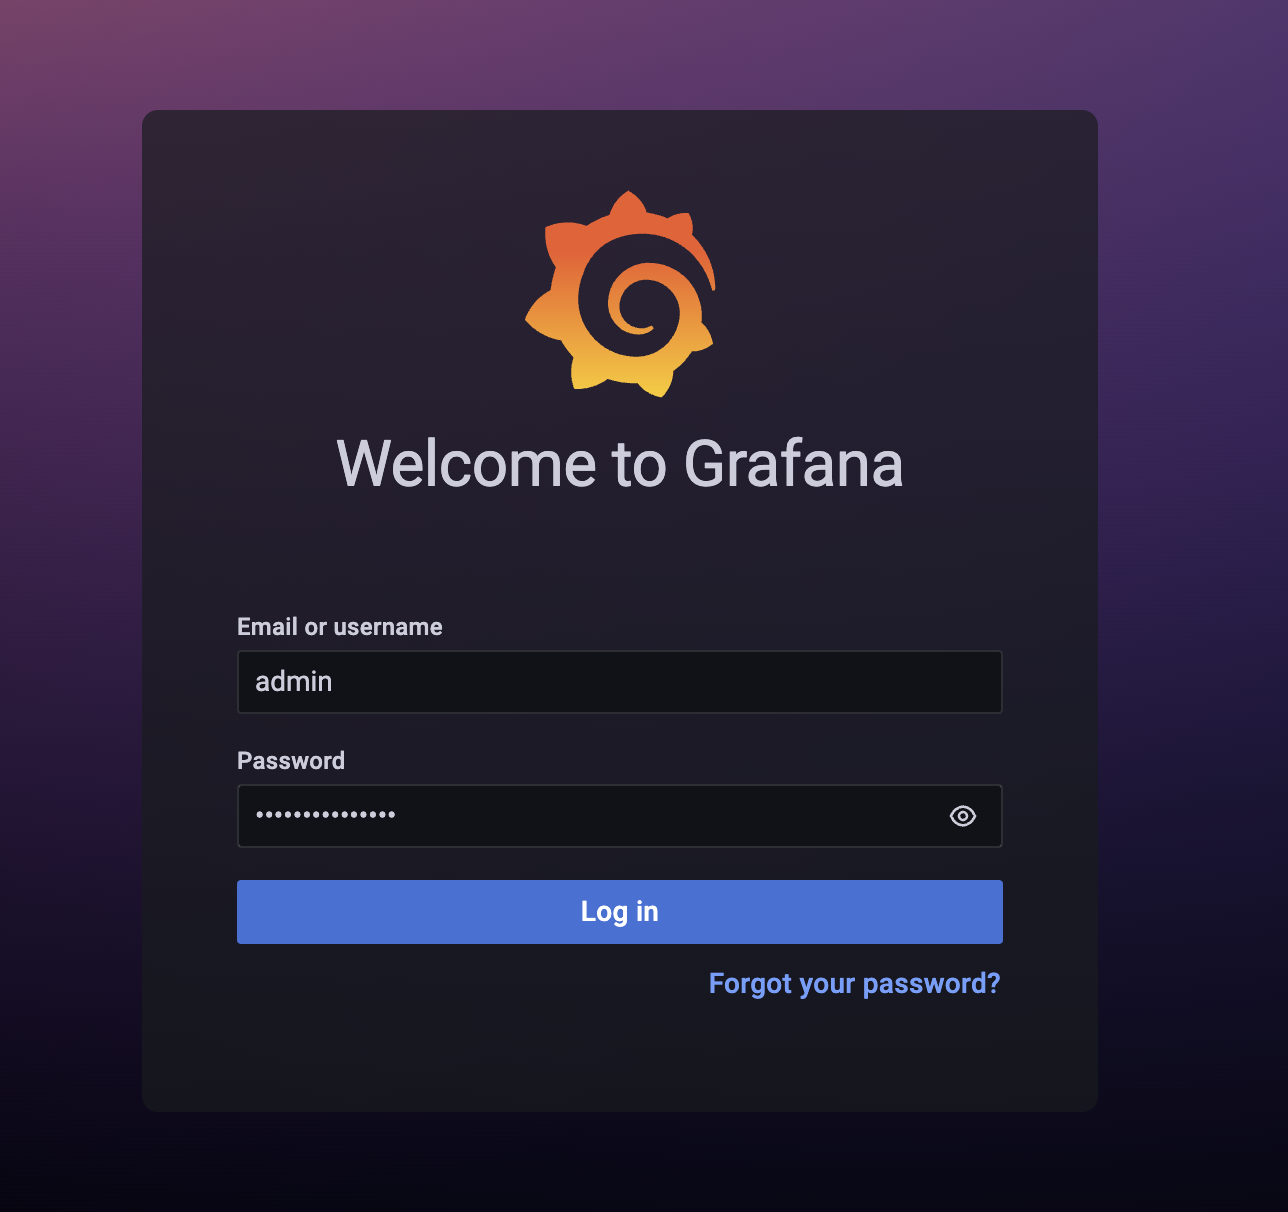
3. Enter the Grafana username (admin by default) and password, and then log in to the Grafana console.
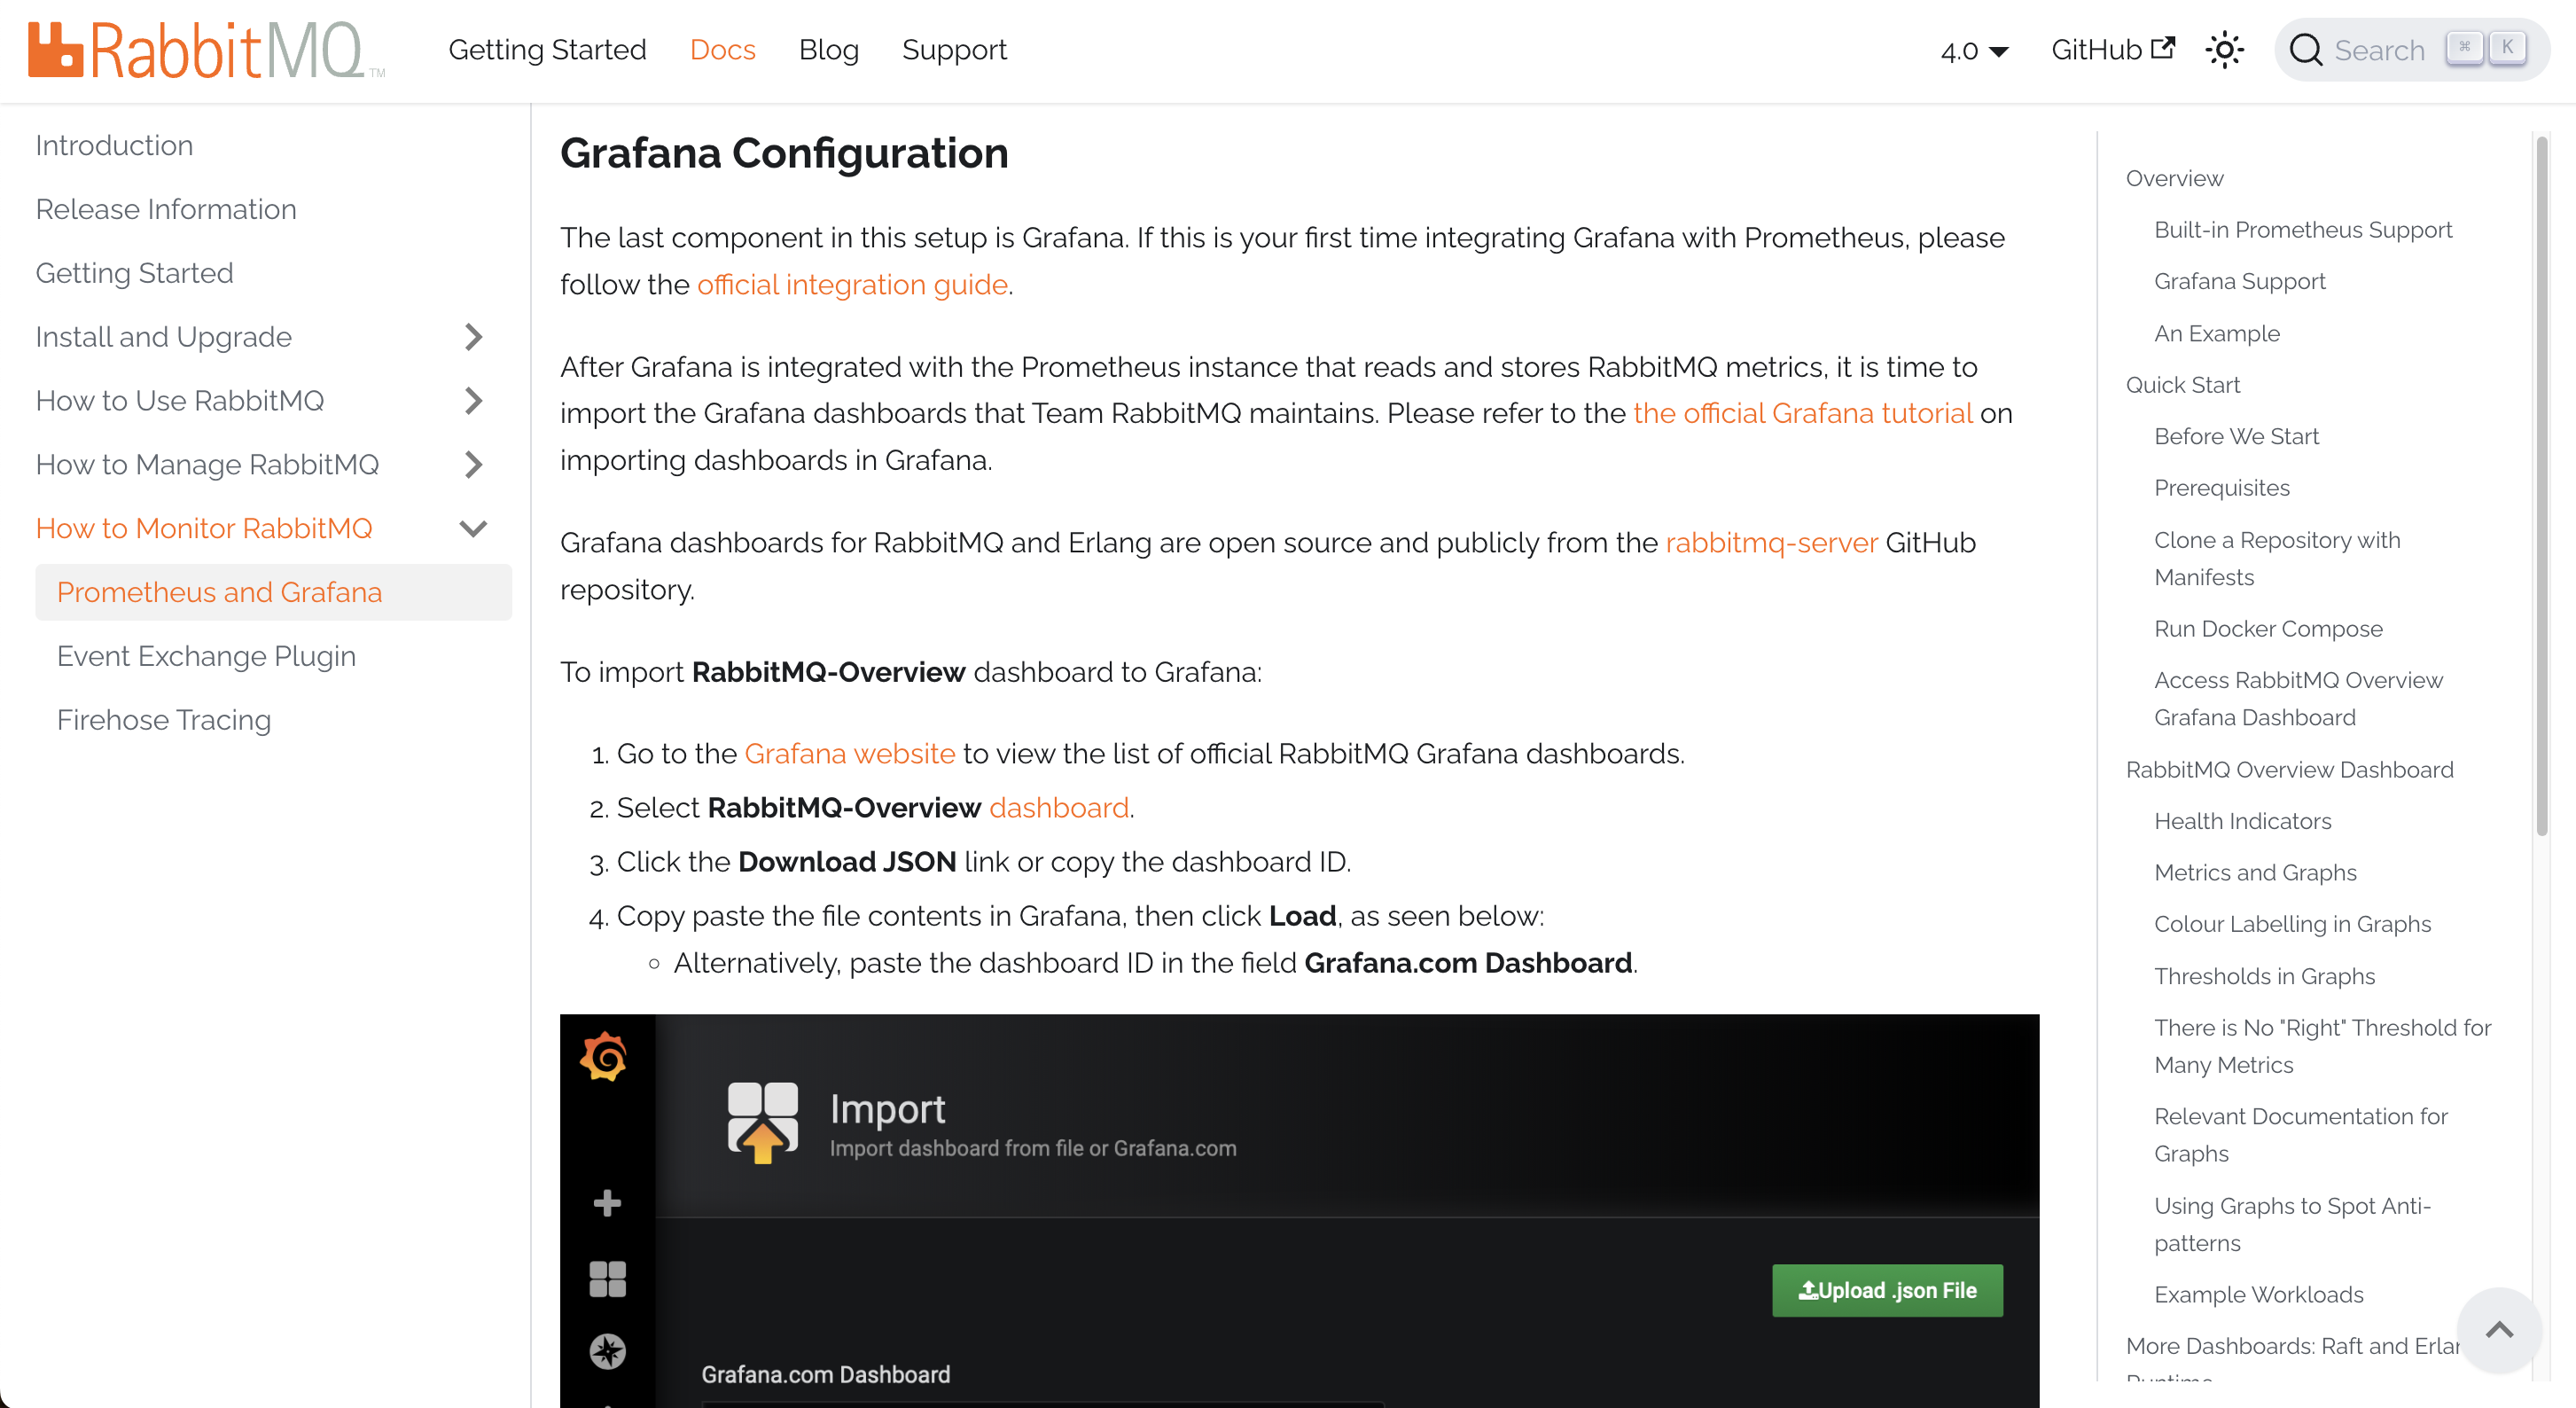
4. For the Grafana configuration steps, see
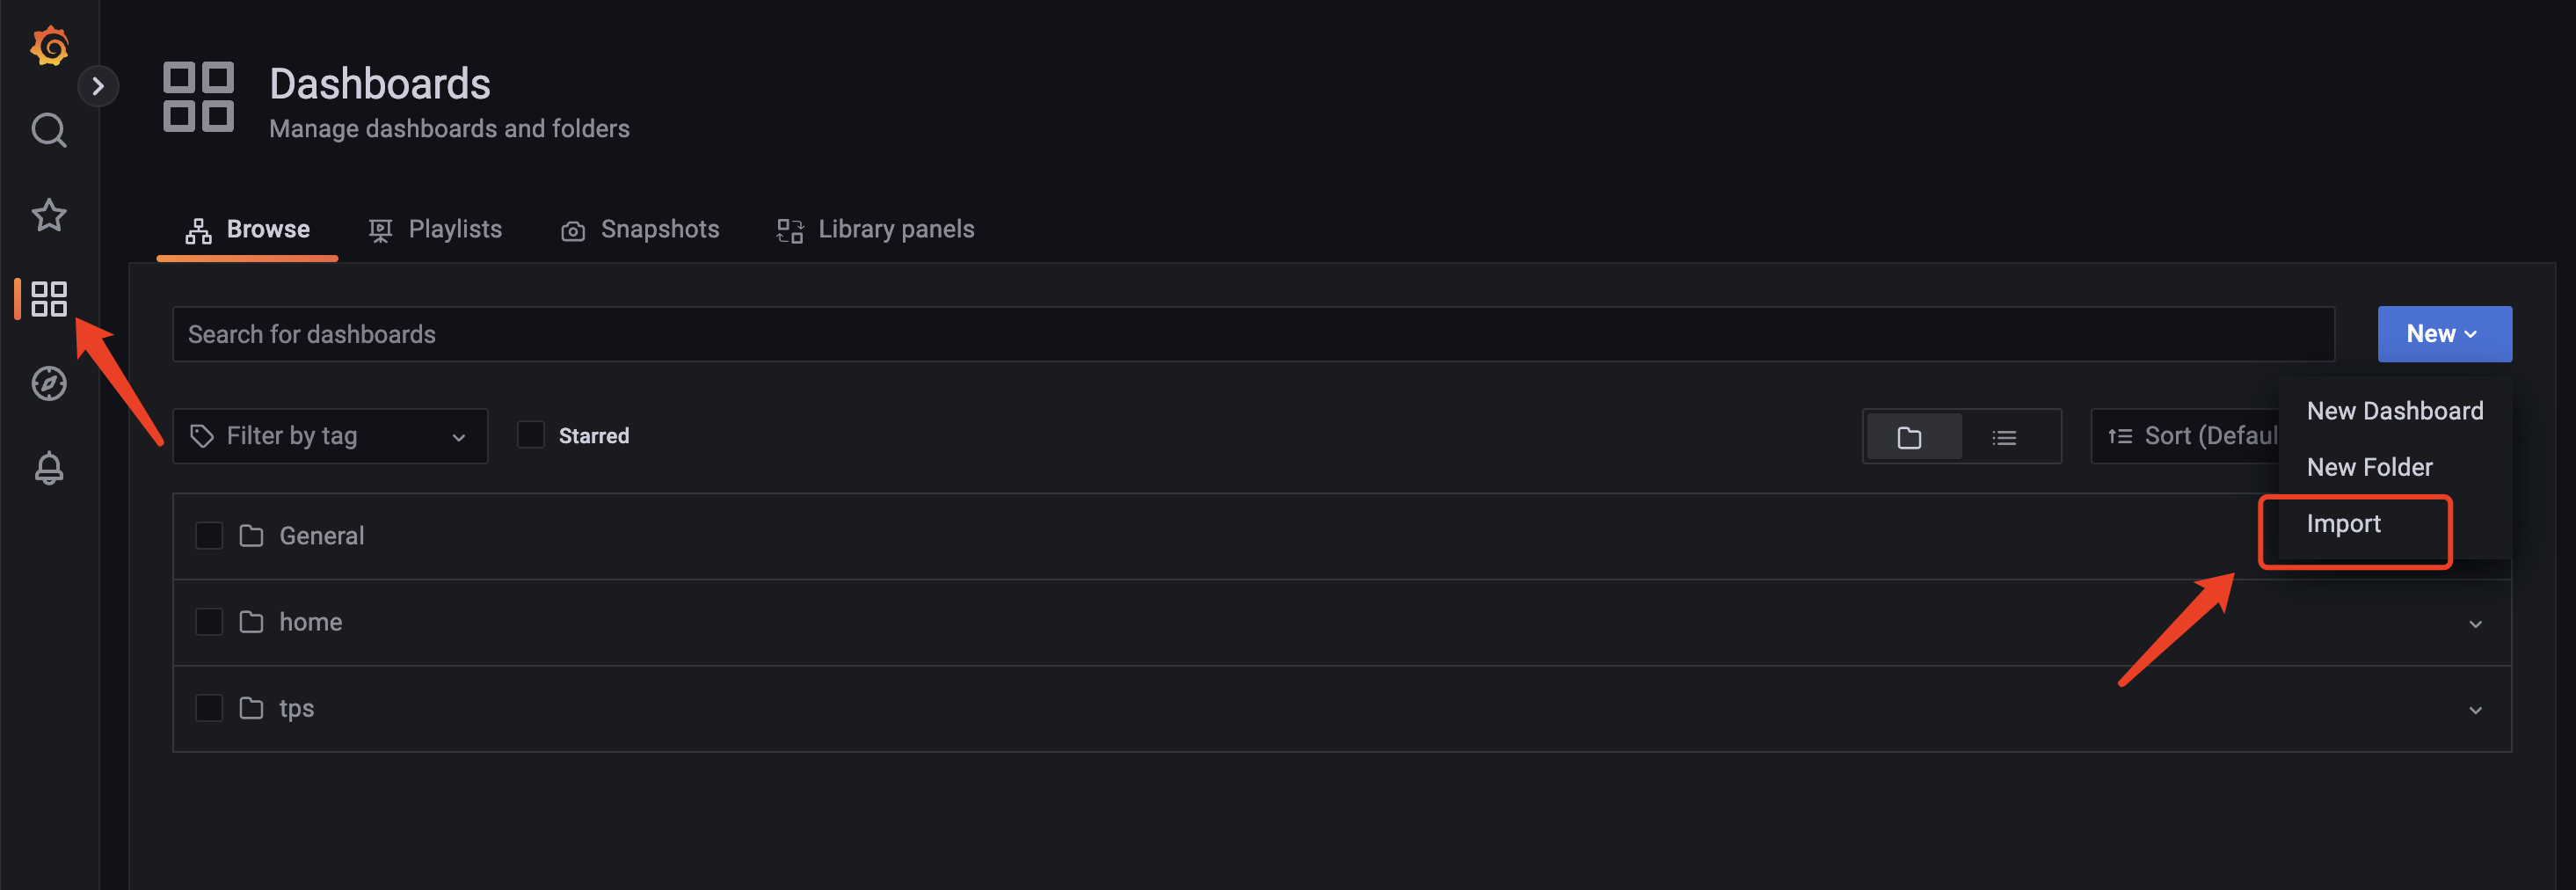
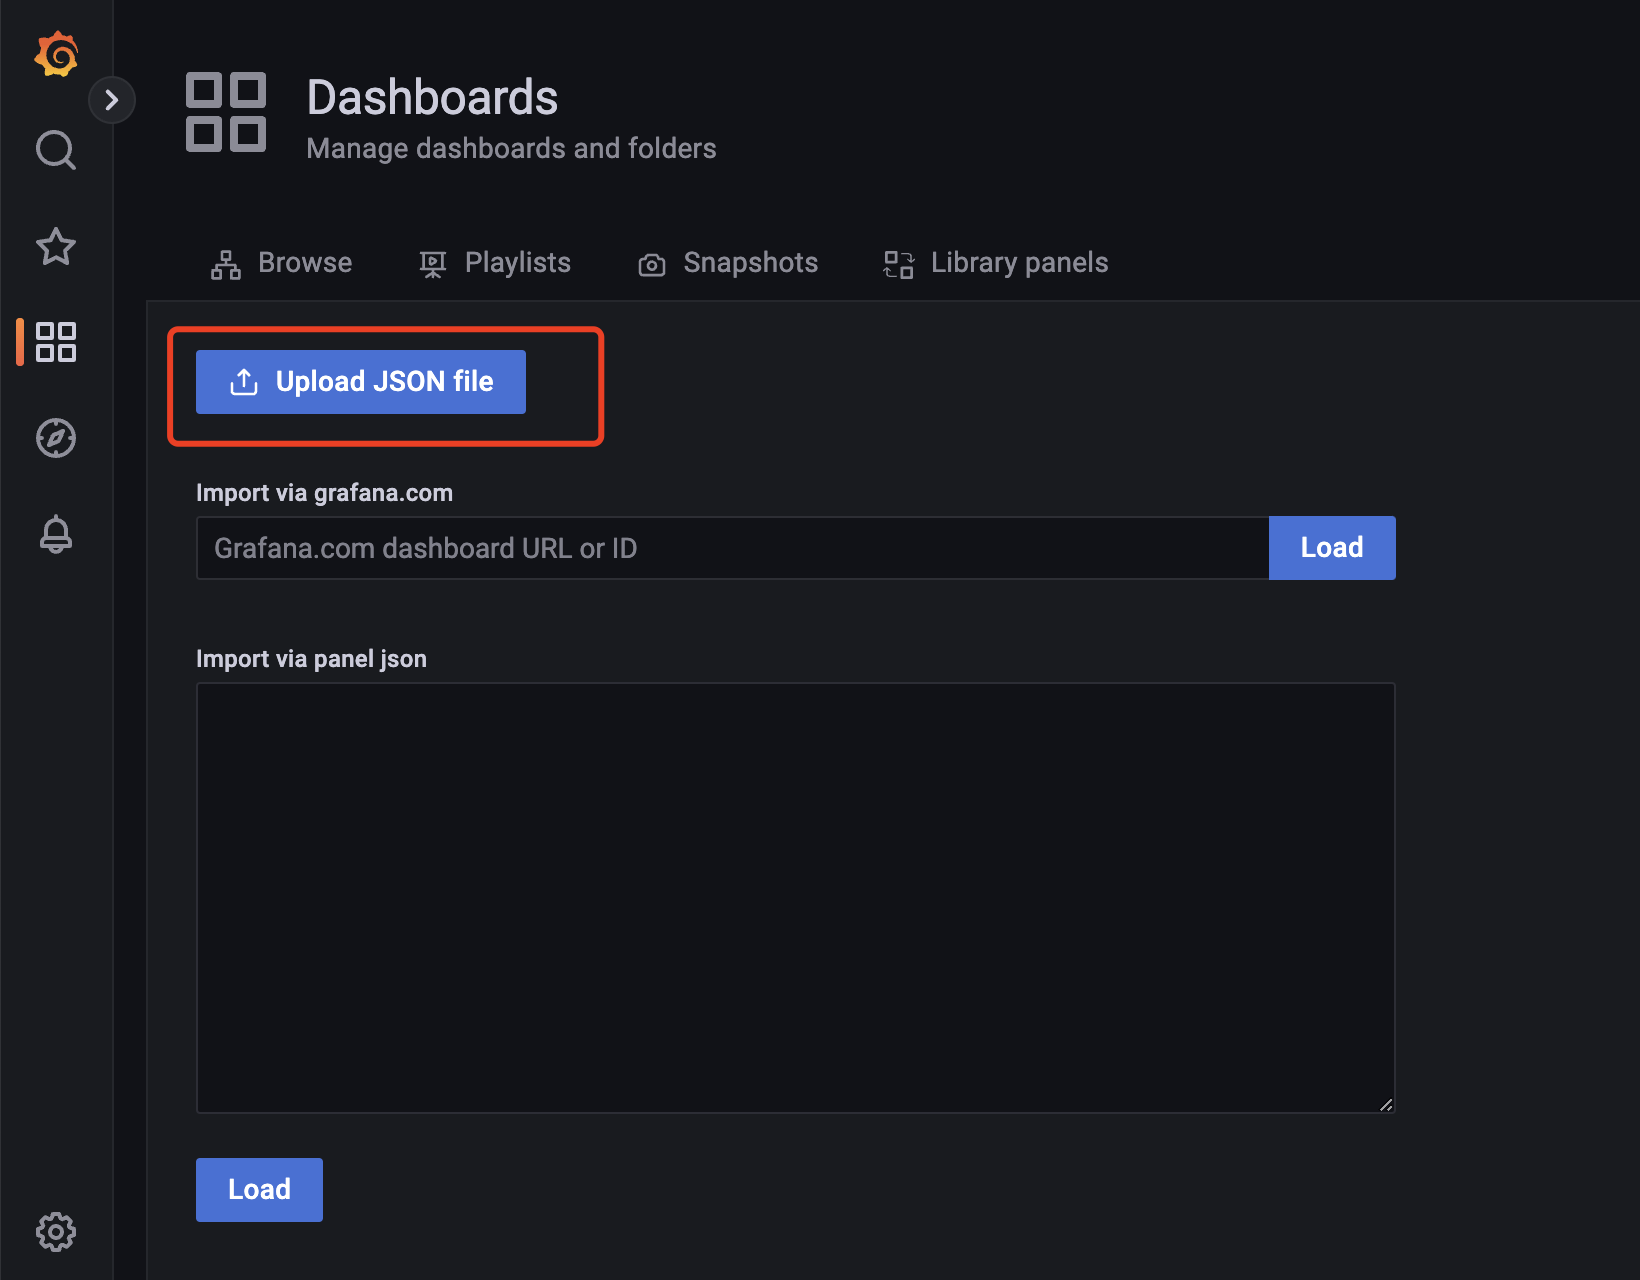
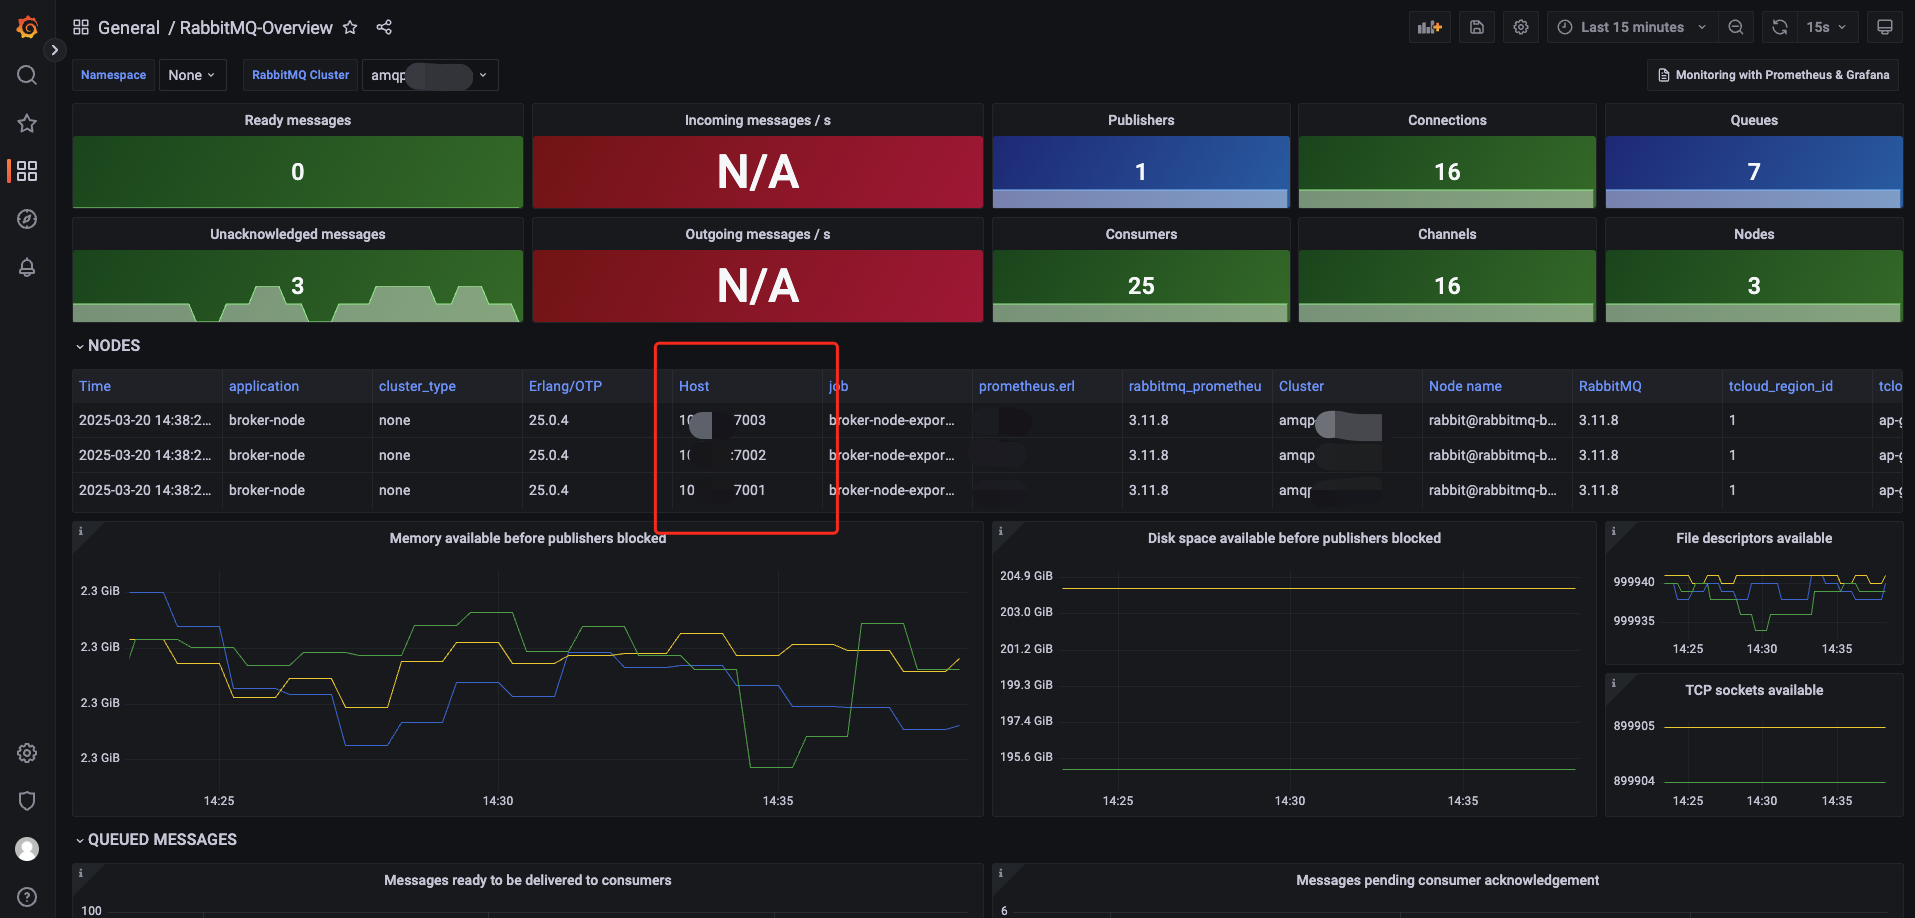
Grafana Configuration in the official documentation of open-source RabbitMQ. Download the JSON file for the RabbitMQ-Overview dashboard or copy the dashboard ID. 5. Return to the logged-in Grafana console, click Dashboards in the left sidebar, and choose New > Import on the right. Then upload the JSON file downloaded in Steps 4 to the corresponding Grafana instance. 6. After the upload, you can view all the configured monitoring metric data. Confirm that Host is the monitoring object jmx exporter in the TDMQ for RabbitMQ console.