The SQL analysis page aggregates SQL template analysis, providing a global sorting of SQL templates based on their impact on various performance metrics within a specified period. It also enables real-time access to detailed SQL information within each template, helping users understand statistical data, data distribution, and outliers for better data comprehension and informed decision-making.
Note:
SQL analysis is supported only for MySQL, TDSQL-C for MySQL, MariaDB, and TDSQL MySQL instances.
Prerequisites
The full-link analysis feature has been enabled for the instances. For detailed instructions, see Enabling End-to-End Analysis.
Viewing SQL Performance Trend Chart and SQL Template List
2. In the left sidebar, choose Full-link analysis > SQL Analysis.
3. At the top of the page, select the database type, then select node ID, instance ID, or cluster ID.
4. At the top of the page, select a time range, including the last 1 minute, last 1 hour, last 1 day, or a custom time range.
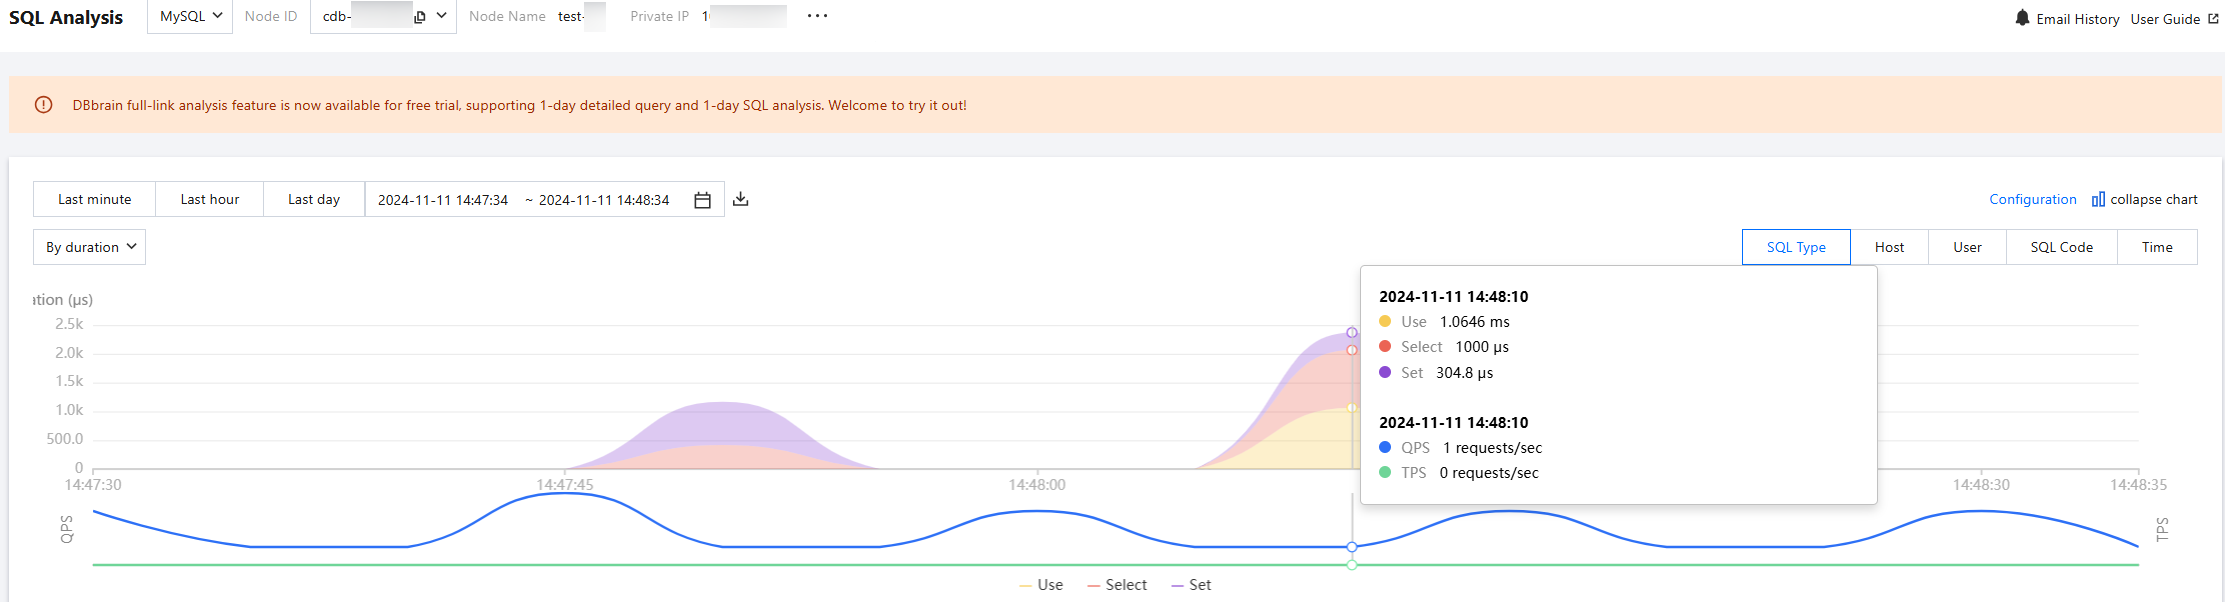
5. View the SQL performance trend chart.
Select the horizontal axis metric in the trend chart, including options such as SQL Type, Host, User, SQL Code, and Time.
Select the vertical axis metric in the trend chart, including options for time consumption (SQL execution time) and count (number of SQL executions).
The vertical axis also displays QPS and TPS by default.
You can view the performance trend chart in the following methods.
To view the values for the selected statistical dimensions and fixed metrics, hover the mouse pointer over the performance trend chart.
To display finer granularity for the performance trend within a selected time period, click and drag over the desired time range on the chart. To exit, click Reset in the top right corner of the trend chart.
To download statistical data for the selected time period and dimension, click the
above the trend chart. The file will be downloaded in .csv format. This feature is only supported for MySQL and TDSQL-C for MySQL.
Note:
If you do not need to view the performance trend chart, click collapse chart in the top right corner of the page.
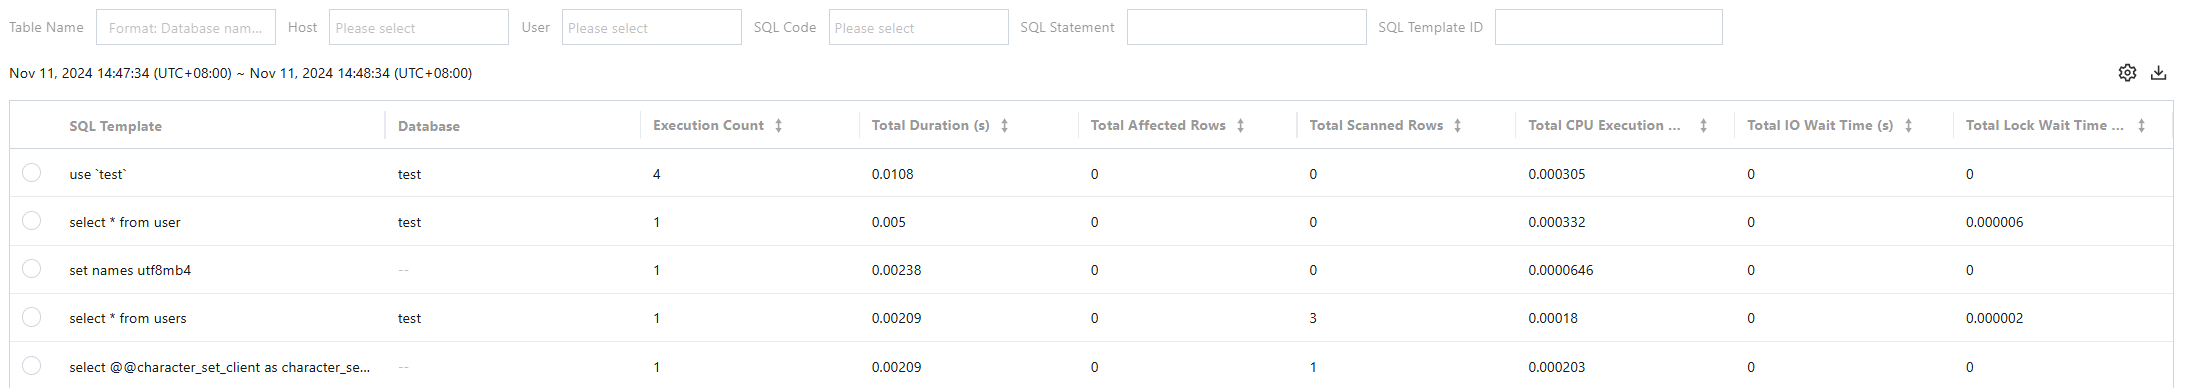
6. View the SQL template list.
6.1 (Optional) Click
in the top right corner of the SQL template list to customize the list fields, then click OK.
Filter the SQL template list by Table Name, Host, User, SQL Code, SQL Statement, or SQL Template ID.
6.2 View the SQL template list.
The SQL template list also supports the following operations:
Copy SQL template: Hover the mouse pointer over the SQL Template and click Copy.
View SQL template details: Click SQL Template or hover the mouse pointer over it, and click View. For detailed instructions, see View SQL Template Details.
Sort SQL templates in ascending or descending order based on a specific field: On the right side of the field marked with
, click
to sort the SQL templates in ascending or descending order.
Download SQL template list: Click
in the top right corner of the SQL template list to download a file in .csv format.
Viewing SQL Template Details
In the SQL template list, click an SQL template or hover the mouse pointer over it, and click View.
View the analysis view, statistical information, and detailed records for the selected SQL template.
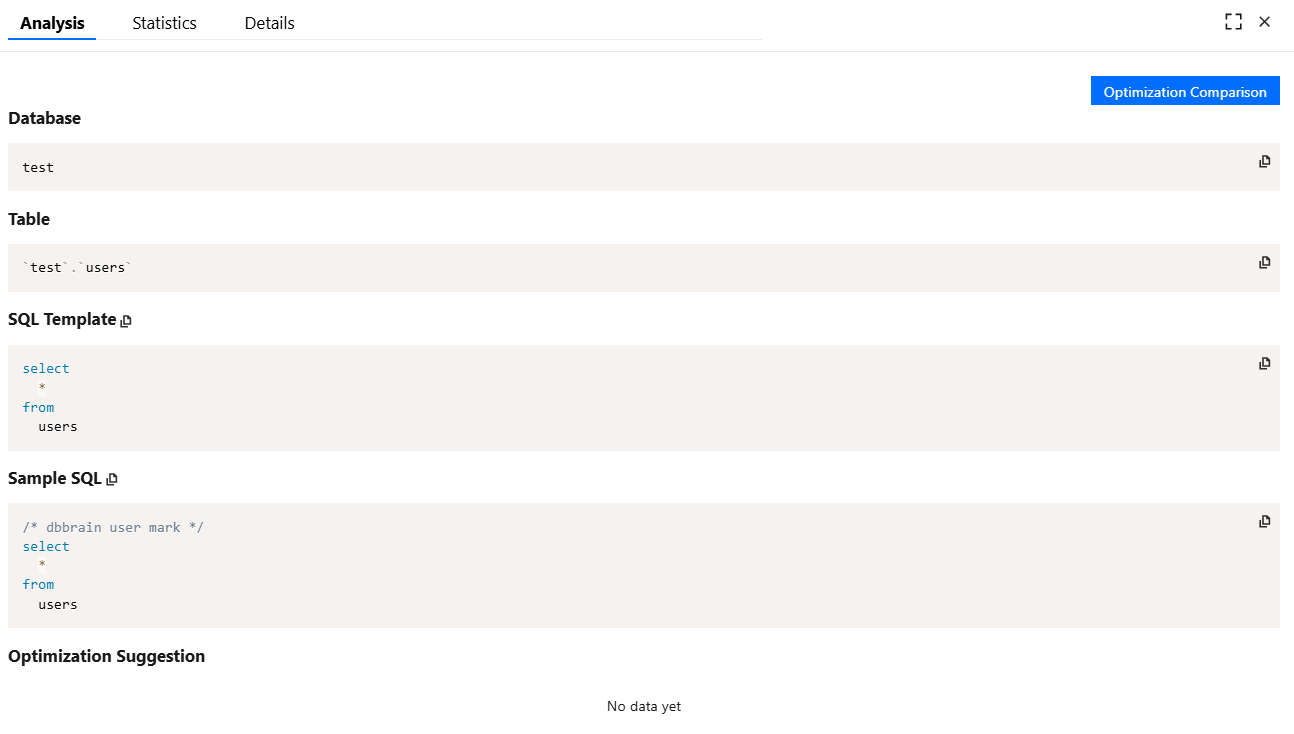
Viewing SQL Template - Analysis Tab
Displays information related to the SQL template, including associated databases, tables, and template details.
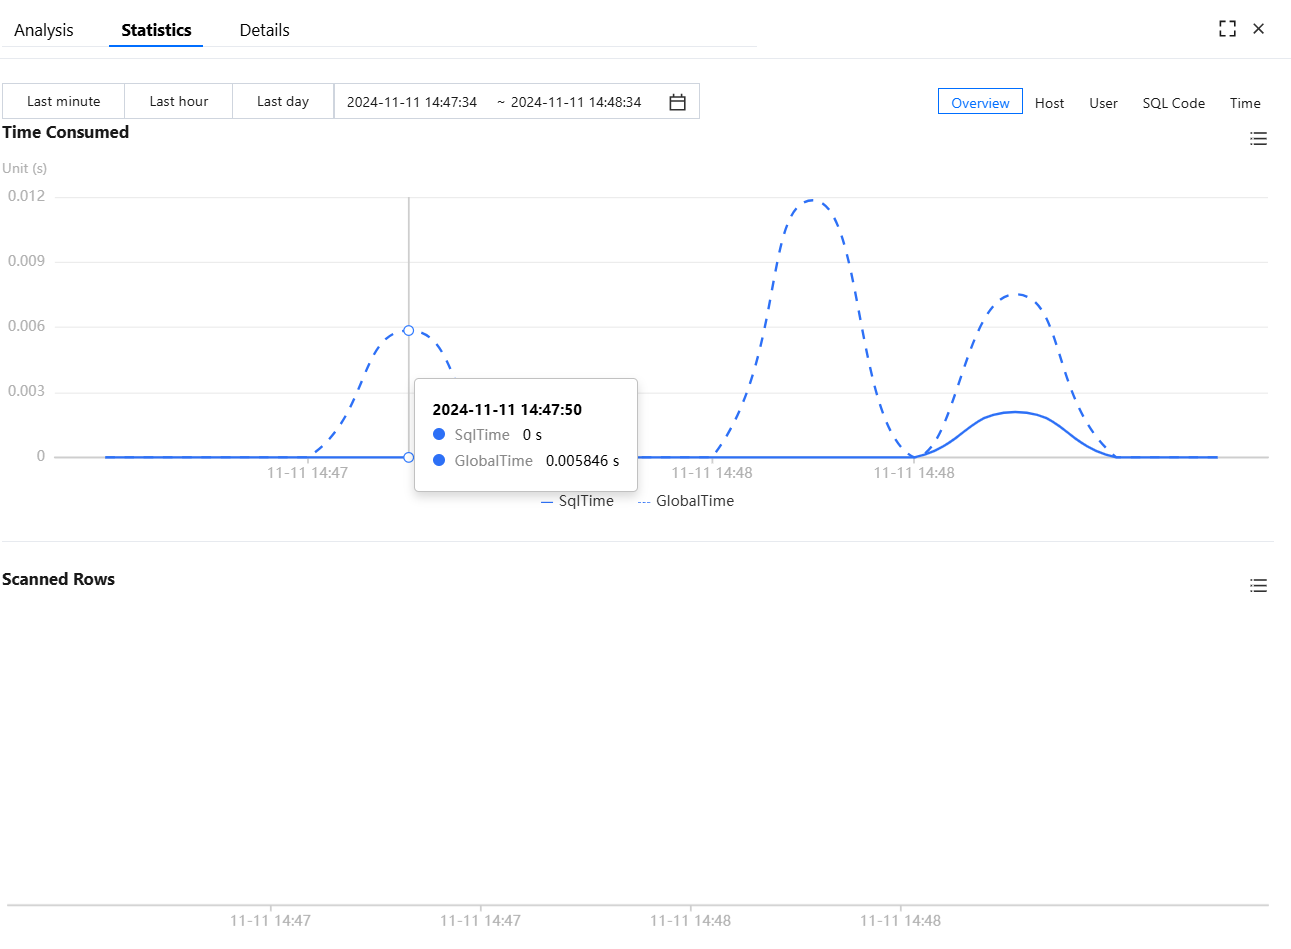
Viewing SQL Template - Statistics Tab
Displays performance trends and ring charts for SQL execution time and number of scanned rows.
Supported statistical parameters:
Select time range: You can view statistics for the last 1 minute, last 1 hour, last 1 day, or a custom time range.
Select performance statistical dimension: Options include Overview, Host, User, SQL Code, and Time.
Viewing SQL Template - Detail Tab
The Detail tab displays the specific results for the SQL template. For detailed instructions on viewing detailed SQL information, see Detail Query.