Latency Analysis
下载
聚焦模式
字号
The Tencent Cloud Distributed Cache latency analysis feature helps you understand the database latency in real time. Through latency analysis, you can quickly view the total requests, CPU usage, and history of the current instance and locate time-consuming commands, time-consuming command execution time, overall latency distribution, and access command hits.
Viewing the latency analysis result
1. Log in to the DBbrain Console.
2. In the left sidebar, choose Performance Optimization.
3. At the top of the page, select the corresponding database and instance ID, then select Latency Analysis > Latency Analysis tab.

4. On the Latency Analysis page, you can switch between real-time and historical views to check latency analysis data.
Real-time view: Displays the analysis results at each time point in real-time.
Historical view: Displays the analysis results in the last 30 minutes, last 6 hours, last 24 hours, or a custom time range.
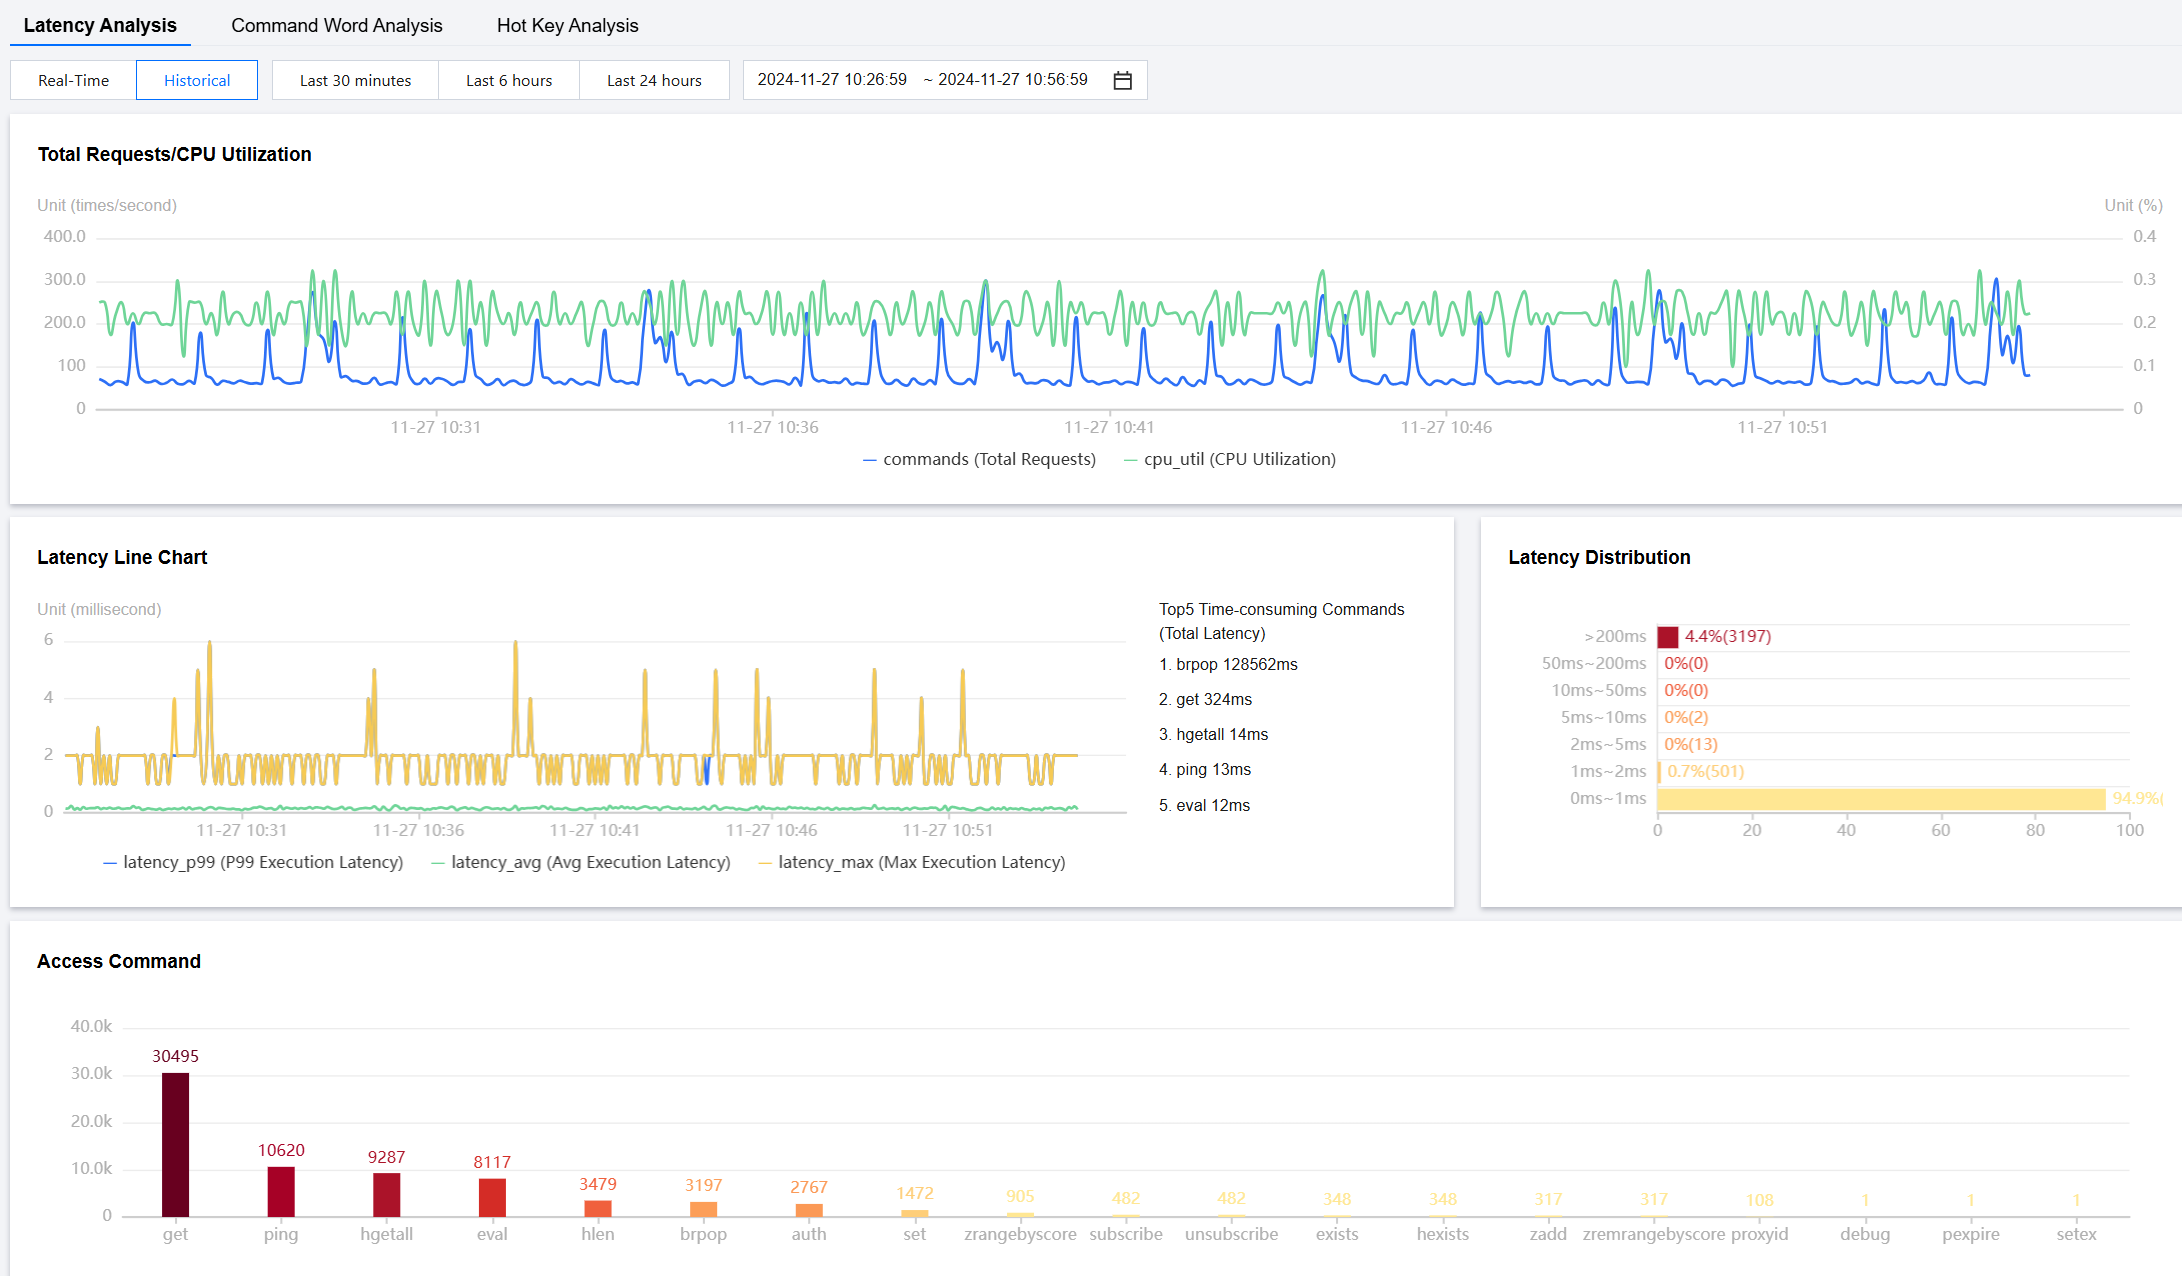
The latency distribution displays the percentage of data across different latency ranges, allowing users to quickly perceive the overall latency of their business operations. The Command area displays time-consuming commands and the the number of hits.
文档反馈