Reporting Trace Data to CLS Using the Langfuse SDK
ダウンロード
フォーカスモード
フォントサイズ
Scenarios
The Langfuse SDK can be used to trace request chains, model invocations, inputs and outputs, user information, session information, latency, and exception states in LLM applications. You can report the OpenTelemetry trace data generated by the Langfuse SDK to CLS (Cloud Log Service) and perform search, analysis, and chain troubleshooting within CLS.
This document describes how to report the Trace data generated by the Langfuse SDK to CLS. It provides the following integration methods:
Quick Access and Analysis via Skill: If you use an AI tool that supports Skill, the AI can automatically create or reuse log topics, identify the project language, generate access code, and complete reporting verification and data analysis.
Manual Configuration Access: Follow the steps to complete environment variable configuration, code integration, and reporting verification.
Access Method | Data path | Recommended Scenario |
OTLP/HTTP Standard Direct Transmission | Application > Standard OTLP HTTP Exporter > CLS | Recommended as the first choice for manual integration. Suitable for scenarios such as new projects, quick trials, wanting to reduce custom code, and wanting to report traces according to OpenTelemetry standard semantics. |
Note:
This solution does not require deploying a Langfuse Server or sending data to Langfuse Cloud. Traces are still generated by the business code using the Langfuse SDK, but the data egress is changed to CLS.
Prerequisites
Before you start the integration, ensure that the following preparations are completed:
CLS has been enabled.
Prepare an access credential with CLS write permissions, such as a CAM sub-account, a CAM Role, or a temporary key. To obtain TencentCloud API key information, go to API Key Management.
The application uses TypeScript/Node.js or Python and has integrated or plans to integrate the Langfuse SDK.
Rapid Integration and Analysis via Skill
If you use an AI tool that supports Skill, you can use the Tencent Cloud Agent Observability Access Assistant to automatically complete access and analysis. This Skill combines access and analysis capabilities. It can automatically create or reuse log topics, generate a standard OTLP/HTTP Exporter direct transmission solution, and handle Endpoint concatenation, Basic authentication,
topic_id header, field mapping, time unit, exit flush, and verification instructions. It also supports multi-dimensional analysis based on reported data, including error diagnosis, performance, Token cost, and user sessions.Before using it, prepare the following information:
Parameter | Description |
CLS_DEFAULT_REGION | The region where the Agent application is located, for example, ap-guangzhou. For more information, see Regions and Access Domains. |
TENCENTCLOUD_SECRET_ID | Tencent Cloud access credential SecretId. |
TENCENTCLOUD_SECRET_KEY | Tencent Cloud access credential SecretKey. |
Enter the following prompt in the AI tool:
Use the Tencent Cloud Agent Observability Access Assistant Skill.https://skillhub.cn/skills/tencentcloud-cls-agent-obsHelp me connect my current project to Tencent Cloud Agent Observability.Access Method: LangfuseRegion: ap-guangzhou (Replace with your actual region)
Manual Configuration for Access
Step 1: Configuring Environment Variables
Before manual access, log in to the CLS console > Agent Observability. Then, create an application via Application Access. In the log topic list, find the log topic named {application-name}-trace-topic and copy its log topic ID (for
CLS_TOPIC_ID below).Create or update the
.env file in your application project. Ensure that .env is added to .gitignore to prevent key leakage.CLS_DEFAULT_REGION=ap-guangzhouCLS_TOPIC_ID=xxxxxxxx-xxxx-xxxx-xxxx-xxxxxxxxxxxxTENCENTCLOUD_SECRET_ID=AKIDxxxxxxxxTENCENTCLOUD_SECRET_KEY=xxxxxxxxSERVICE_NAME=my-llm-app# Required for Python only. The Langfuse Python SDK checks whether the secret key exists upon startup. You can fill in any non-empty placeholder value here.LANGFUSE_PUBLIC_KEY=pk-placeholderLANGFUSE_SECRET_KEY=sk-placeholder
Note:
OTLP/HTTP standard direct transmission does not require separate configuration of
CLS_ENDPOINT. The Endpoint is automatically constructed from CLS_DEFAULT_REGION.Common regional Endpoints are as follows:
Log Topic Region | Public Network Endpoint | Private Network Endpoint |
Guangzhou | ap-guangzhou.cls.tencentcs.com | ap-guangzhou.cls.tencentyun.com |
Shanghai | ap-shanghai.cls.tencentcs.com | ap-shanghai.cls.tencentyun.com |
Beijing | ap-beijing.cls.tencentcs.com | ap-beijing.cls.tencentyun.com |
Singapore | ap-singapore.cls.tencentcs.com | ap-singapore.cls.tencentyun.com |
Note:
The public network Endpoint is designed for public network access scenarios. The private network Endpoint is designed for VPC/CVM environments within the same region, which can reduce network latency and avoid public network traffic.
Step 2: Integrating an Application
For manual access, use the standard OTLP/HTTP Exporter to report Traces to CLS. No custom export code is required. Select the TypeScript/Node.js or Python sample based on your project language to complete the access.
Note:
OpenTelemetry SDKs for different languages have different requirements for the Endpoint parameter. The TypeScript/Node.js and Python samples in this document use the complete OTLP Trace URL, which is
https://{CLS_DEFAULT_REGION}.cls.tencentcs.com/v1/traces.1. Install the dependencies.
npm install @langfuse/tracing @langfuse/otel @langfuse/openai \\@opentelemetry/sdk-node \\@opentelemetry/exporter-trace-otlp-http \\dotenv
2. Create
instrumentation.ts.import "dotenv/config";import { NodeSDK } from "@opentelemetry/sdk-node";import { OTLPTraceExporter } from "@opentelemetry/exporter-trace-otlp-http";import { LangfuseSpanProcessor } from "@langfuse/otel";const secretId = process.env.TENCENTCLOUD_SECRET_ID!;const secretKey = process.env.TENCENTCLOUD_SECRET_KEY!;const region = process.env.CLS_DEFAULT_REGION!;const topicId = process.env.CLS_TOPIC_ID!;const auth = Buffer.from(`${secretId}:${secretKey}`).toString("base64");export const sdk = new NodeSDK({spanProcessors: [new LangfuseSpanProcessor({exporter: new OTLPTraceExporter({url: `https://${region}.cls.tencentcs.com/v1/traces`,headers: {Authorization: `Basic ${auth}`,topic_id: topicId,},}),flushAt: 512,flushInterval: 5000,}),],});sdk.start();process.on("SIGTERM", async () => {await sdk.shutdown();});
3. Import
instrumentation.ts at the top of your business entry file. Ensure that this import precedes modules such as OpenAI and LangChain, which are patched by instrumentation.import { sdk } from "./instrumentation";import OpenAI from "openai";import { observeOpenAI } from "@langfuse/openai";import { startActiveObservation, propagateAttributes } from "@langfuse/tracing";const openai = observeOpenAI(new OpenAI());async function chat(userMessage: string) {return startActiveObservation("chat", async (span) => {span.update({ input: [{ role: "user", content: userMessage }] });return propagateAttributes({ userId: "u-123", sessionId: "s-456", tags: ["model:gpt-4o"] },async () => {const res = await openai.chat.completions.create({model: "gpt-4o",messages: [{ role: "user", content: userMessage }],});span.update({ output: res.choices[0].message });return res;},);});}await chat("Hello");await sdk.shutdown();
1. Install the dependencies.
pip install langfuse opentelemetry-sdk opentelemetry-exporter-otlp python-dotenv
2. Create
instrumentation.py. This file must be imported before any langfuse module.import osimport base64from dotenv import load_dotenvfrom opentelemetry import tracefrom opentelemetry.sdk.resources import Resourcefrom opentelemetry.sdk.trace import TracerProviderfrom opentelemetry.sdk.trace.export import BatchSpanProcessorfrom opentelemetry.exporter.otlp.proto.http.trace_exporter import OTLPSpanExporterload_dotenv()secret_id = os.environ["TENCENTCLOUD_SECRET_ID"]secret_key = os.environ["TENCENTCLOUD_SECRET_KEY"]region = os.environ["CLS_DEFAULT_REGION"]topic_id = os.environ["CLS_TOPIC_ID"]auth = base64.b64encode(f"{secret_id}:{secret_key}".encode()).decode()provider = TracerProvider(resource=Resource.create({"service.name": os.environ.get("SERVICE_NAME", "my-llm-app")}))provider.add_span_processor(BatchSpanProcessor(OTLPSpanExporter(endpoint=f"https://{region}.cls.tencentcs.com/v1/traces",headers={"Authorization": f"Basic {auth}","topic_id": topic_id,},),max_export_batch_size=512,schedule_delay_millis=5000,))trace.set_tracer_provider(provider)
3. Import
instrumentation.py in your business entry.import instrumentationfrom langfuse import observe, propagate_attributes, get_clientfrom langfuse.openai import openai@observe(name="chat", as_type="generation")def chat(user_message: str):with propagate_attributes(user_id="u-123", session_id="s-456", tags=["model:gpt-4o"]):return openai.chat.completions.create(model="gpt-4o",messages=[{"role": "user", "content": user_message}],)if __name__ == "__main__":chat("Hello")get_client().flush()
Advanced Configuration
Sampling Configuration: You can configure a sampling policy on the
TracerProvider to control the volume of Trace data reported to CLS.Sampler | Description | Scenario |
ALWAYS_ON | Full sampling | Test environments or low-traffic environments. |
ALWAYS_OFF | No sampling at all | Temporarily disable Trace. |
TraceIdRatioBased(0.1) | Sampling at a 10% ratio | Control write volume in production environments. |
ParentBased(root) | Determine whether to sample based on the parent Span. | Ensures consistent sampling across the entire distributed trace. |
1. Install additional dependencies.
npm install @opentelemetry/sdk-trace-base
2. Configure the sampler in instrumentation.ts.
import {ParentBasedSampler,TraceIdRatioBasedSampler,} from "@opentelemetry/sdk-trace-base";export const sdk = new NodeSDK({sampler: new ParentBasedSampler({root: new TraceIdRatioBasedSampler(0.1),}),// Keep other configurations unchanged.});
Configure the sampler in instrumentation.py.
from opentelemetry.sdk.trace.sampling import ParentBased, TraceIdRatioBasedprovider = TracerProvider(sampler=ParentBased(TraceIdRatioBased(0.1)),resource=Resource.create({"service.name": os.environ.get("SERVICE_NAME", "my-llm-app")}))
Cross-Region Reporting: If the reporting link needs to span regions, you can add the source region identifier in the OTLP request Header.
new OTLPTraceExporter({url: `https://${region}.cls.tencentcs.com/v1/traces`,headers: {Authorization: `Basic ${auth}`,topic_id: topicId,"x-cross-region": "ap-guangzhou", // Source region identifier},})
OTLPSpanExporter(endpoint=f"https://{region}.cls.tencentcs.com/v1/traces",headers={"Authorization": f"Basic {auth}","topic_id": topic_id,"x-cross-region": "ap-guangzhou", # Source region identifier},)
Disable HTTPS (Test environment only).
You can pass in a URL with the http:// protocol to use plain HTTP.
url: `http://${region}.cls.tencentcs.com/v1/traces`,
You can use the insecure=True parameter.
OTLPSpanExporter(endpoint=f"http://{region}.cls.tencentcs.com/v1/traces",insecure=True, # Test environment only# ...)
Step 3: Verifying the Reporting Result
After completing the integration, trigger an LLM call in your application, and then query Trace data in the CLS console.
1. Log in to the CLS console, and select Search and Analysis in the left sidebar.
2. Select the log topic for storing Trace data.
3. Enter the following statement in the search box to query the most recently reported Trace data.
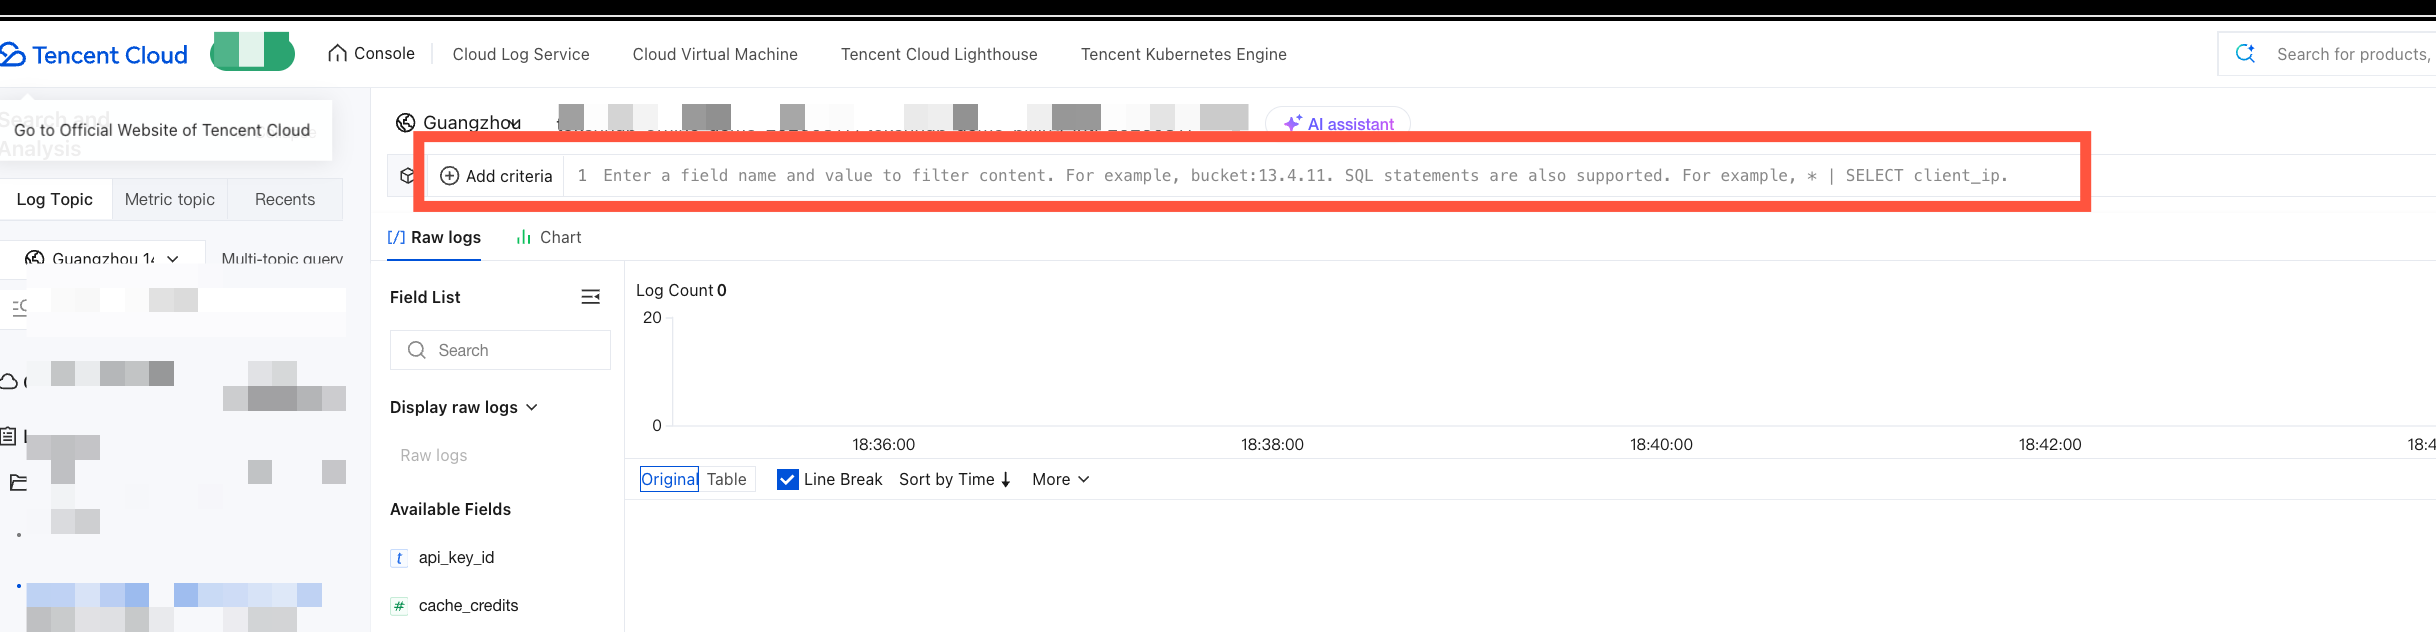
* | SELECT traceID, spanID, name, duration, statusCode ORDER BY __TIMESTAMP__ DESC LIMIT 10
You can also query a specified call chain:
traceID:"4bf92f3577b34da6a3ce929d0e0e4736"
To calculate the average latency by model, ensure that the model field is written to
attribute and that an index is configured or a JSON extraction function is used:* | SELECT json_extract_scalar(attribute,'$."gen_ai.request.model"') AS model,AVG(duration) AS avg_duration_nsGROUP BY model
Field Description
When OTLP/HTTP standard direct transmission is used, information such as
resource, scope, and span is reported to CLS according to the OpenTelemetry standard protocol structure.After data is reported, the mapping of OTel Span fields in CLS is as follows to facilitate your search and analysis:
OTel Span Field | CLS LogItem Key | Description |
traceId | traceID | Trace ID, a hex string. |
spanId | spanID | Span ID, a hex string. |
parentSpanId | parentSpanID | Parent Span ID, which is empty for the root Span. |
span.name | name | Span name. |
SpanKind | kind | Span type. |
startTime | start | Span start time, in nanoseconds. |
endTime | end | Span end time, in nanoseconds. |
endTime - startTime | duration | Span duration, in nanoseconds. |
status.code | statusCode | Span status code. |
status.message | statusMessage | Span status message. |
attributes | attribute | Span attributes, a JSON string. |
resource.attributes | resource | Resource attributes, a JSON string. |
events / links | logs / links | Optional. If you need to retain Span Events or Links, serialize them into a JSON string and write it. |
Must-Knows
The
start, end, and duration fields must remain in nanoseconds. Do not divide these fields by 1000 to convert them to microseconds, otherwise the latency will be displayed as one-thousandth of the actual value.Before a short-lived script exits, you must call
flush() or shutdown() to prevent the final batch of Spans from failing to be reported.Inject access credentials via environment variables or a key management tool. Do not hardcode them in your code.
フィードバック