After installing and deploying LogListener in the self-built Kubernetes cluster, you can configure collection by creating a LogConfig object or in the console to start log collection.
In case of any log collection exceptions, perform troubleshooting as follows.
1. Check the LogConfig status
View all collection configurations of the cluster: kubectl get logconfig
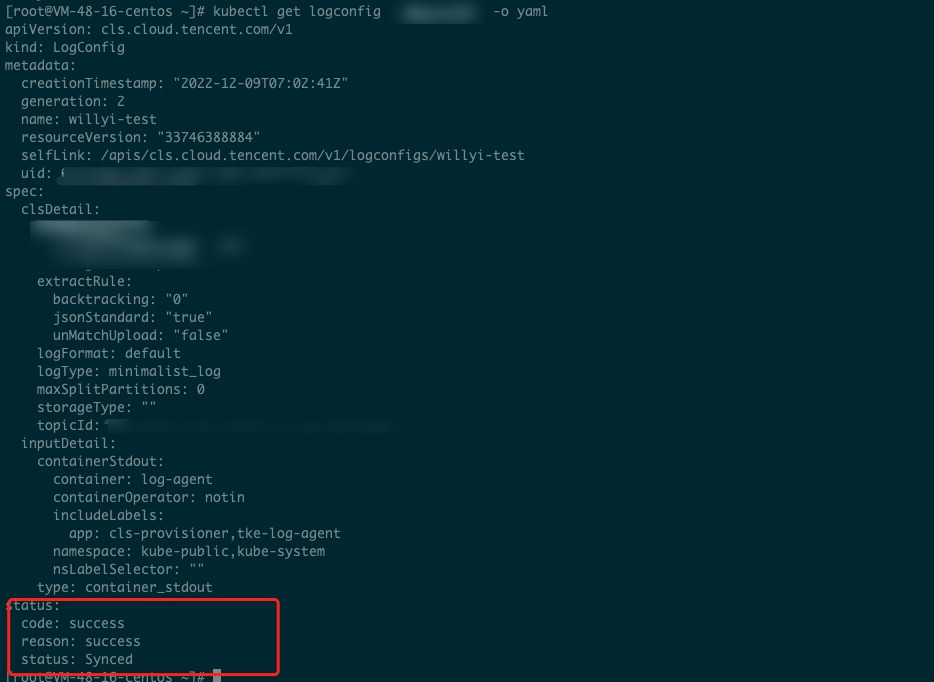
View a specific collection configuration: kubectl get logconfig xxx -o yaml
View the LogConfig sync status. If the status is not Synced, an exception occurred, and you can view the exception message in reason. In normal cases, the status is success.
If the LogConfig status is Synced as shown below, the collection exception is due to another issue:
To further identify the sync error cause, check the cls-provisioner log. 2. View the cls-provisioner log
Identify the Pod of cls-provisioner: kubectl get pods -n kube-system -o wide |grep cls-provisioner
View the log: kubectl logs cls-provisioner-xxx -n kube-system
As shown below:
View the cls-provisioner log to check the sync error cause. Note:
The cls-provisioner component communicates with the CLS server. Specifically, it converts and syncs the LogConfig collection configuration to the CLS server. In this way, the collector can get the collection configuration from the server for normal log collection.
3. View the collector log
If the log collection exception persists when the collection configuration is synced properly, check the collector log.
Check whether the soft link is created successfully.
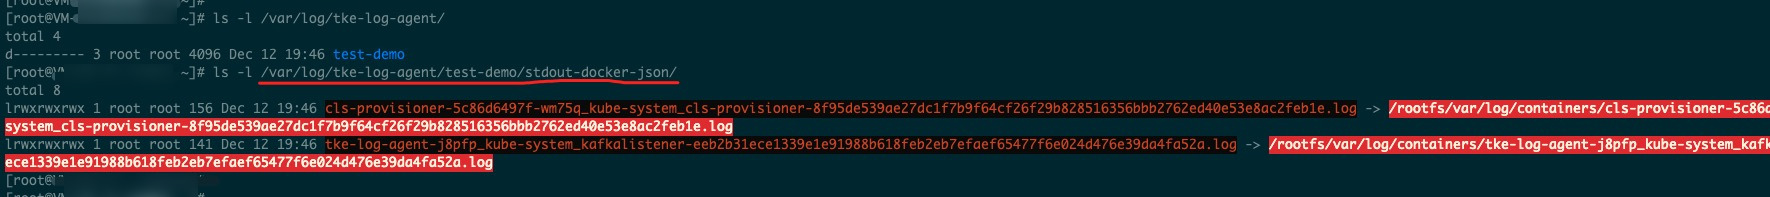
Taking the collection of standard output as an example:
The soft link of the standard output log of the Pod to be collected will be created in /var/log/tke-log-agent/<Collection configuration name (LogConfig name)>/stdout-docker-json, after which logs can be collected properly.
In the case of Docker, if the runtime is containerd, the path will be /var/log/tke-log-agent/<Collection configuration name (LogConfig name)>/stdout-containerd.
The soft link of the containerd file to be collected is created as follows:
/var/log/tke-log-agent/<Collection configuration name (LogConfig name)>/
As shown below:
Check whether the soft link created as instructed above is OK. If no soft link is created, an exception occurred. If the creation is successful, further check the log of LogListener. View the log of LogListener.
kubectl get pods -n kube-system -o wide |grep tke-log-agent
First, find the Pod of tke-log-agent on the host of the Pod of the log collection exception and view the LogListener log.
kubectl logs tke-log-agent-xxx -n kube-system -c loglistener
Check whether readFile logs send succ!|topicid or a similar description exists as shown above, and if so, the log is successfully collected to the target topic; if not, the collection is abnormal, and you can contact us for assistance.
If the log has been collected to the topic but cannot be found, check whether full-text index is enabled for the topic.