通过 Grafana 使用 CLS
Download
聚焦模式
字号
操作场景
日志服务(Cloud Log Service,CLS)与 Grafana 打通,支持将 CLS 的原始日志数据与 SQL 聚合分析结果导出,并在 Grafana 展示。您只需安装 日志服务 Grafana 插件,并在 Grafana 填写检索分析的语句,即可在 Grafana 上展示结果。
本文档以 CentOS 操作系统为例,指导您安装和配置 Grafana。
操作步骤
安装 Grafana
1. 安装 Grafana 8.0 以上版本,具体操作请参见 Grafana 官网文档。
若 Grafana 版本低于8.0,需进行配置备份和升级,详情请参考 Grafana 升级指南。
以 CentOS 安装 grafana 8.4.3 (点此获取新版本地址)为例:
sudo yum install initscripts urw-fonts wgetwget https://dl.grafana.com/oss/release/grafana-8.4.3-1.x86_64.rpmsudo yum install grafana-8.4.3-1.x86_64.rpmsudo systemctl daemon-reloadsudo systemctl start grafana-serversudo systemctl status grafana-serversudo systemctl enable grafana-server
2. 安装后,建议修改 grafana.ini 文件的 [dataproxy] 配置。
grafana 默认超时时间为30s,在大数据量检索时,可能导致 timeout 问题,详见 Grafana proxy queries timeout after 30s with dataproxy。建议修改至60s,以最大限度发挥日志服务的能力。修改配置如下:
[dataproxy]timeout = 60dialTimeout = 60keep_alive_seconds = 60
如需安装更多可视化图表(例如饼图、趋势速览图等),请执行对应的命令安装 grafana panel 插件。
例如,您需要安装饼图(pie panel),可执行如下命令:
grafana-cli plugins install grafana-piechart-panelservice grafana-server restart
安装 CLS 对接 Grafana 插件
从官方插件库安装
1. 进入 Grafana 页面。
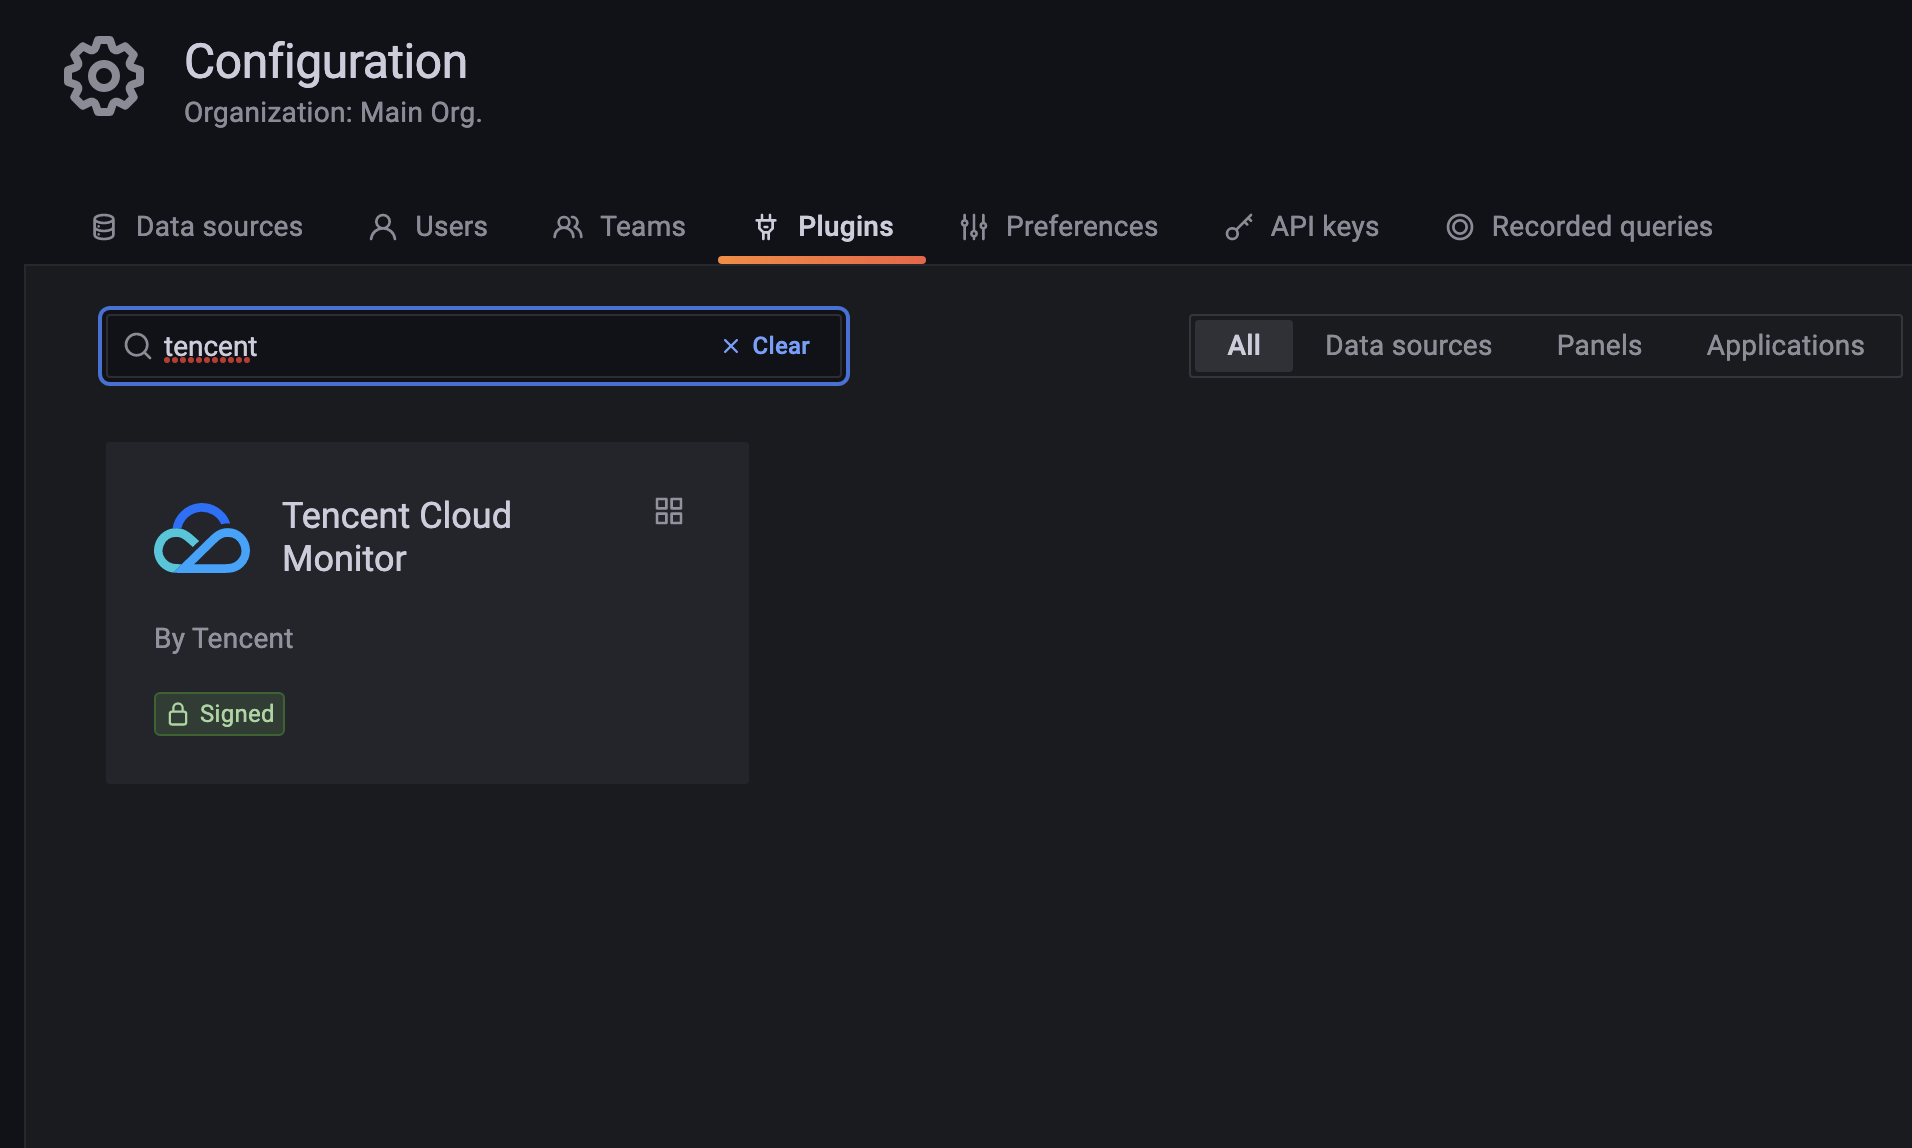
2. 在设置(configuration)> 插件(plugin)页面,搜索 Tencent cloud monitor,并选择该插件,单击安装。
通过命令行安装
1. 安装 日志服务插件。
grafana-cli plugins install tencentcloud-monitor-app# 如果遇到安装后插件仍然无法找到,可能是由于插件目录配置不是默认值,可先进入插件安装目录,并执行以下命令# 如果您的云服务器非 CentOS 系统,请先确认 Grafana 的插件目录位置,再进入该插件目录进行安装。grafana-cli --pluginsDir ./ plugins install tencentcloud-monitor-app# 如果需要安装非官方最新版本的插件,或安装Beta版本,可执行以下命令grafana-cli --pluginUrl https://github.com/TencentCloud/tencentcloud-monitor-grafana-app/archive/refs/tags/${VERSION}.zip plugins install tencentcloud-monitor-app
2. 执行如下命令,重启 grafana 服务。
service grafana-server restart
配置日志数据源
1. 在浏览器中访问地址
http://${GrafanaIP地址}:3000 (默认端口为3000),登录 Grafana。2. 在左侧菜单栏中,选择设置图标,进入 Plugins 页面,选中 Tencent Cloud Monitor 插件,并在 Config 页面单击 Enable 进行插件启用。
3. 在 Data Sources 页面,单击 Add data source。
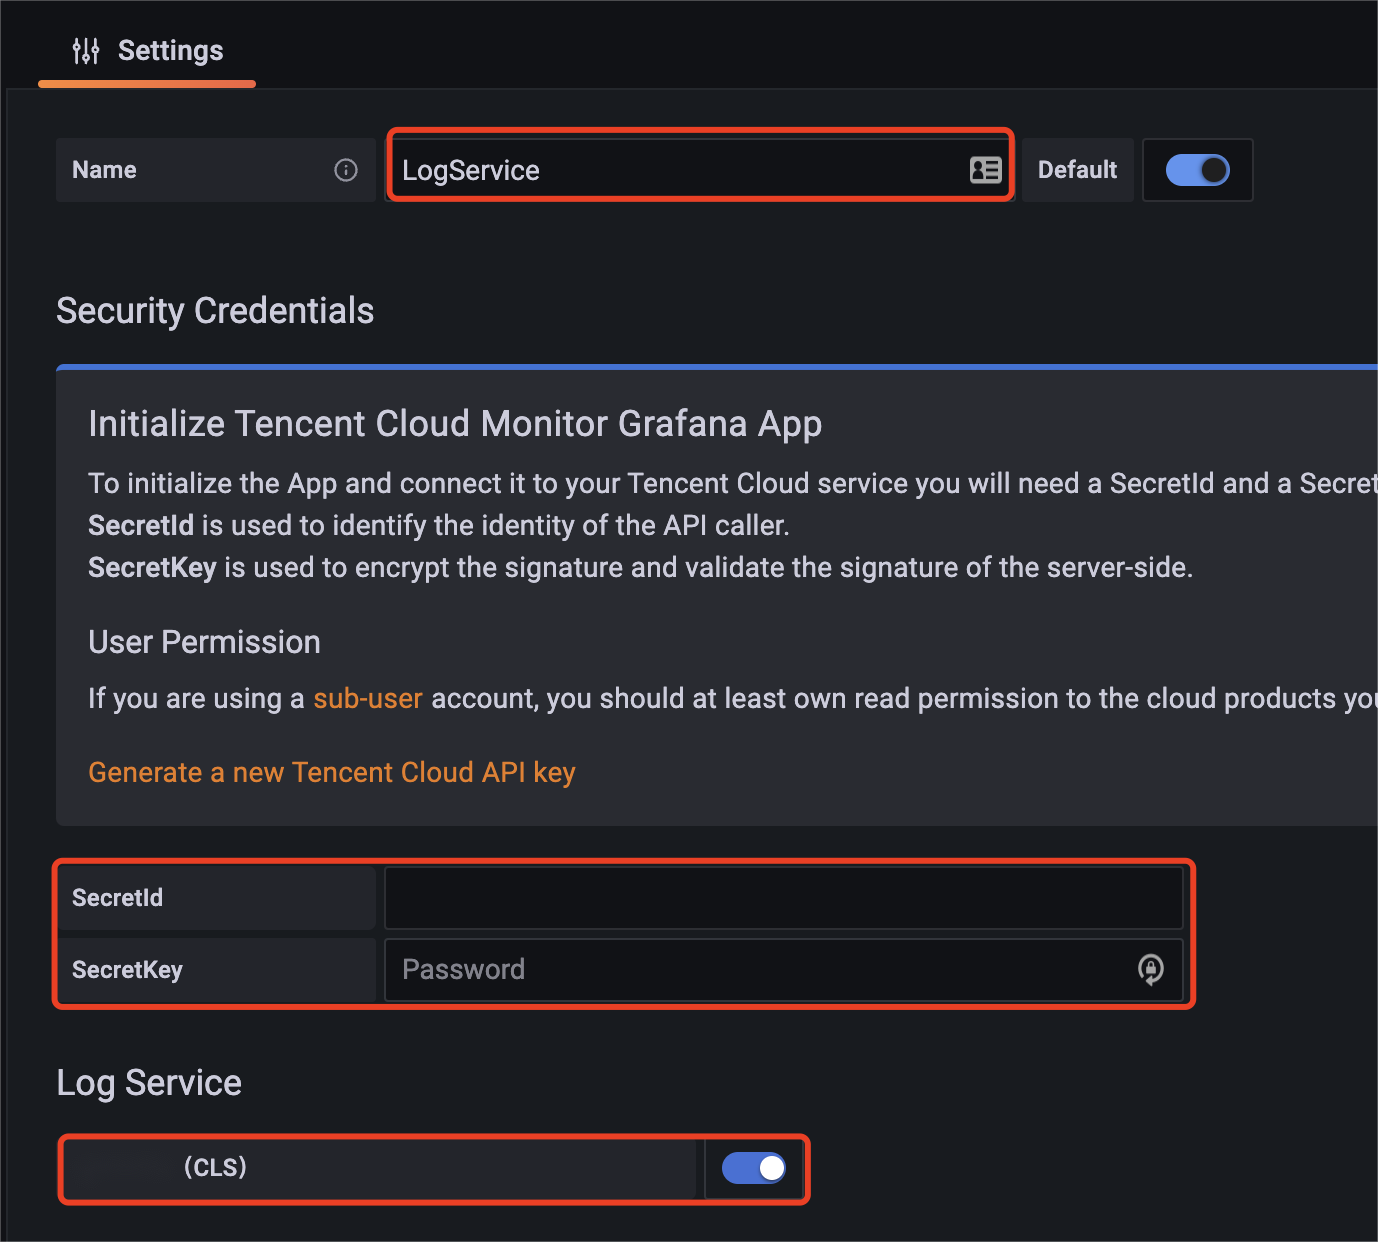
4. 选中 Tencent Cloud Monitor,按照页面内说明,填写数据源名称,腾讯云 访问密钥,勾选日志服务,并单击保存。
试用 CLB-DEMO 的预设仪表盘
参考文档创建日志主题后,进入插件预设的 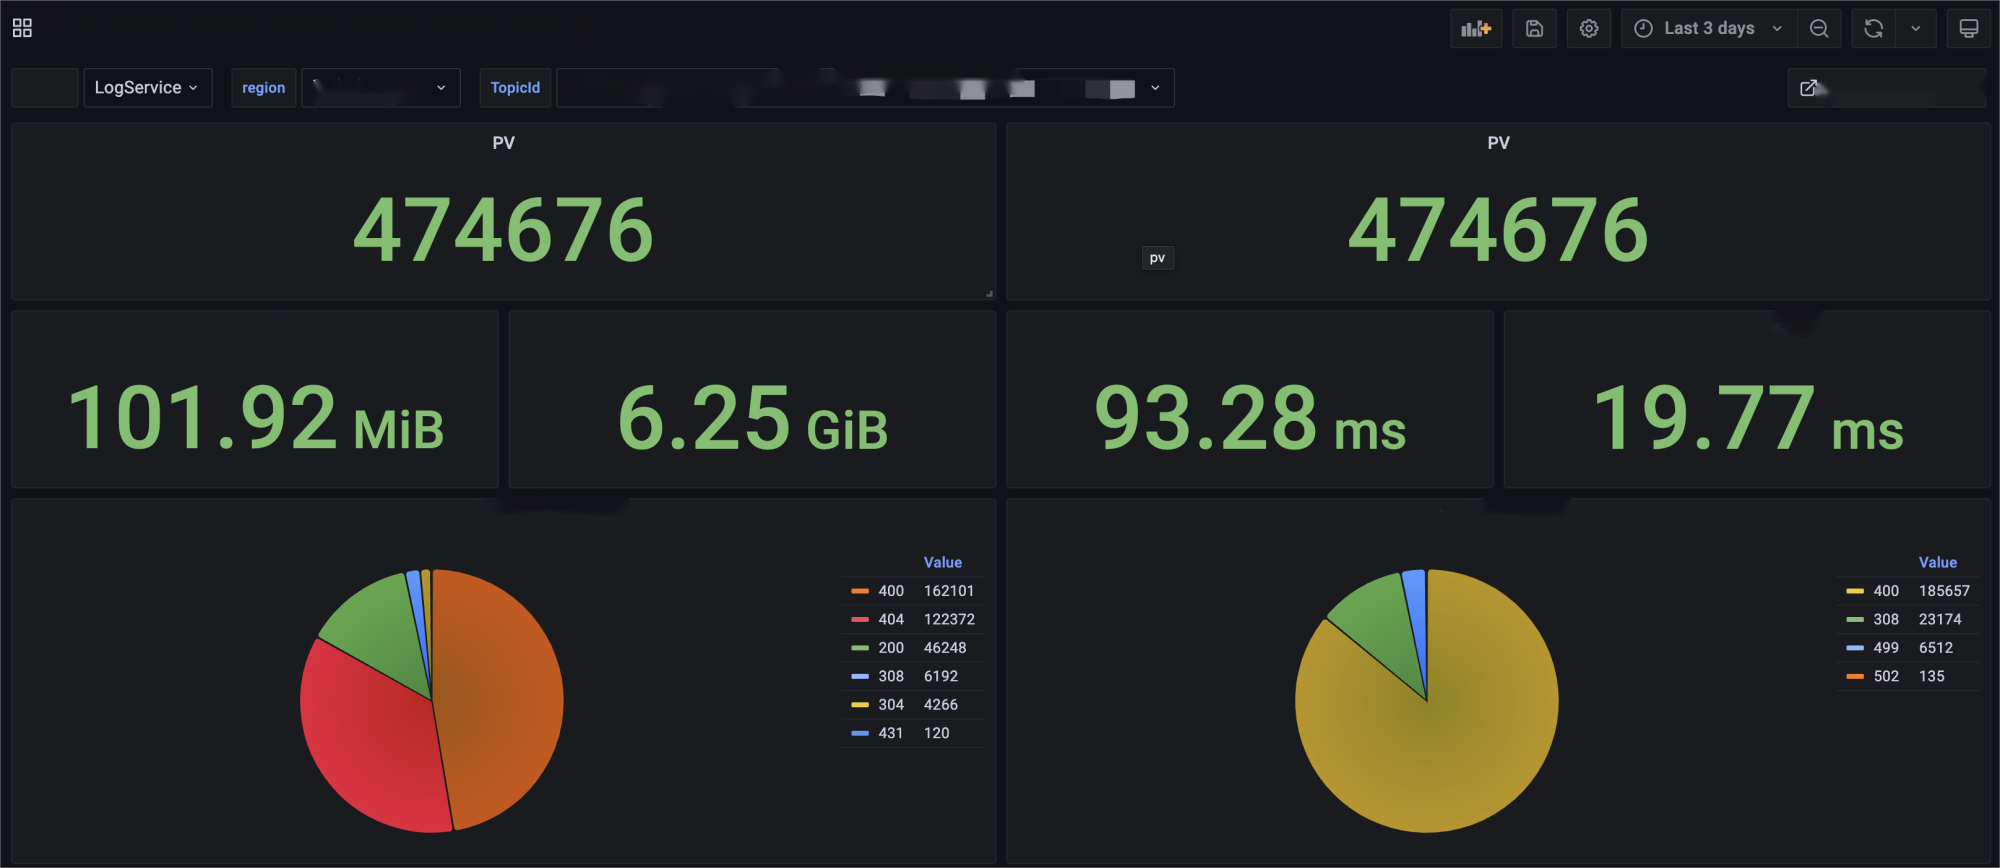
CLB Demo 访问日志 仪表盘,即可查看到预设的相关内容。
手动配置 dashboard
1. 在左侧导航栏中,单击 Create Dashboards。
2. 在 Dashboard 页面,单击 Add new panel。
3. 选择数据源后,并在内容中选中地域和日志主题,并输入对应的检索分析语句。
4. 单击右上角时间刷新,即可查看到请求展示的效果。
使用日志分析输入 SQL 进行绘图展示
Grafana 的原生图表,在数据可视化上的思路为:数据类型驱动。根据字段的类型,判断某类图表能否绘制、如何绘制。
1. 绘制表格
表格对数据格式没有特殊要求,任意 SQL 返回内容都可以进行展示。
2. 绘制时序图。SQL 返回内容包含两个字段,时间类型的 analytic_time 和数值类型的log_count,完成绘图。
* | select histogram( cast(__TIMESTAMP__ as timestamp),interval 1 minute) as analytic_time, count(*) as log_count group by analytic_time order by analytic_time limit 1000
绘制饼图类(Pie、Gauge、BarGauge、Stat),(注意右侧图表配置项 Value Options - show 选择 All values)。
* | select try_cast(status as varchar) as status, count(*) as log_count group by status
SQL 返回两个字段,字符类型的 status 和数值类型的 log_count。Grafana 将自动选择字符类型作为标签进行绘图。
注意:
如果此处不使用 try_cast 进行类型转化,绘图结果将会受到影响。
对于 SQL 返回的内容字段类型不满足图表绘制,除在 SQL 中使用类型转化函数外,还可使用 Grafana Transform
Convert field type 功能,可达到可视化展示的目的。查看原始日志
对于检索类场景,推荐使用 Logs 插件进行展示。
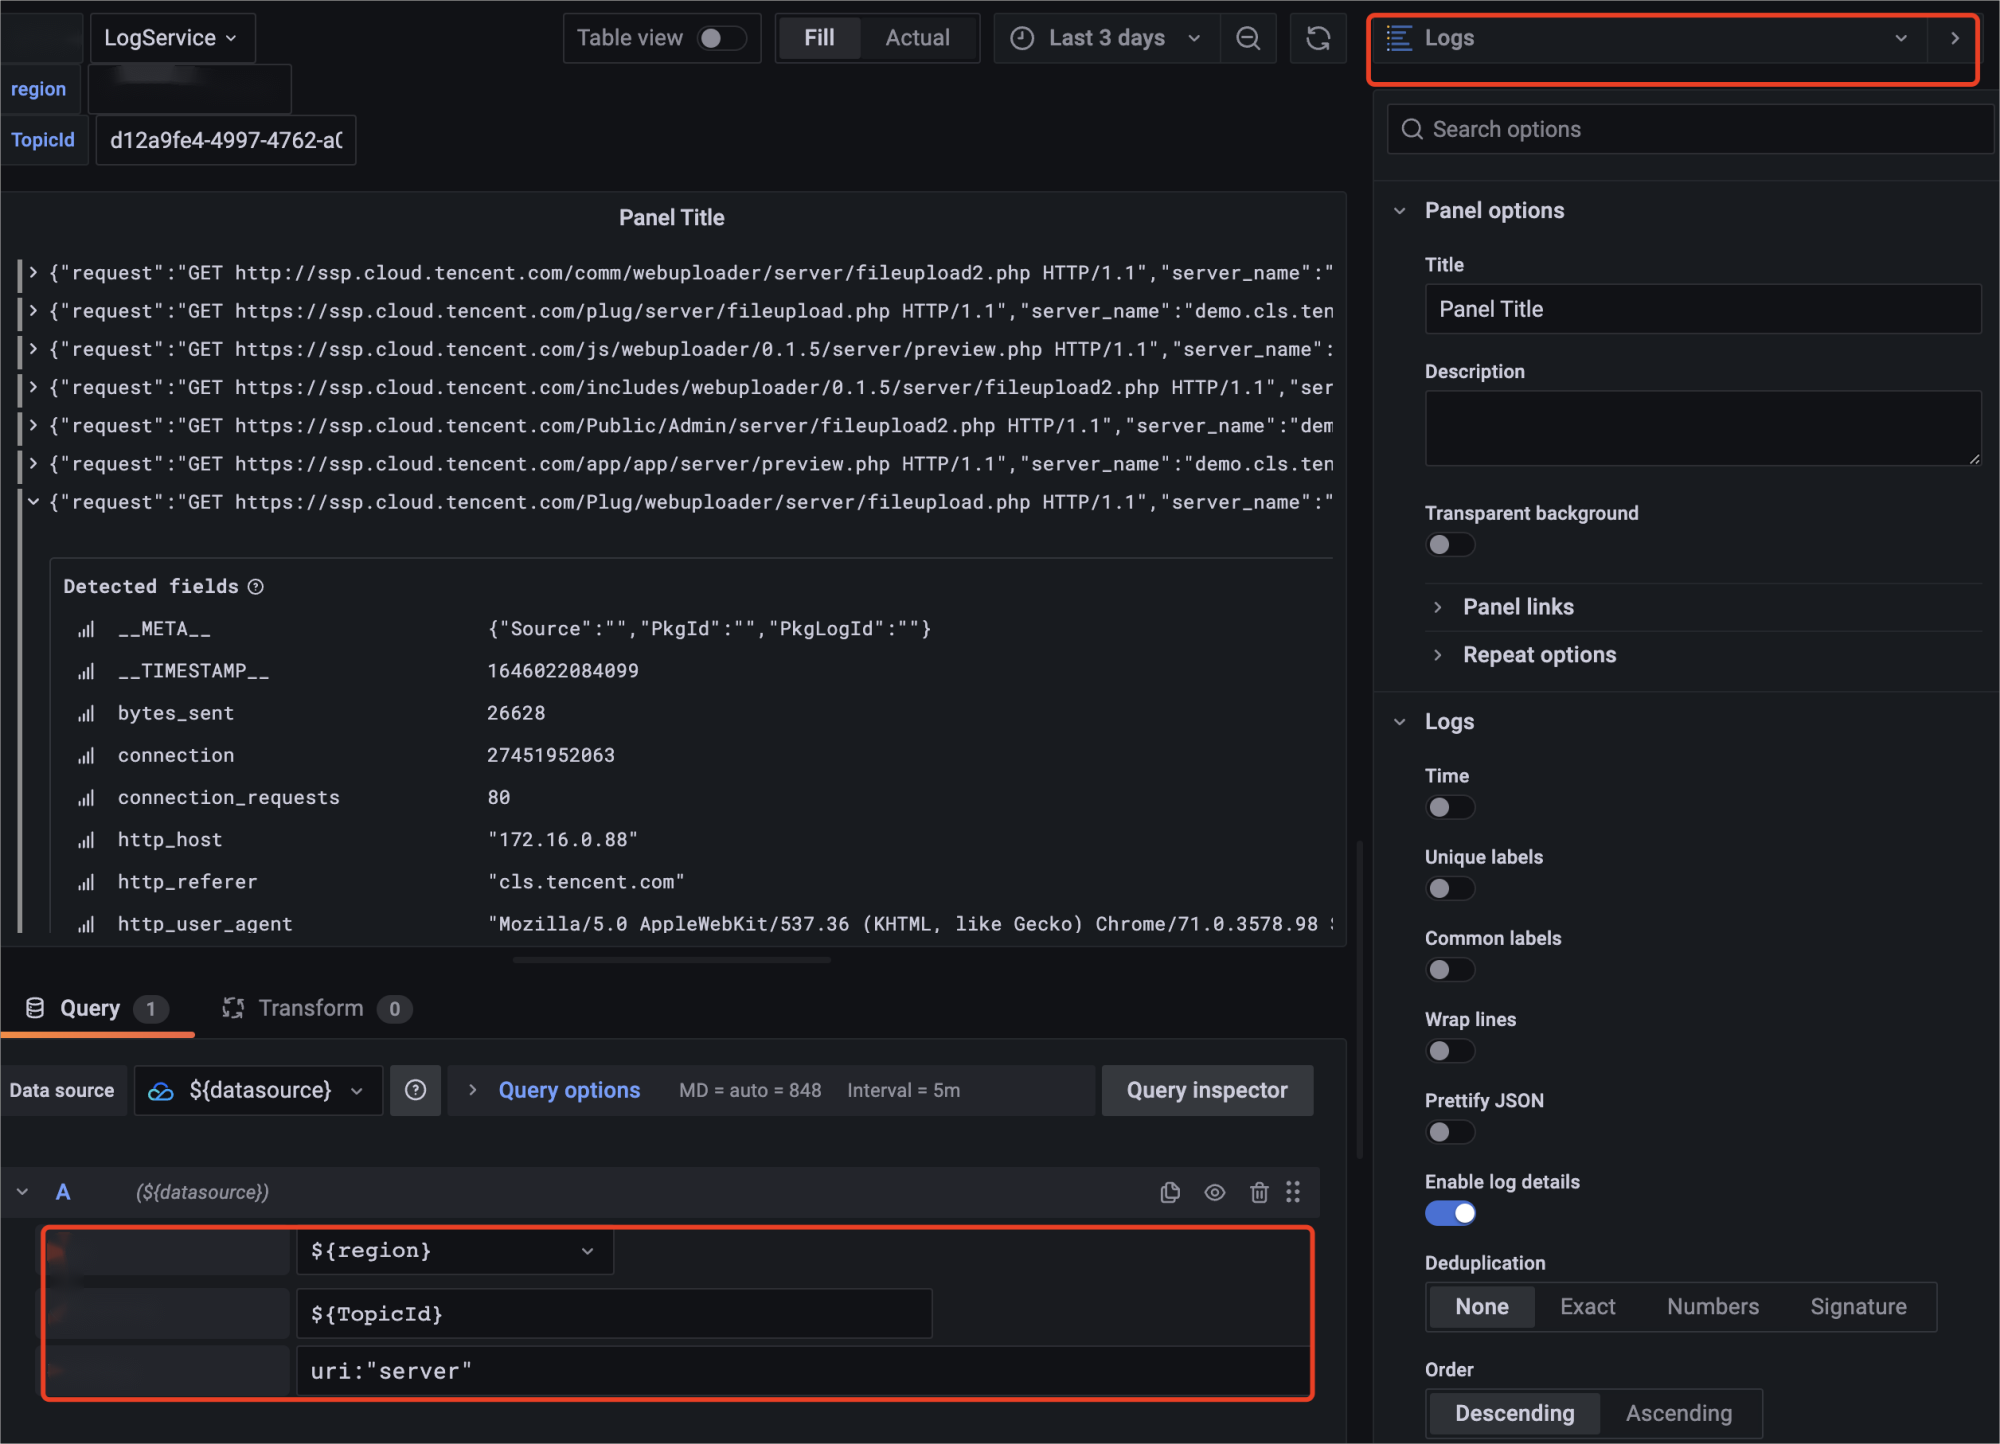
对于 Grafana v8.3以上版本用户,也可通过 Transform 功能中的 Extract fields 功能,对检索返回内容进行字段提取,在 Table 中查看数据。
插件其他使用指引
文档反馈