Applicable Scenarios
Kubernetes reports the status of cluster resource objects by using events. They typically indicate some status changes in the system. For example, when installing or modifying workloads, you can check for errors in the current resource objects and view the reasons for these errors according to event information. Each event can be retained for only 1 hour in a Tencent Kubernetes Engine (TKE) cluster.
If the event information contains errors, the cluster administrator needs to pay immediate attention. TKE allows you to configure event persistence for all clusters. Once this feature is enabled, TKE will export your cluster events to the configured storage end in real time. For details, refer to Event Storage. Service/Ingress, as an ingress layer resource object in Kubernetes, significantly impacts business service stability. Therefore, monitoring and reporting Service/Ingress errors have become common requirements. In response, TKE also defines error codes, reasons, and resolutions of common Service/Ingress error events. For details, refer to Common Service & Ingress Errors and Solutions. This document provides alarm practices for Service/Ingress error events in clusters. Operation Steps
Step 1: Enabling Event Collection for a Cluster
2. In the left sidebar, select O&M Feature Management.
3. At the top of the Feature Management page, select a region and a cluster type, and then click Set on the right side of the cluster for which event storage needs to be enabled.
4. On the Feature Settings page, click Edit on the right side of Event Storage. Check Enable Event Storage and configure the logset and logtopic. For details, see Event Storage. Note:
If you have multiple Kubernetes clusters in the same region, it is recommended to enable event storage for multiple clusters and select the same logtopic and logset.
Step 2: Checking for Event Collection
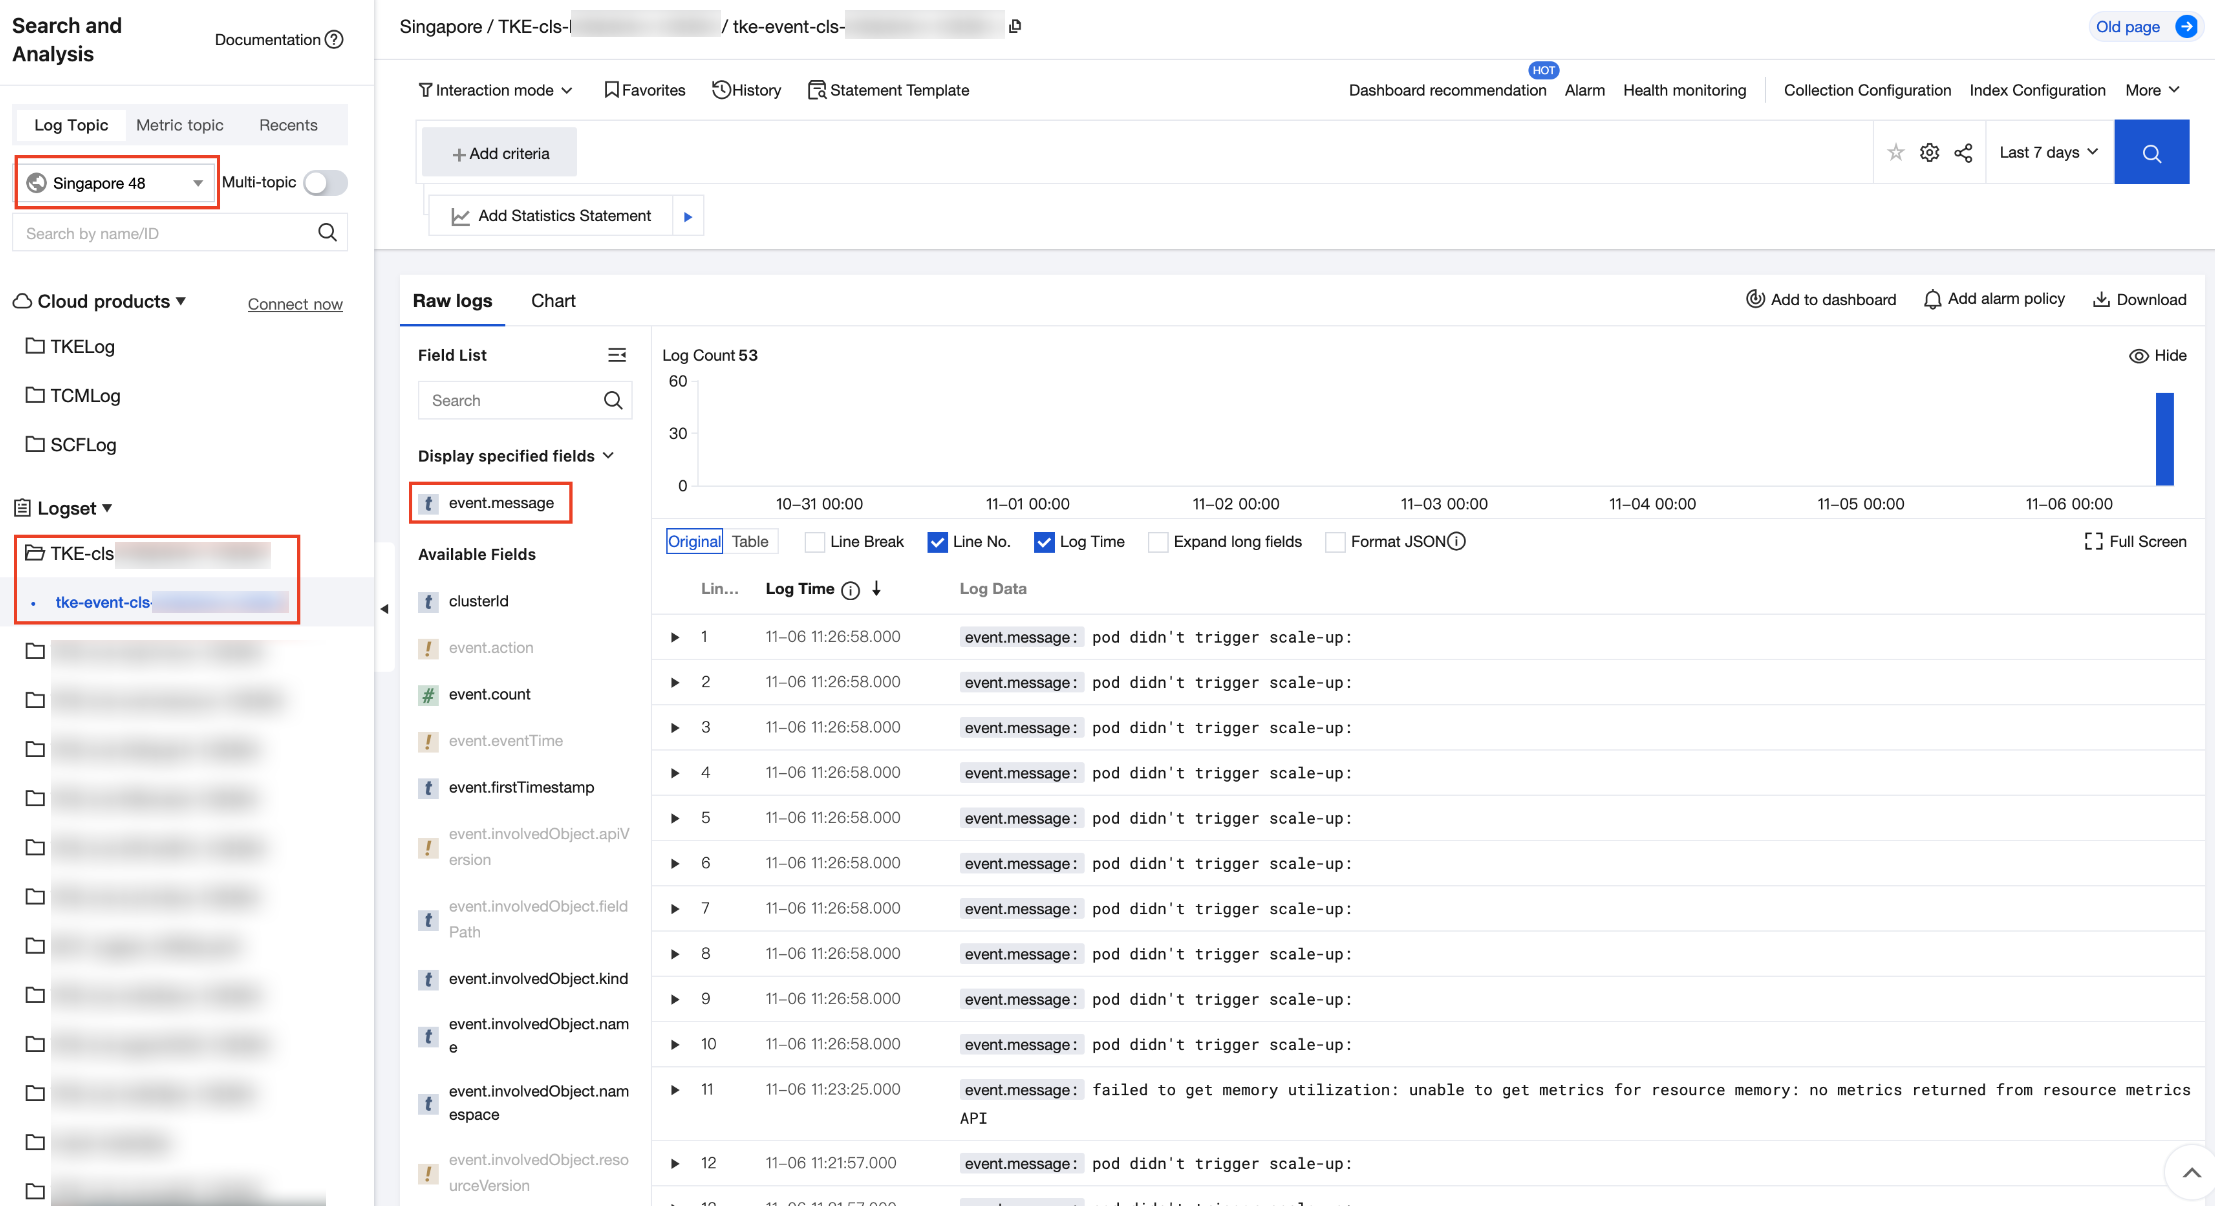
1. Log in to the CLS console and go to the Search and Analysis page. 2. On the Search and Analysis page, select the region, and the logset and logtopic of the cluster with event collection enabled.
3. In "Raw Logs", search for the event.message field, which contains the event information generated by resource objects in the cluster, as shown in the figure below.
Step 3: Creating an Alarm Policy
Take the Ingress event alarm as an example, similarly for Service.
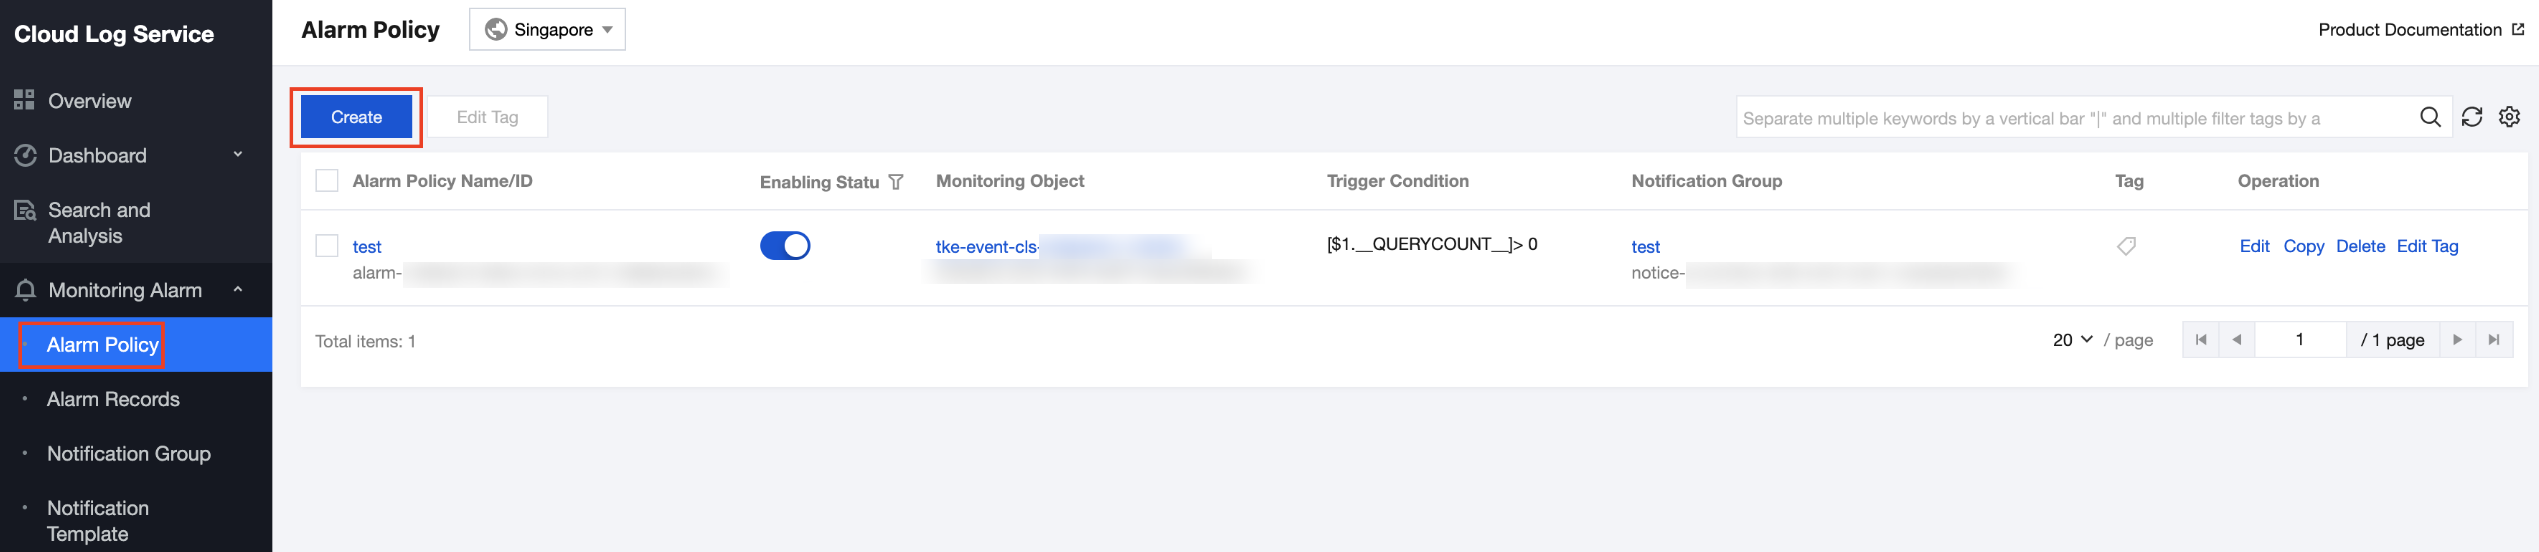
1. Log in to the CLS console. Choose Monitoring Alarm > Alarm Policy. 2. On the Alarm Policy page, click Create, as shown in the figure below.
3. On the Create Alarm Policy page, set the policy based on the following information:
Log Topic: Select the topic created in Step 1. Execution Statement: Add the execution statement (event.message:"Ingress Sync ClientError." OR event.message:"Ingress Sync DependencyError." OR event.message:"IngressError. ErrorCode:") | SELECT count(*) as ErrCount
Note:
It indicates all Ingress event information is obtained.
Trigger Conditions: Add the trigger condition $1.ErrCount > 0.
Note:
It indicates an alarm is triggered immediately upon event information.
Multidimensional Analysis: Select Custom Definition search and analysis.
Name: You can define a name.
Search and Analysis Statement: Add the search and analysis statement: (event.message:"Ingress Sync ClientError." OR event.message:"Ingress Sync DependencyError." OR event.message:"IngressError. ErrorCode:") | SELECT clusterId, event.involvedObject.namespace, event.involvedObject.name, split(split(event.message, 'ErrorCode: ')[2], ' ')[1] as ErrorCode, count(*) as ErrCount group by (clusterId, event.involvedObject.namespace, event.involvedObject.name, ErrorCode)
Notification Content: Add the notification content "Ingress alarm: The following cluster resources encounter an error concurrently:"
Step 4: Viewing the Alarm
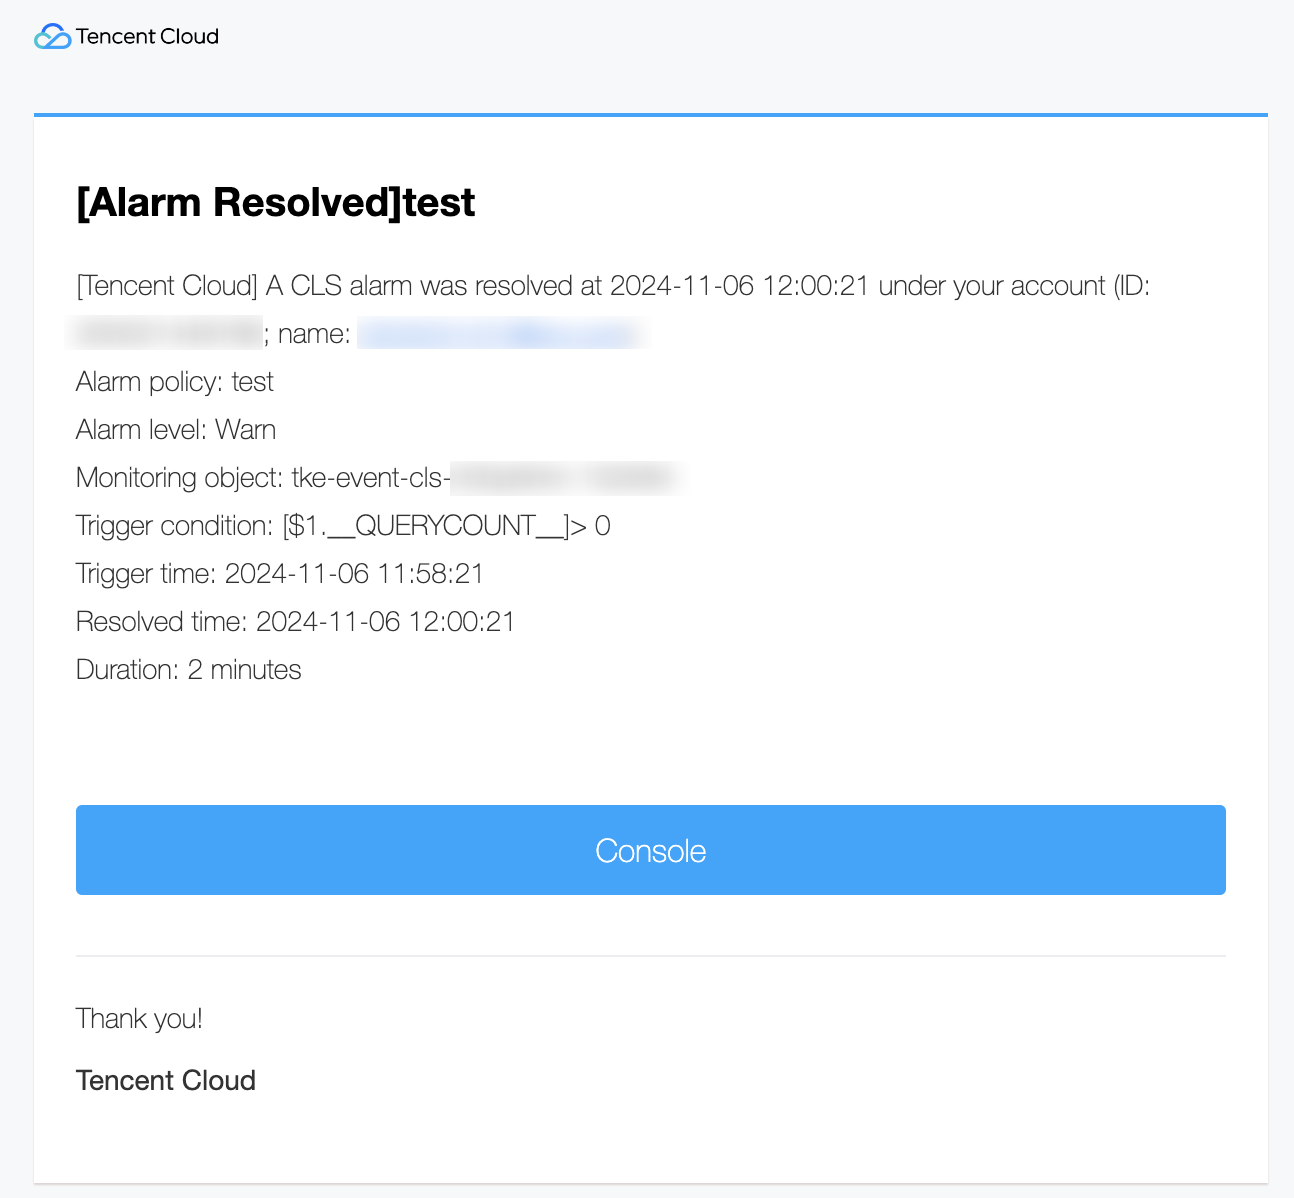
You need to ensure that new events have occurred in Step 2, and that the execution cycle and alarm notification frequency of the alarm policy in Step 2 are appropriate (for example, set it to once every minute during testing), so that you can view the alarm content in the alarm notification channel. In this example, alarms are set to be sent by emails, and you can refer to the alarm content in the email, as shown in the figure below.