使用 Prometheus 监控 Java 应用
Download
聚焦模式
字号
操作场景
Prometheus 社区开发了 JMX Exporter 用于导出 JVM 的监控指标,以便使用 Prometheus 来采集监控数据。当您的 Java 业务容器化至 Kubernetes 后,可通过本文了解如何使用 Prometheus 与 JMX Exporter 来监控 Java 应用。
JMX Exporter 简介
Java Management Extensions,JMX 是管理 Java 的一种扩展框架,JMX Exporter 基于此框架读取 JVM 的运行时状态。JMX Exporter 利用 Java 的 JMX 机制来读取 JVM 运行时的监控数据,然后将其转换为 Prometheus 可辨识的 metrics 格式,以便让 Prometheus 对其进行监控采集。
JMX Exporter 提供启动独立进程及 JVM 进程内启动(in-process)两种方式暴露 JVM 监控指标:
1. 启动独立进程
JVM 启动时指定参数,暴露 JMX 的 RMI 接口。JMX Exporter 调用 RMI 获取 JVM 运行时状态数据,转换为 Prometheus metrics 格式,并暴露端口让 Prometheus 采集。
2. JVM 进程内启动(in-process)
JVM 启动时指定参数,通过 javaagent 的形式运行 JMX Exporter 的 jar 包,进程内读取 JVM 运行时状态数据,转换为 Prometheus metrics 格式,并暴露端口让 Prometheus 采集。
说明:
官方不建议使用启动独立进程方式,该方式配置复杂且需单独的进程,进程本身的监控又引发了新的问题。本文以 JVM 进程内启动(in-process)方式为例,在 Kubernetes 环境下使用 JMX Exporter 暴露 JVM 监控指标。
操作步骤
使用 JMX Exporter 暴露 JVM 监控指标
打包镜像
使用 JVM 进程内启动(in-process)方式,启动 JVM 需指定 JMX Exporter 的 jar 包文件和配置文件。jar 包为二进制文件,不便通过 configmap 挂载,建议直接将 JMX Exporter 的 jar 包和配置文件都打包到业务容器镜像中。步骤如下:
1. 准备一个制作镜像的目录,放入 JMX Exporter 配置文件
prometheus-jmx-config.yaml。ssl: falselowercaseOutputName: falselowercaseOutputLabelNames: false
注意:
2. 准备 jar 包文件,可前往 jmx_exporter 的 Github 页面获取最新的 jar 包下载地址。执行以下命令,下载到当前目录。
wget https://repo1.maven.org/maven2/io/prometheus/jmx/jmx_prometheus_javaagent/0.13.0/jmx_prometheus_javaagent-0.13.0.jar
3. 准备 Dockerfile 文件,本文以 Tomcat 为例。
FROM tomcat:jdk8-openjdk-slimADD prometheus-jmx-config.yaml /prometheus-jmx-config.yamlADD jmx_prometheus_javaagent-0.13.0.jar /jmx_prometheus_javaagent-0.13.0.jar
4. 执行以下命令,编译镜像。
docker build . -t ccr.ccs.tencentyun.com/imroc/tomcat:jdk8
至此已完成镜像打包,您还可利用 docker 多阶段构建,省略手动下载 jar 包的步骤。Dockerfile 示例如下:
FROM ubuntu:16.04 as jarWORKDIR /RUN apt-get update -yRUN DEBIAN_FRONTEND=noninteractive apt-get install -y wgetRUN wget https://repo1.maven.org/maven2/io/prometheus/jmx/jmx_prometheus_javaagent/0.13.0/jmx_prometheus_javaagent-0.13.0.jarFROM tomcat:jdk8-openjdk-slimADD prometheus-jmx-config.yaml /prometheus-jmx-config.yamlCOPY --from=jar /jmx_prometheus_javaagent-0.13.0.jar /jmx_prometheus_javaagent-0.13.0.jar
部署 Java 应用
部署应用至 Kubernetes 时,需修改 JVM 启动参数以便启动时加载 JMX Exporter。JVM 启动时会读取
JAVA_OPTS 环境变量,作为额外的启动参数,部署时可为应用增加该环境变量。示例如下:apiVersion: apps/v1kind: Deploymentmetadata:name: tomcatspec:replicas: 1selector:matchLabels:app: tomcattemplate:metadata:labels:app: tomcatspec:containers:- name: tomcatimage: ccr.ccs.tencentyun.com/imroc/tomcat:jdk8env:- name: JAVA_OPTSvalue: "-javaagent:/jmx_prometheus_javaagent-0.13.0.jar=8088:/prometheus-jmx-config.yaml"---apiVersion: v1kind: Servicemetadata:name: tomcatlabels:app: tomcatspec:type: ClusterIPports:- port: 8080protocol: TCPname: http- port: 8088protocol: TCPname: jmx-metricsselector:app: tomcat
启动参数格式:
-javaagent:<jar>=<port>:<config>该示例使用8088端口暴露 JVM 的监控指标,您可按需自行更改。
添加 Prometheus 监控配置
配置 Prometheus,使监控数据可被采集。示例如下:
- job_name: tomcatscrape_interval: 5skubernetes_sd_configs:- role: endpointsnamespaces:names:- defaultrelabel_configs:- action: keepsource_labels:- __meta_kubernetes_service_label_appregex: tomcat- action: keepsource_labels:- __meta_kubernetes_endpoint_port_nameregex: jmx-metrics
若已安装 prometheus-operator,则可通过创建 ServiceMonitor 的 CRD 对象配置 Prometheus。示例如下:
apiVersion: monitoring.coreos.com/v1kind: ServiceMonitormetadata:name: tomcatnamespace: defaultlabels:app: tomcatspec:endpoints:- port: jmx-metricsinterval: 5snamespaceSelector:matchNames:- defaultselector:matchLabels:app: tomcat
添加 Grafana 监控面板
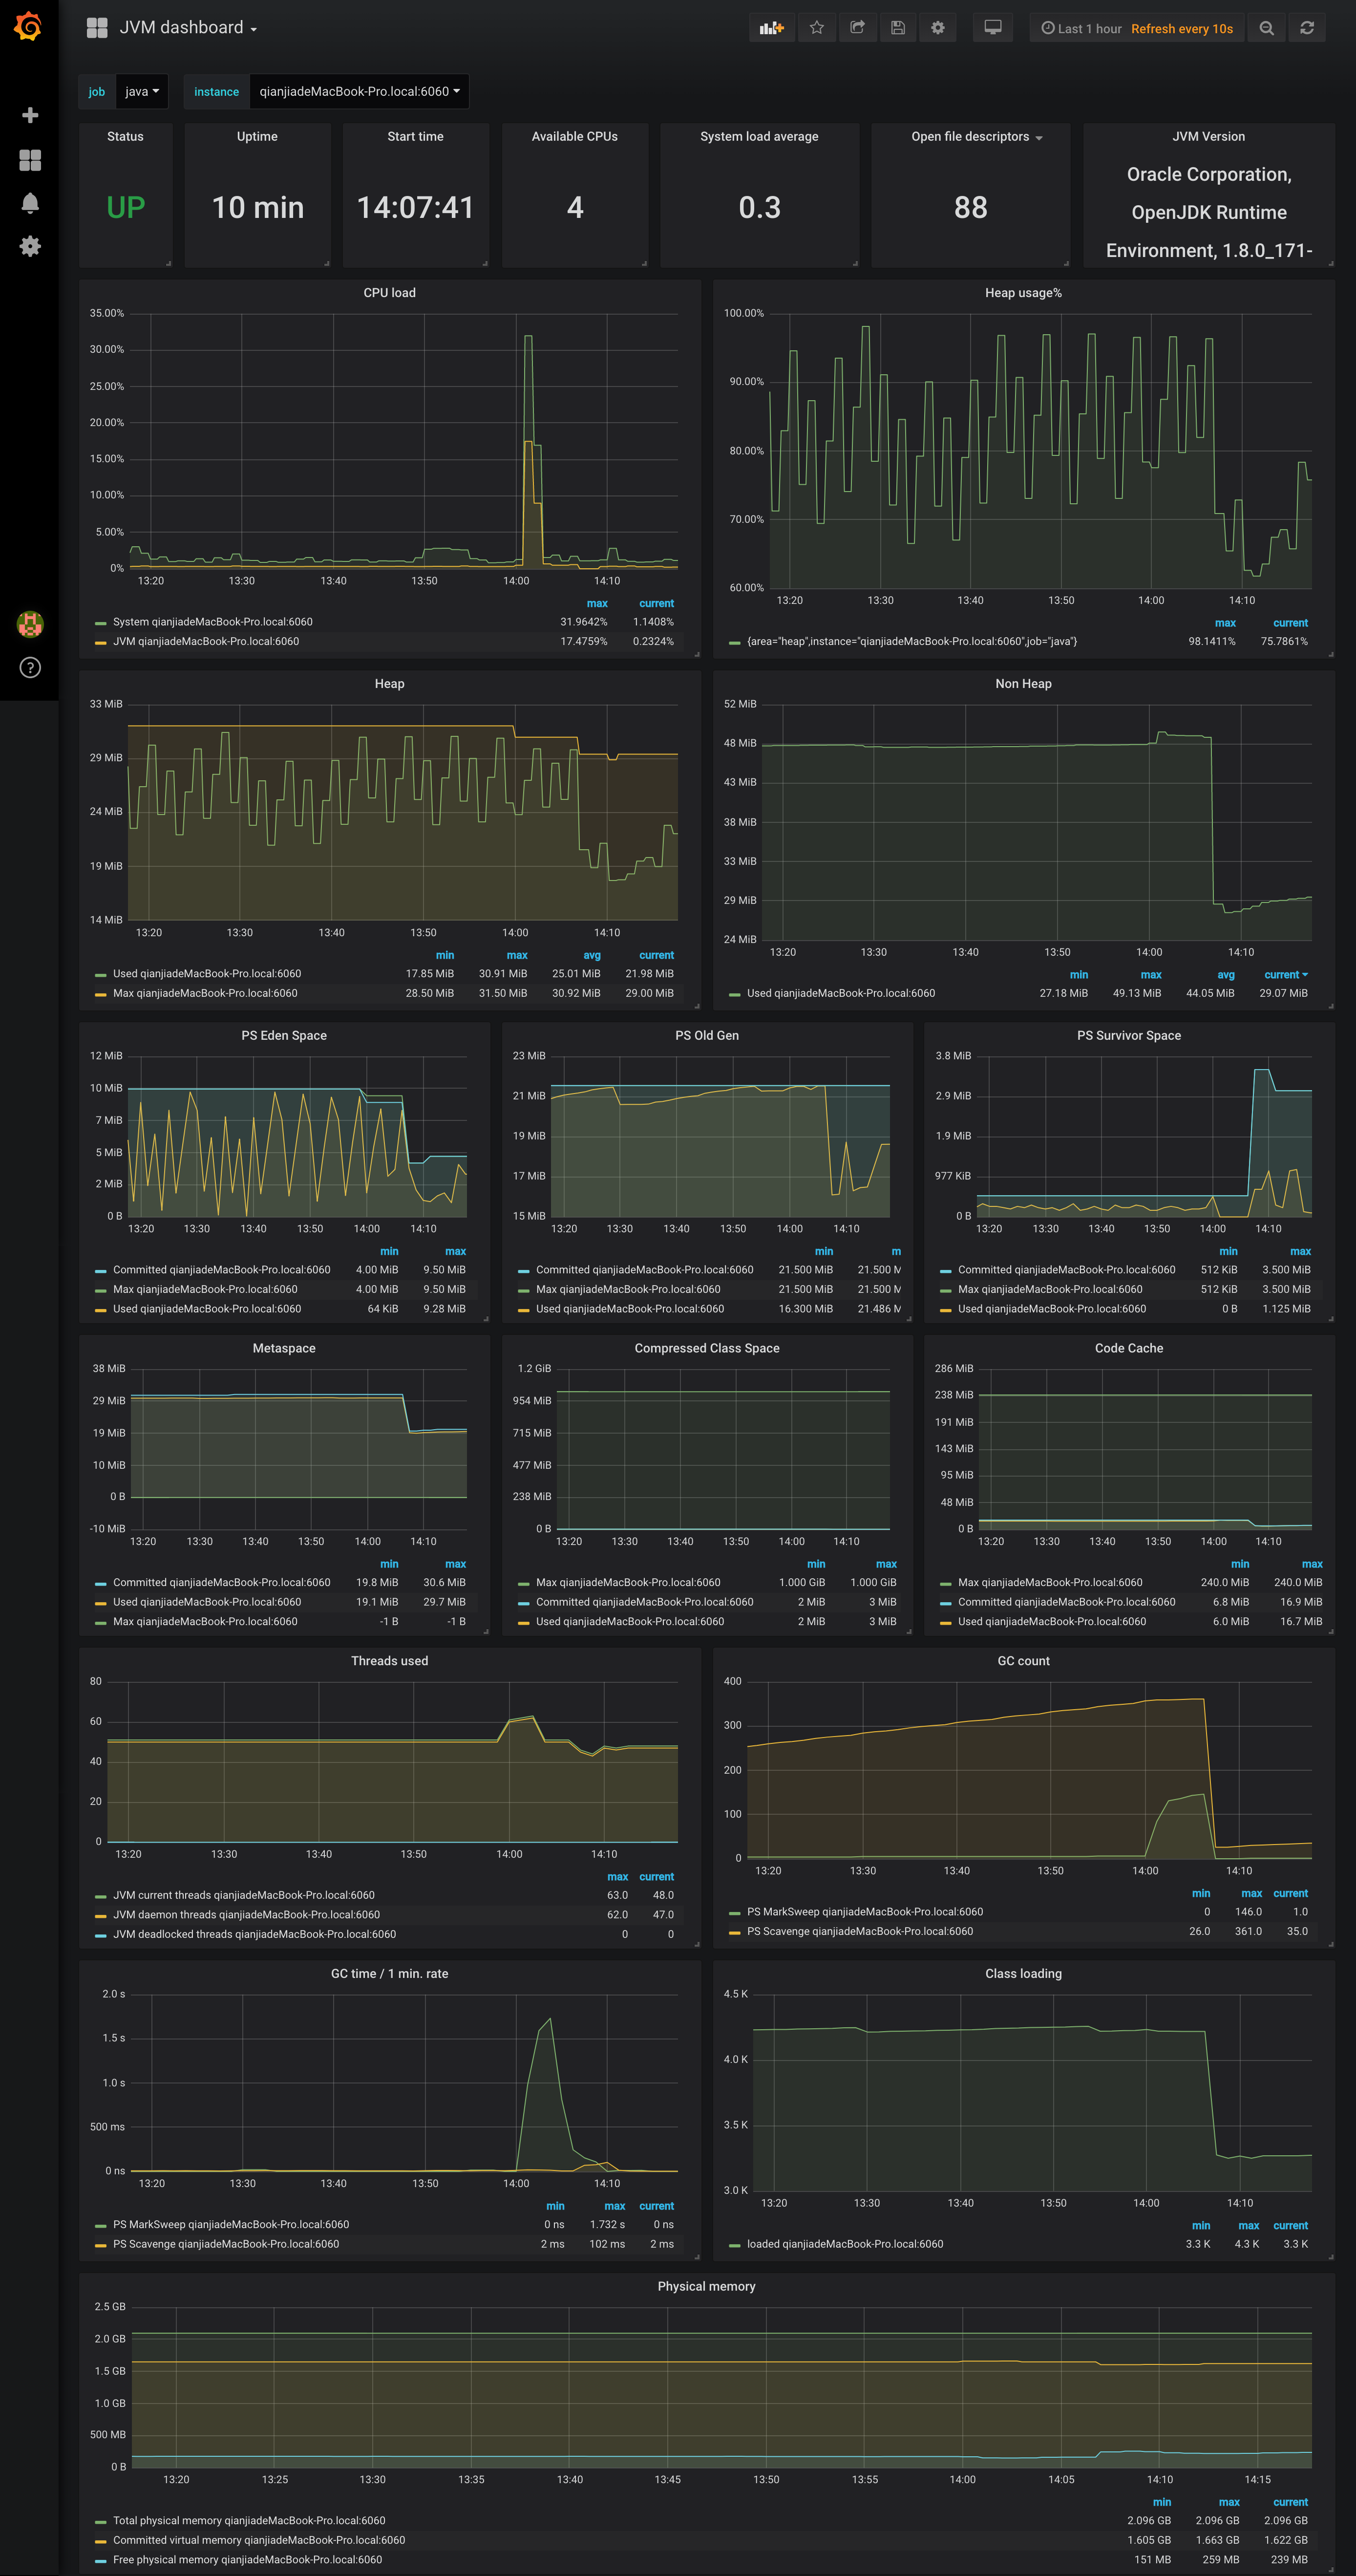
采集数据后可进行数据展示。若熟悉 Prometheus 和 Grafana,则可自行根据指标设计所需面板。您也可直接使用社区提供面板,例如 JVM dashboard。可直接导入使用,面板效果图如下:
参考资料
文档反馈