Overview
A slow query is defined as a query statement in which the query request exceeds a specified time limit. The corresponding statement is referred to as a slow query statement. The slow query feature allows you to directly view detailed command information for Memcached Edition instances in which query requests exceed 10, 20, 40, or 50 milliseconds.
Notes
Slow logs are retained for 15 days.
The default account can query up to 15,000 times per second, while custom accounts are limited to 20 queries per second.
If the process of querying results is slow, try narrowing the time range down for the query.
Querying Slow Logs
2. At the top of the instance list page on the right, select the region.
3. In the instance list, locate the target instance.
4. Click the target instance ID to enter the Instance Details page.
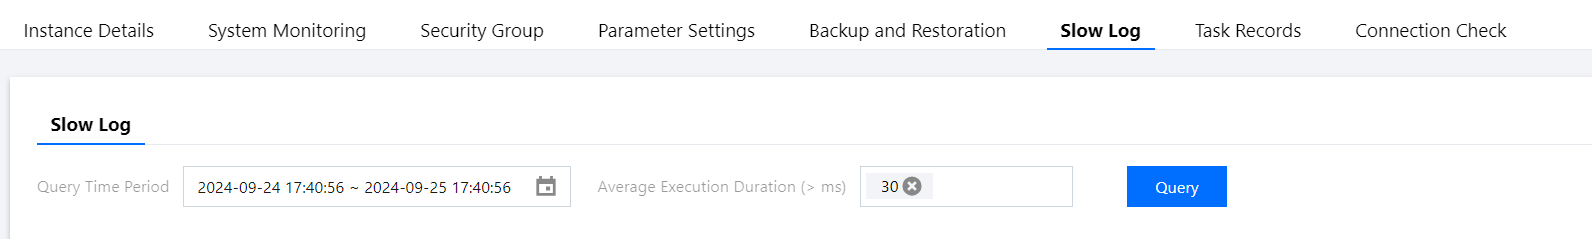
5. Click the Slow Log tab, and then select the time range under Query Time Period. In the dropdown menu under Average Execution Duration, select the threshold for command requests exceeding duration. Click Query to display the records of slow queries executed within that time range.
Exporting Slow Logs
1. On the Slow Log page, click Export at the top right.
2. In the pop-up dialog box, learn the limit on the number of slow logs that can be exported at once, and then click Export.
3. Open the exported slow log file, which is in Excel format.