Release Notes
Message Trace
Introduction
The message trace feature provided by TDMQ for MQTT fully connects upstream and downstream business information, helping you better troubleshoot anomalies and locate issues. It records the full lifecycle of a message from the time it is sent by a producer to the server to the time it is delivered to a consumer. This document introduces the core concepts and key parameter definitions of message trace, and explains how to use trace data for observability analysis to quickly identify typical failures such as "messages not received" and "consumption delays".
What Is Message Trace
Definition
A message trace refers to the complete chain of information formed by aggregating detailed data from relevant nodes throughout the entire process of a message being sent from a producer to the TDMQ for MQTT server and then consumed by a consumer. This includes timestamps, execution results, producer IP address, consumer IP address, and other details. If message delivery does not occur as expected, you can query the message trace to rapidly analyze and locate issues, enabling timely business recovery.
Composition
A complete MQTT message trace consists of the following two parts:
Message Production Trace: records the process of the producer sending the message to the broker.
Core focus: Did the producer send the message successfully? Did the server receive it successfully?
Message Consumption Trace: records the process of the broker delivering the message to all consumers with matching subscriptions.
Core focus: Which consumers subscribed to the topic. Was the message successfully pushed to each client? Did the clients return an acknowledgment (ACK)?
Scenarios
TDMQ for MQTT enables querying key data during message delivery processes. By viewing trace information, you can quickly obtain the current business processing status and promptly locate abnormal issues.
The typical application scenarios for message trace are as follows:
Scenario 1: Checking whether a specific message was successfully sent or consumed.
Confirm whether the message was successfully sent by the device.
Confirm whether the server received and persisted the message.
Confirm whether the consumer was online and included in the subscription list.
Scenario 2: Checking whether the consumption process is functioning properly.
Compare the "server receipt time" with the "delivery time to consumers".
Check whether the QoS interaction process is complete (for example, whether PUBACK is missing for QoS 1).
Scenario 3: Viewing the identity information of producers and consumers to further investigate the cause of the issue.
Check the actual client ID and IP address of the message sender and receiver to identify issues such as unauthorized connections or client ID conflicts.
Troubleshooting Consumption Exceptions with Message Trace
In actual business operations, the most common issue is "the device sent a message, but the App/server did not receive it." You can follow these steps to diagnose the issue using message trace combined with client events:
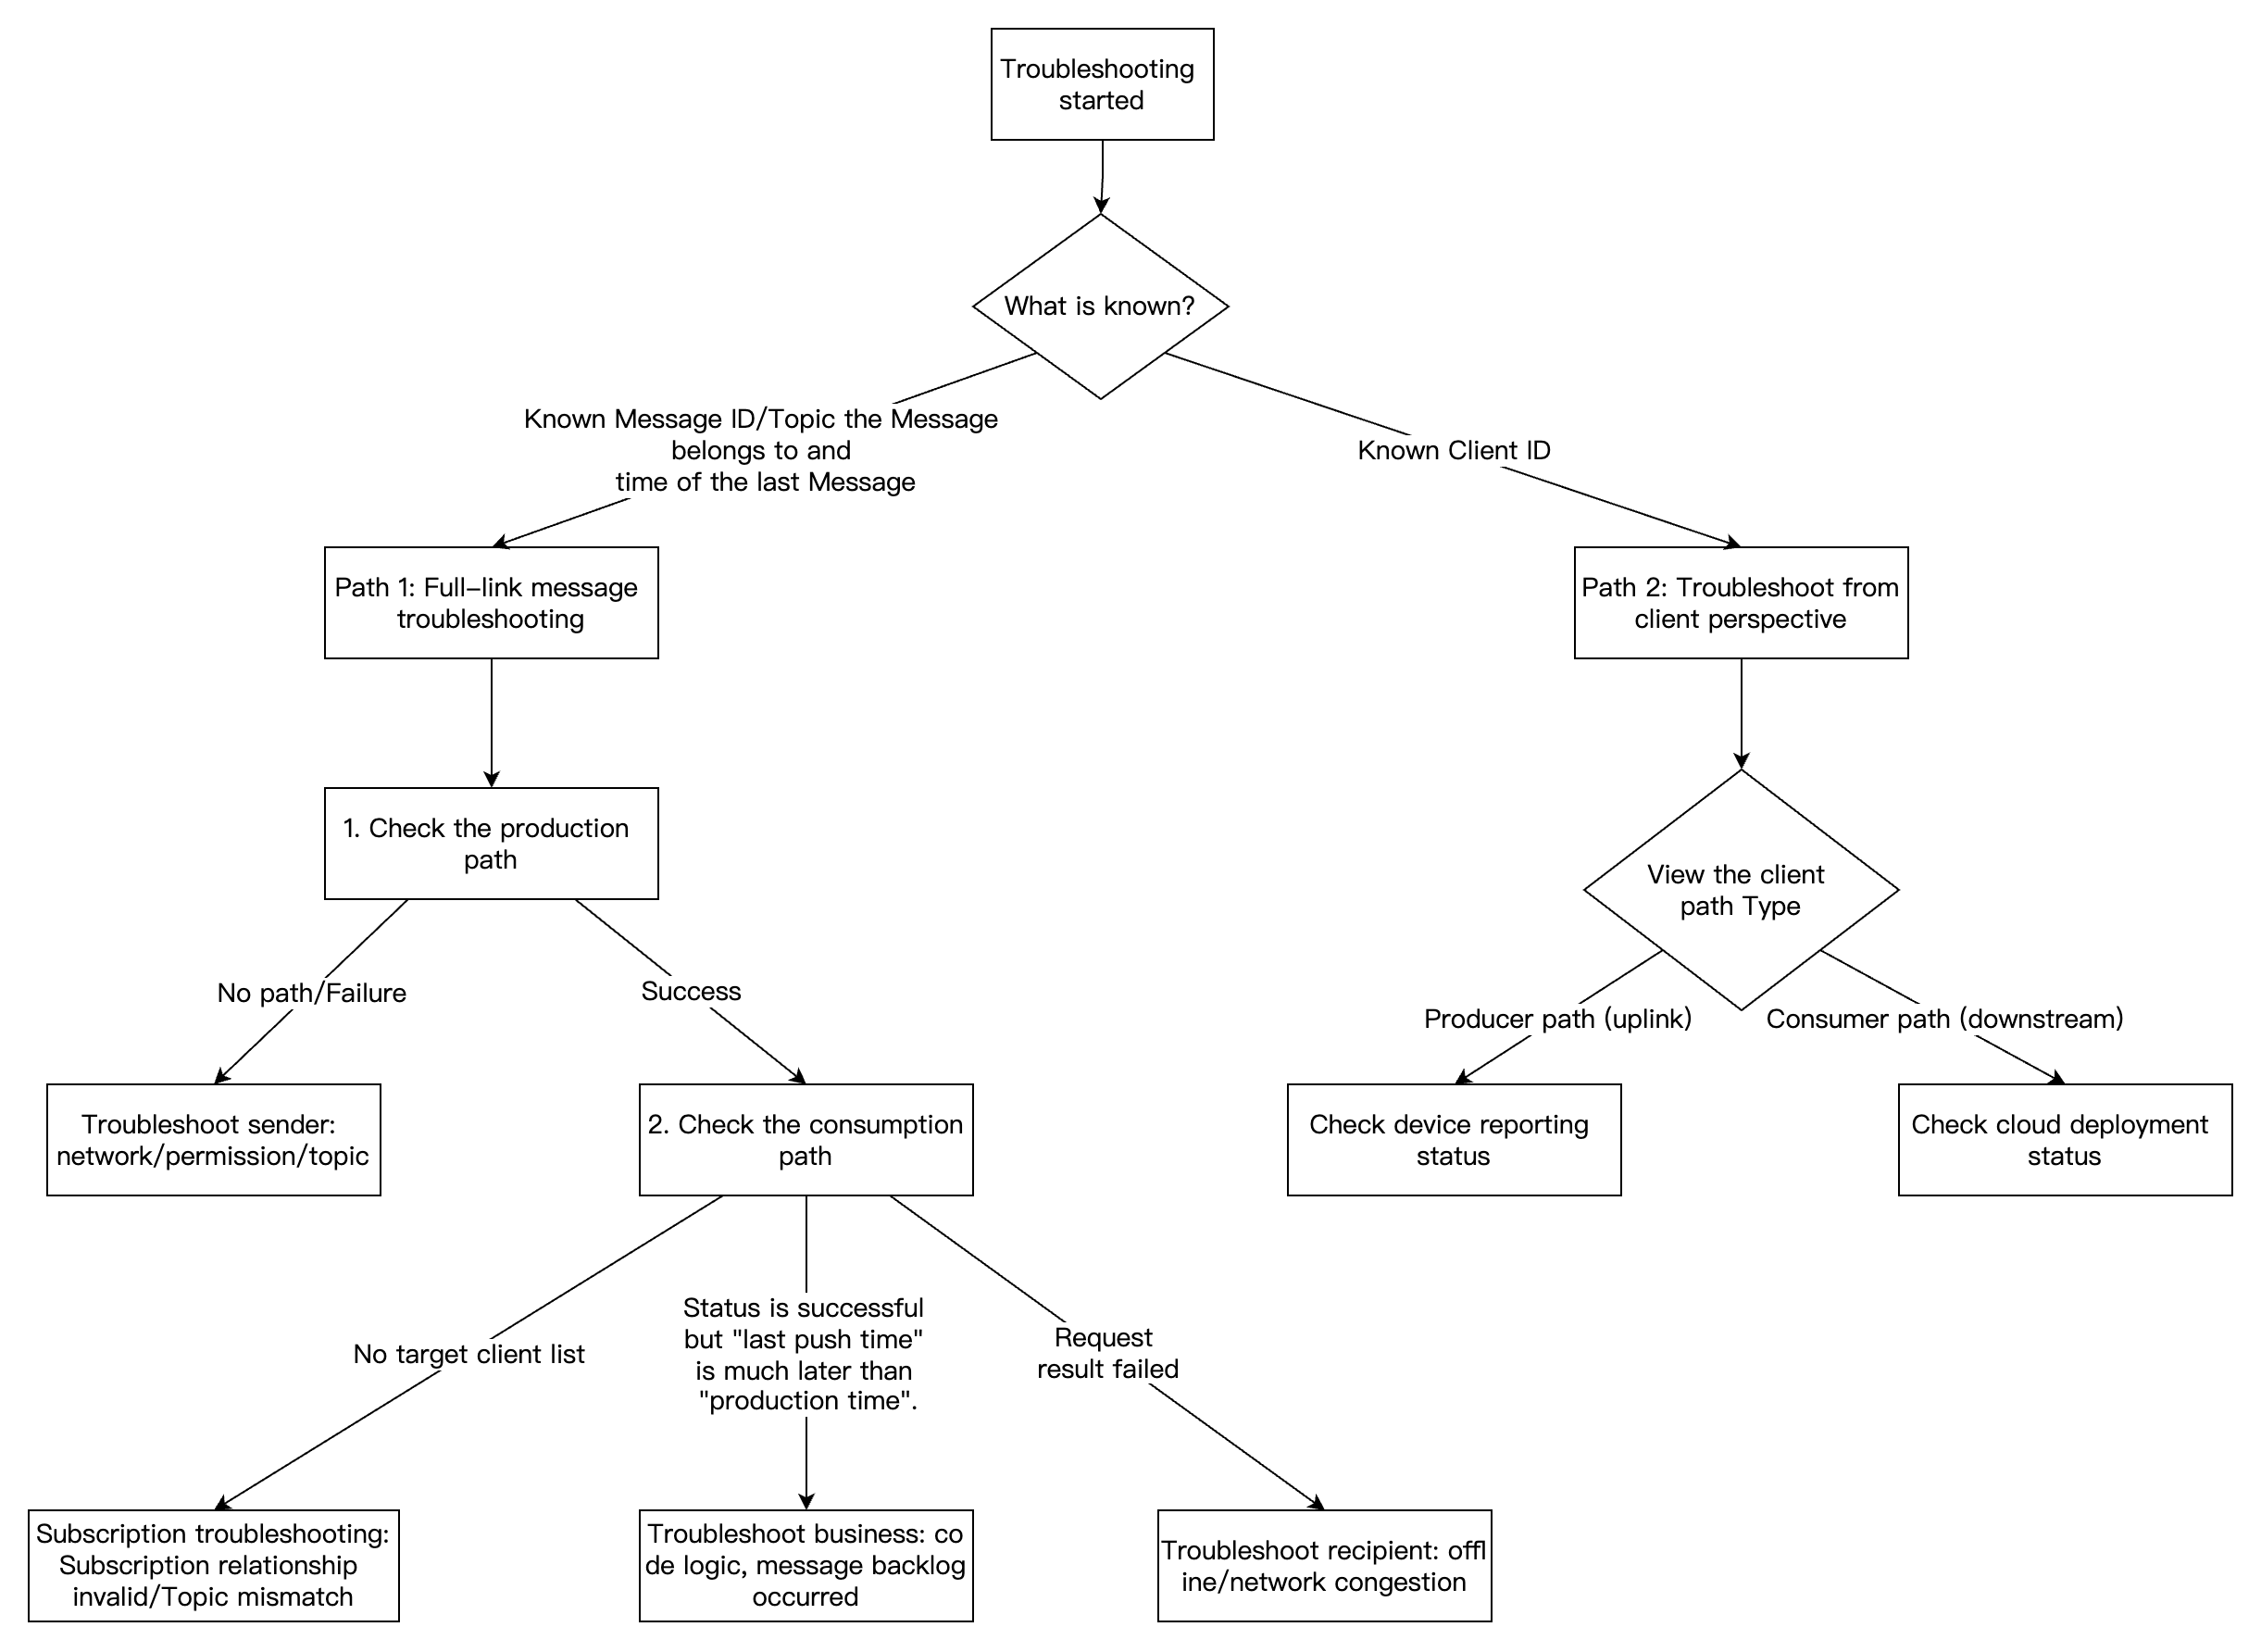
Path 1: End-to-End Troubleshooting from the Message Perspective
Scenario: You have the Message ID or the approximate time when a message was sent, and you need to know which devices consumed this message or why it was not consumed.
Entry: Console > Message Query > Message Trace.
Viewing the Message Trace of a Specific Message
Go to the Message Query page, specify the target cluster, topic (enter the accurate Topic Name or Topic Filter used during subscription), and time range to search for the target message.
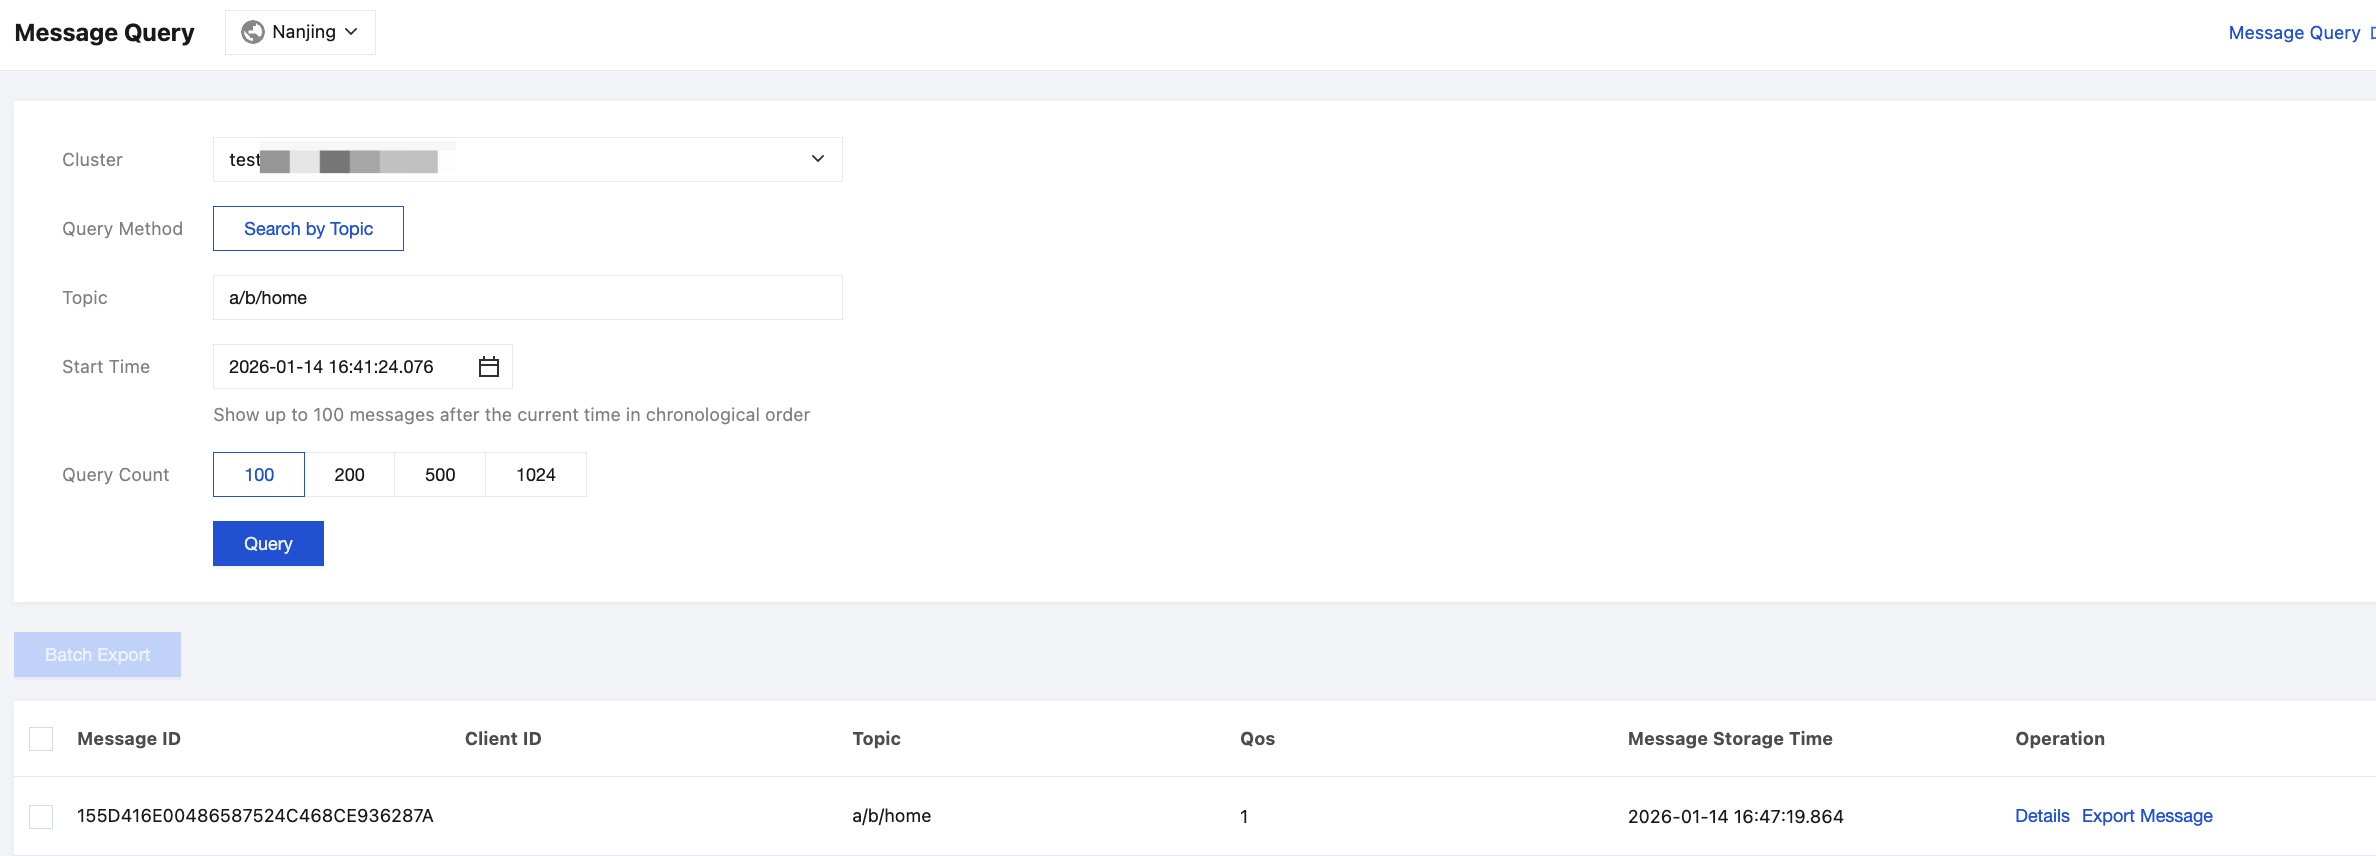
Select a specific message ID and click Details to view detailed message trace.
With this message-perspective troubleshooting method, you can identify issues and perform troubleshooting based on the following symptoms:
Checking "Message Production"
Symptom | Diagnosis | Troubleshooting/Solution Suggestion |
No trace found for the message | The message failed to reach the server. | 1. Check whether the device network is connected. 2. Check whether the device-side code captured any sending exceptions. 3. Confirm whether the topic sent by the device exactly matches the queried topic. |
Request result: Failed | The server refused to receive the message. | 1. Check whether the device has permission to publish this topic (ACL). 2. Check whether the message body size exceeds the server limit. |
Request result: Successful | The production is normal. | The producer is functioning normally. If an issue occurs, it may lie in the consumption path. |
Checking "Message Consumption"
Symptom | Diagnosis | Troubleshooting/Solution Suggestion |
Target client ID not found in the list | The consumer is not functioning properly, preventing message consumption. | 1. Check the topic filter: Determine whether the consumer's subscription rule (wildcards) match the current message's topic. 2. Check the subscription status: Determine whether the consumer is in an online subscription status (or has established a persistent session) at the time of message delivery. |
Client ID exists in the list, but the request result is Failed | The push from the cloud failed, resulting in the consumer not receiving the message. | 1. Check whether the consumer device is offline. 2. Check the consumer's network condition (e.g., weak network environment). |
Last Push Time >> Production Time (significant time gap) | Message consumption is backlogged or delayed. | 1. The consumer's processing logic is too slow, blocking the MQTT thread. 2. Frequent client connection and disconnection causes messages to queue up on the server. 3. If shared subscription is used, check whether the number of consumers in the shared subscription group is appropriate. |
QoS packet not completed | QoS acknowledgment is abnormal. | Message trace details the request result and timestamp for each request packet during message production and consumption. QoS 0 Normal process: The server pushes PUBLISH. If the request fails, it may be caused by an unstable TCP connection. QoS 1 Normal flow: The server pushes PUBLISH, and the client replies with PUBACK. If there is only PUBLISH but no PUBACK, it means that the client received the message but did not return an acknowledgment to the server. The server will consider the delivery failed and continuously retry, causing message duplication or blocking. QoS 2 Normal flow: PUBLISH -> PUBREC -> PUBREL -> PUBCOMP. If the flow is interrupted at any intermediate step, it is generally determined that the loss of acknowledgment packets is caused by an unstable network link. |
Path 2: Troubleshooting from the Client Perspective
Scenario: You need to focus on a specific device (e.g., Device A reports failure to receive commands or unsuccessful data reporting) and view all sending and receiving records of the device.
Entry: Console > Client > Click a specific Client ID > Client Message Trace tab.
Viewing Client Message Trace
Go to the Client page and search for the client ID.
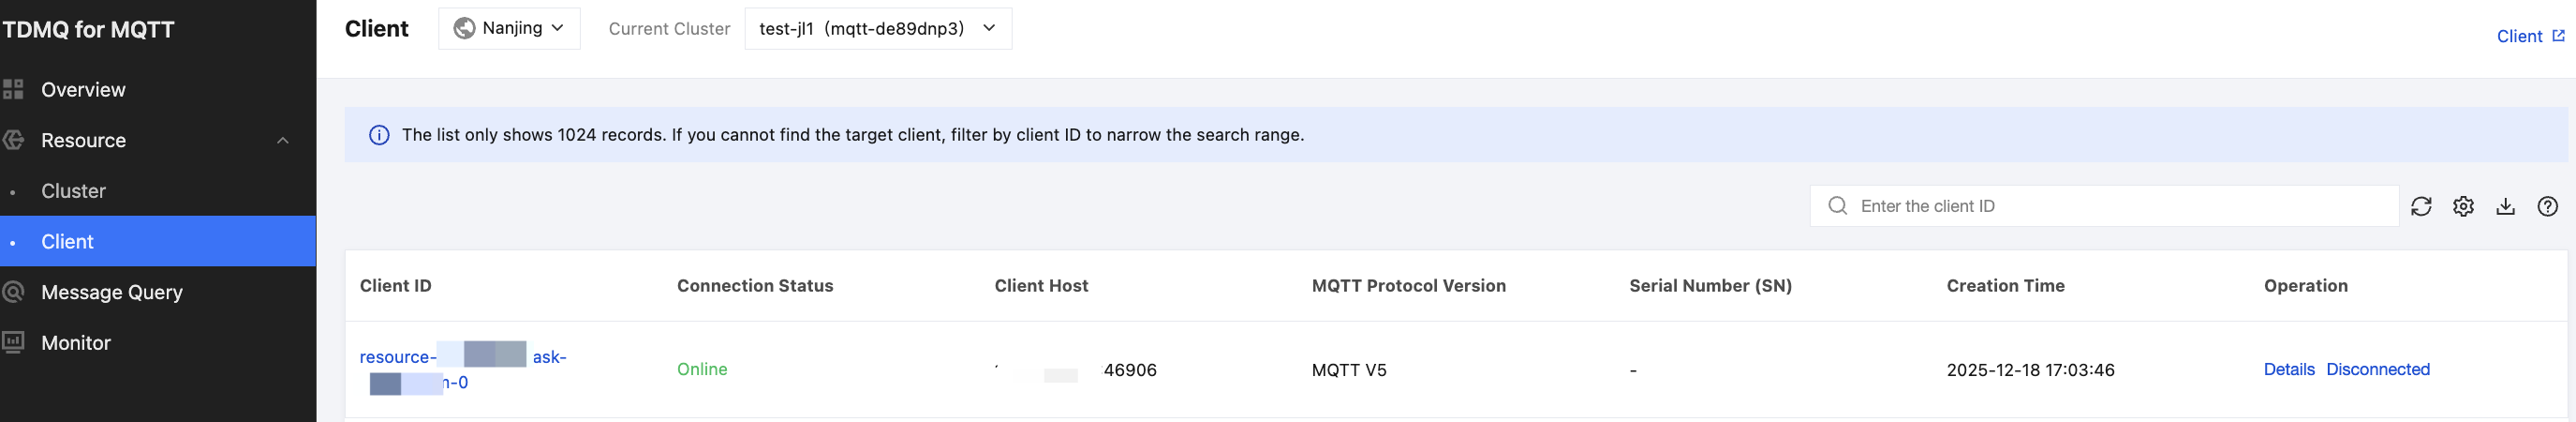
Click Details to view the client's basic information and session details.
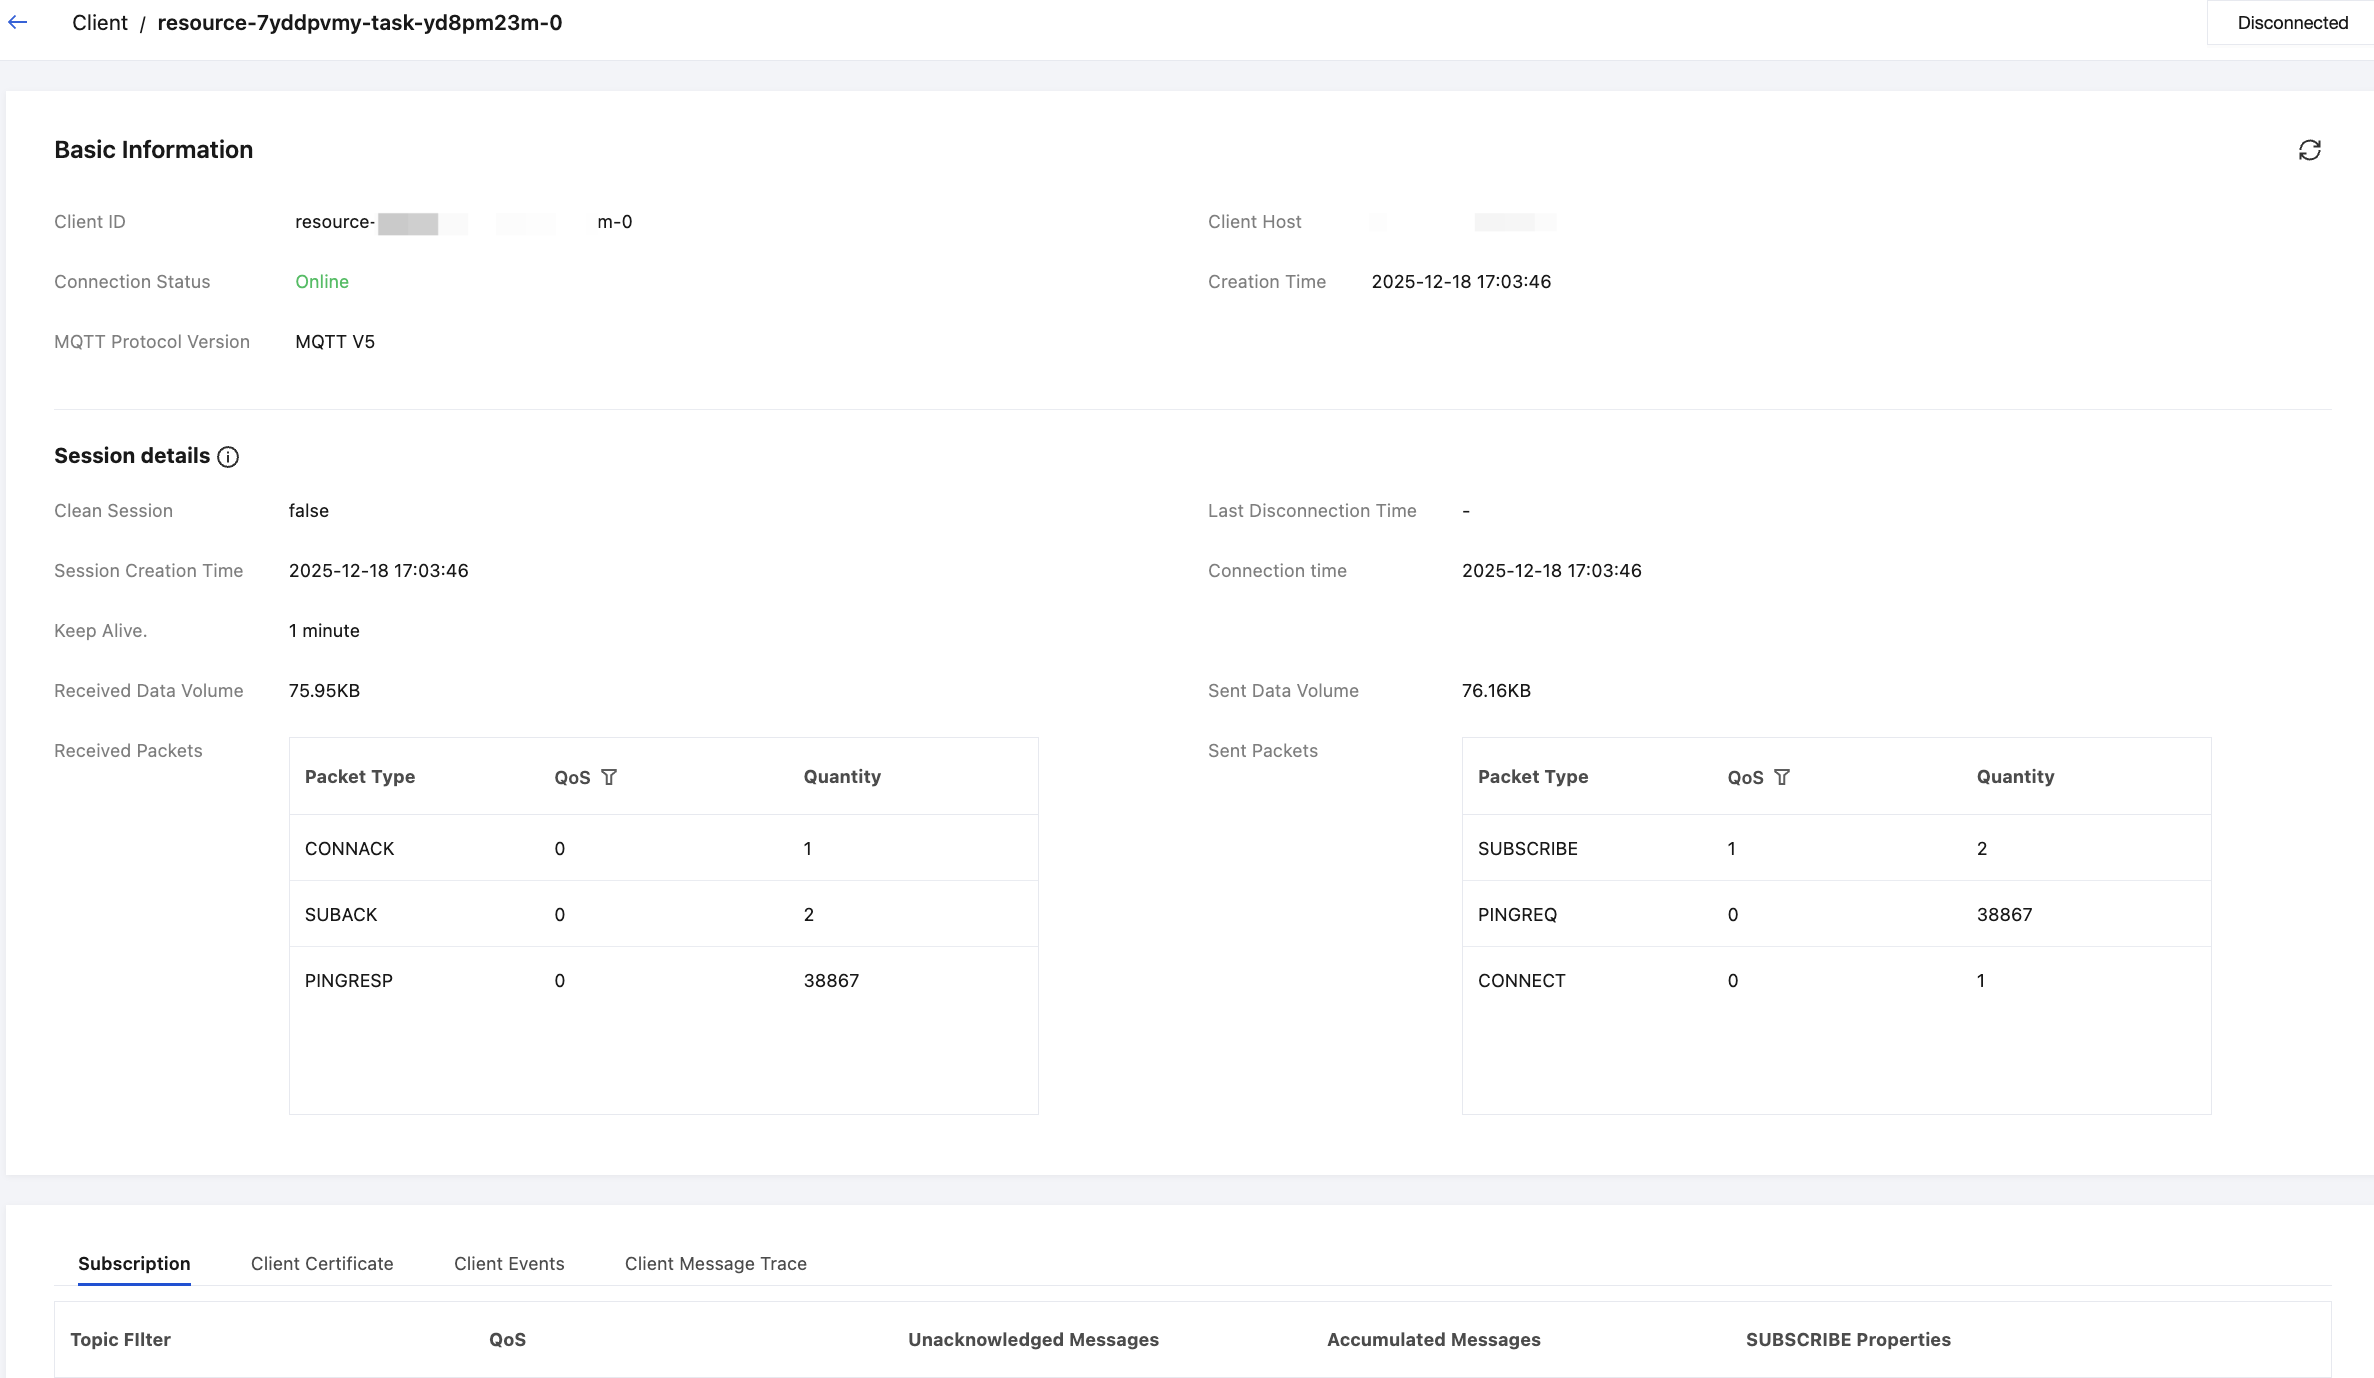
On the Tab, you can select to view the client message trace.
In this view, the system filters out all traces related to the device, including messages it sends (as a producer) and receives (as a consumer).
Producer: Represents the record of this device reporting data to the cloud.
Consumer: Represents the record of the cloud delivering commands/pushing messages to this device.
Producer Issues
1. Filter or search for records where Client Type is Producer to confirm whether the message was successfully delivered to the MQTT instance.
2. If no producer records are found, check whether the producer parameters in the device code are correct and whether the device successfully initiated the network request.
If it is confirmed through the above methods that the message has indeed been stored by the TDMQ for MQTT server, you can focus on troubleshooting whether there are any abnormalities in the subsequent message consumption process.
Consumer Issues
If you suspect that the device is not receiving commands, filter or search for records where Client Type is Consumer:
No "Consumer" records in the list.
Conclusion: The cloud has not pushed any messages to this device.
Possible reasons: The device may have gone offline (the broker stops pushing messages if it considers the device offline), or the publisher sent the message to an incorrect topic (resulting in a mismatch with the device's subscription).
Records exist, but clicking Details shows no ACK.
Conclusion: The cloud delivered the message, and the device (potentially) received it, but the device froze and failed to respond with an ACK.
Recommendation: Check whether the device's business logic is blocking the MQTT client thread.
Appendix: Parameter Descriptions for Message Trace
Message Production Parameters (Uplink)
Parameter | Description | Troubleshooting Note |
Request Time | Time when the publisher client (producer) sends a request packet to the server. | Indicates when message production starts. |
Request Packet Type | Request packet type: PUBLISH: Publish message. PUBACK: Publish acknowledgment, a response to a QoS 1 PUBLISH packet. PUBREC: Publish received, the first acknowledgment at QoS level 2, indicating that a QoS 2 message is received. PUBREL: Publish Released, the second step at QoS level 2. It is the sender's response to PUBREC, indicating a request to release the message that was preliminarily acknowledged. PUBCOMP: Publish complete, the final acknowledgment at QoS level 2, indicating that the entire message delivery process for the QoS 2 message is fully completed. | PUBLISH: The message is being sent. PUBACK: QoS 1 acknowledgment. |
Client ID | The unique identifier of the client that published this message, used to trace the source of the message. | Helps to identify the source and rule out "dirty data". |
QoS | Quality of Service (QoS) level of a message, which determines the reliability and guarantee of message delivery, including 0 (at most once), 1 (at least once), and 2 (exactly once). | Determines the reliability mechanism for message delivery. |
Request Result | Server's processing result for the message publishing request. | Success: The server received the message. Failure: The request was rejected. |
Message Consumption Parameters (Downlink)
Parameter | Description | Troubleshooting Note |
Client ID | Unique identifier of the target client to which the server delivers the message. | If the expected ID is not displayed here, it indicates that the device did not subscribe successfully. |
QoS | Quality of Service (QoS) level of a message, which determines the reliability and guarantee of message delivery, including 0 (at most once), 1 (at least once), and 2 (exactly once). | Determines the reliability mechanism for message delivery. |
Last Push Time | Time when the server last pushed the message to the client. | If this time is continuously updated, it indicates that the server is retrying the delivery. |
Request Result | Final result of the server's message delivery attempt. | Success: The delivery flow is complete. Failure: Expand the details to identify which packet caused the failure. |
Click the right-pointing triangle below the client ID to view the request details of the server pushing the message.
Parameter | Description | Troubleshooting Note |
Request Time | Time when the server sends the request packet to the target client (consumer). | Indicates when message consumption starts. |
Request Packet Type | Request packet type: PUBLISH: Publish message. PUBACK: Publish acknowledgment, a response to a QoS 1 PUBLISH packet. PUBREC: Publish received, the first acknowledgment for QoS 2, indicating that a QoS 2 message was received. PUBREL: Publish release, the second step for QoS 2. It is the sender's response to PUBREC, indicating a request to release the message that was preliminarily acknowledged. PUBCOMP: Publish complete, the final acknowledgment for QoS 2, indicating that the entire message delivery process for the QoS 2 message is completed. | End-to-end latency can be calculated in combination with the production timestamp. |
Request Result | Processing result of the client for the message delivery request. | Focus on whether any ACK‑type packets are returned. |
Help and Support
Was this page helpful?
You can also Contact sales or Submit a Ticket for help.
Help us improve! Rate your documentation experience in 5 mins.
Feedback