TDMQ for MQTT supports continuous monitoring of resource status under your account. You can view monitoring data for various MQTT resources in real time in the console to monitor cluster health.
Viewing Cluster Monitoring
2. In the left sidebar, click Monitoring Dashboard, and select the region and cluster.
3. Select the Cluster Monitoring tab, set the time range, and view the cluster monitoring data.
Viewing Topic Monitoring
TDMQ for MQTT supports automatic topic creation. You don't need to create topics in advance when messaging. Additionally, to help you manage topics, TDMQ for MQTT lets you view monitoring metrics for specified topic prefixes. For example, if you use topic "AAA" when messaging, this topic serves as a top-level prefix. You can then view monitoring data for all related sub-topics under this prefix, such as "AAA/1", "AAA/2", and "AAA/BBB/CCC". This lets you monitor business metrics for each topic prefix in real time.
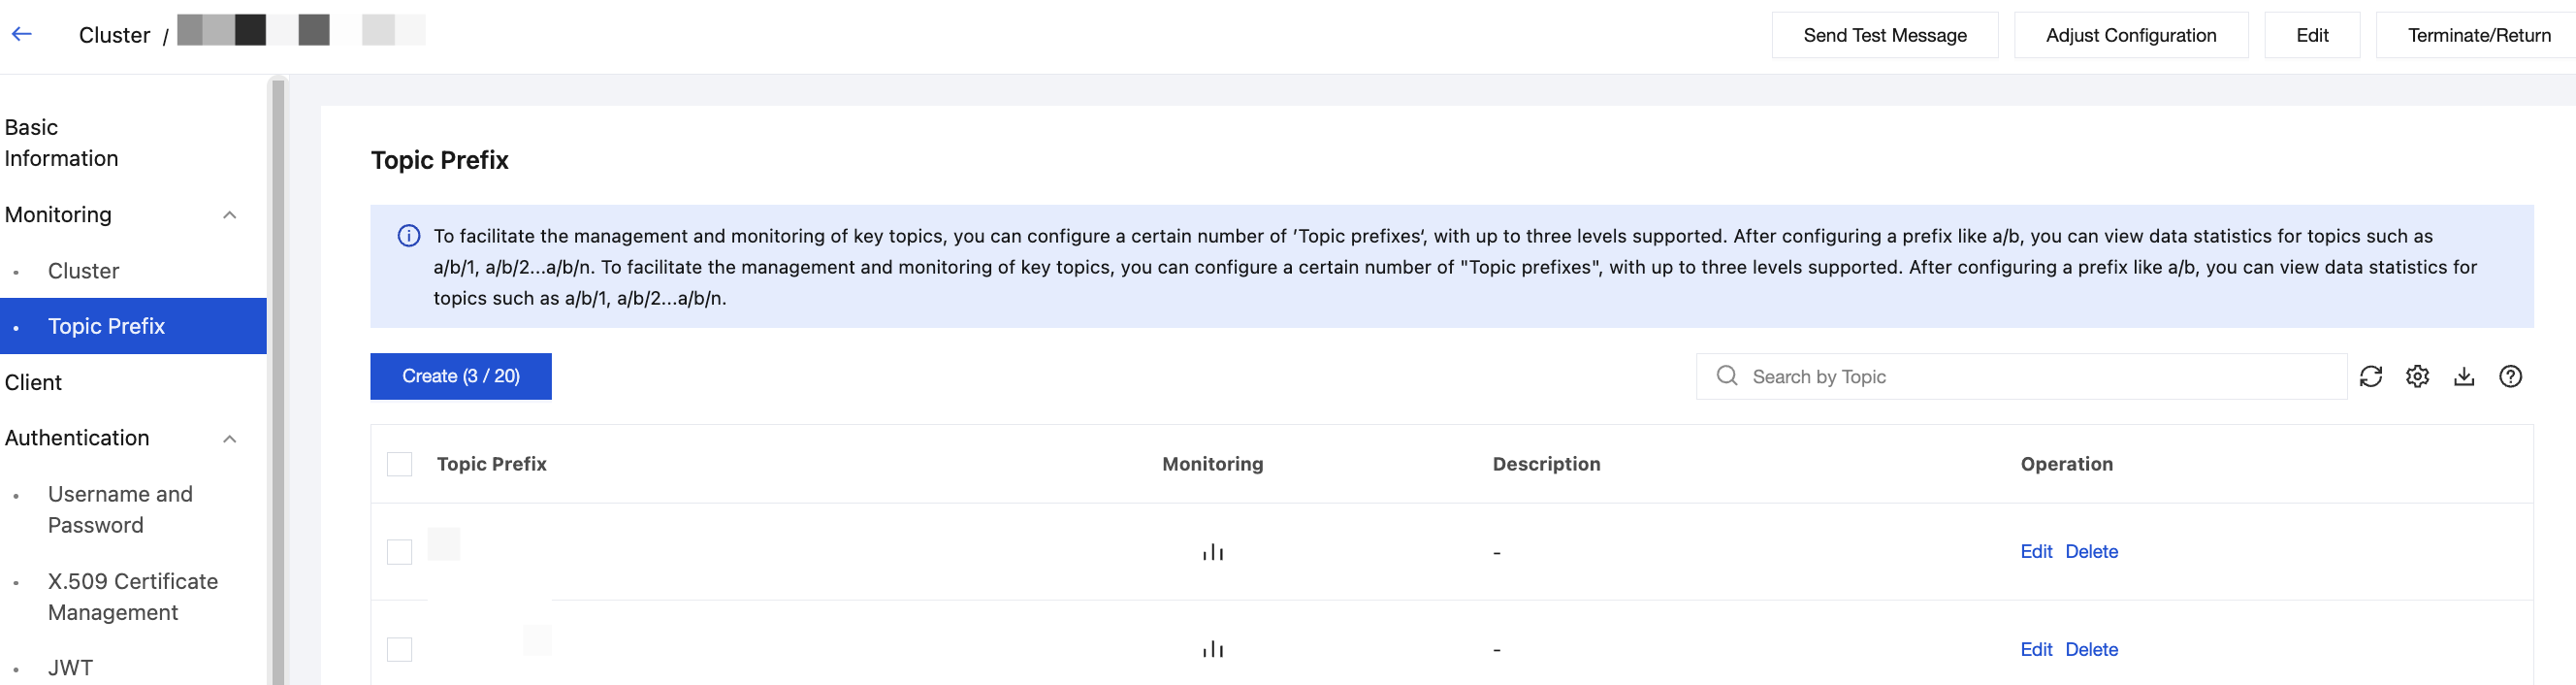
To facilitate management and monitoring of key topics, you can configure topic prefixes in the console, with support for up to three levels. For example, after configuring the "a/b" prefix, you can view metrics for topics such as "a/b/1", "a/b/2", ..., "a/b/n".
Each cluster supports up to 300 topic prefixes.
Creating a Topic Prefix
2. In the left sidebar, click Cluster Management. Select a region and click the target cluster ID to enter the Cluster Basic Information page.
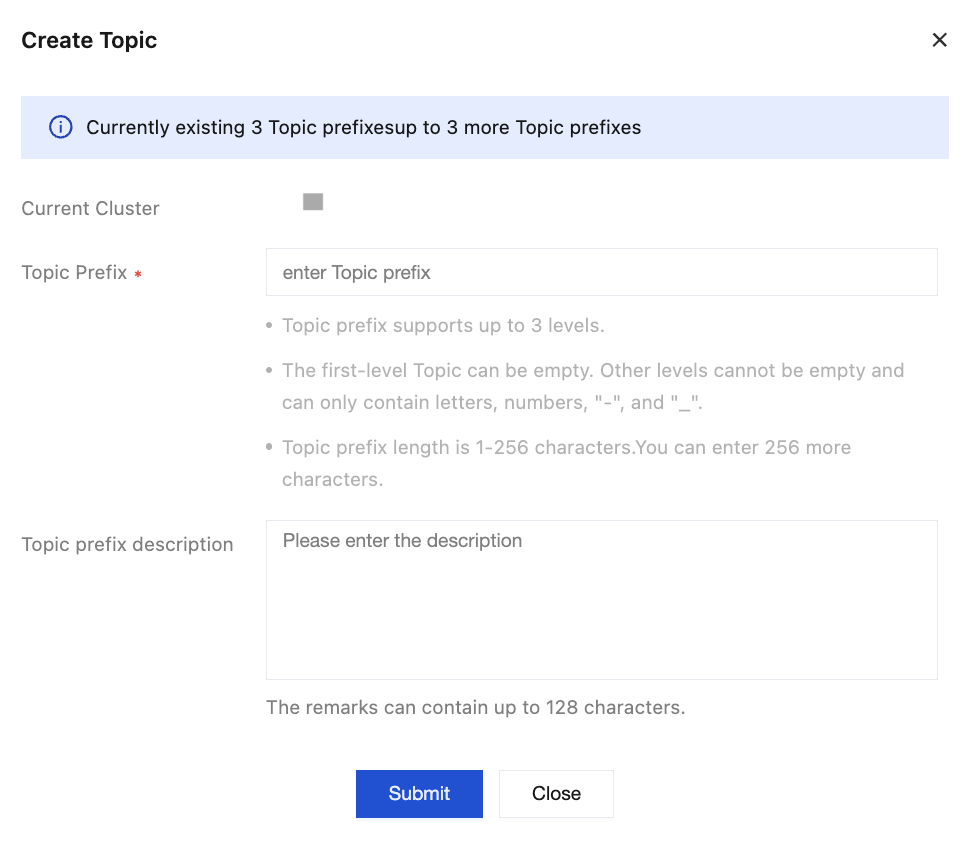
3. Choose the Monitoring > Topic Monitoring tab. Click Create in the upper-left corner, and enter the Topic prefix and description in the pop-up window.
|
Topic Prefix | A topic prefix supports up to three levels. The first level can be empty. Other levels cannot be empty and can contain only letters, numbers, hyphens (-), and underscores (_). Topic prefix length: 1–256 characters. |
Topic Prefix Description | Maximum length: 128 characters. |
4. Click Submit to complete the creation.
Viewing Topic Monitoring Data
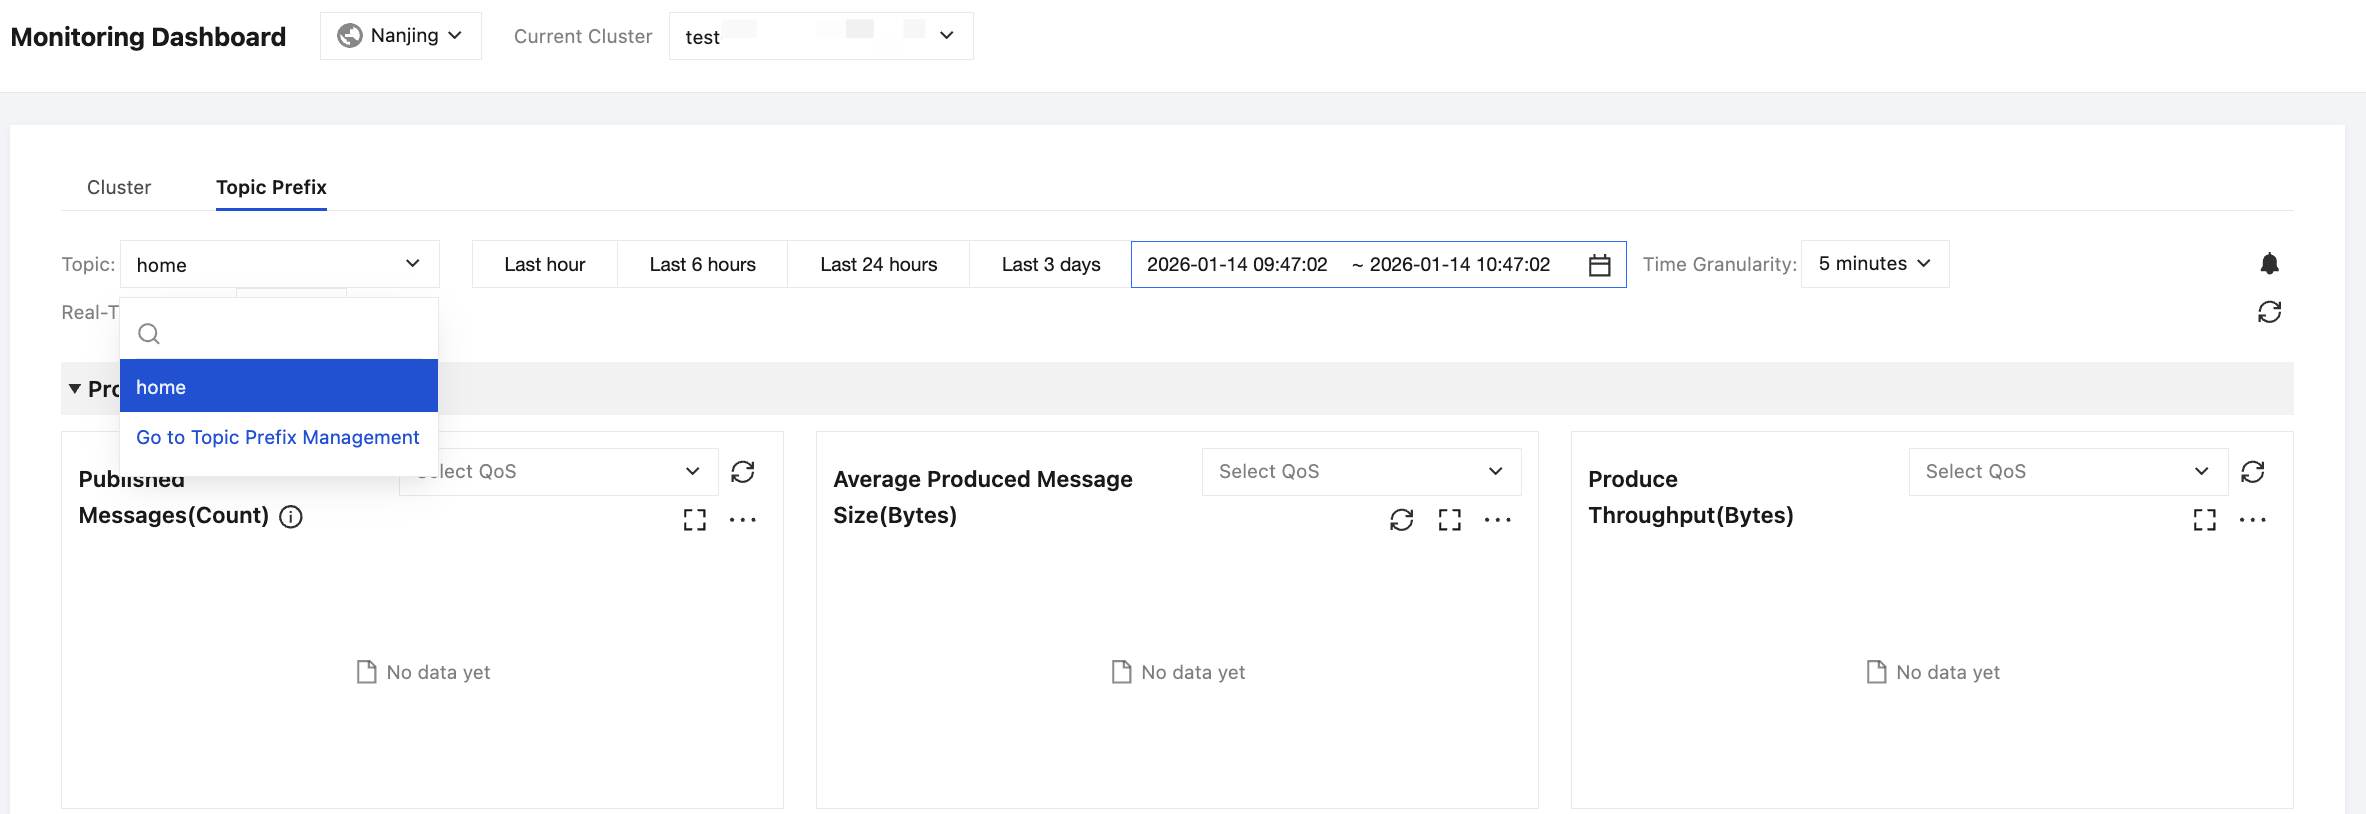
2. In the left sidebar, click Monitoring Dashboard, and select the region and cluster.
3. Select the Topic Monitoring tab. In the dropdown list, select the topic prefix you want to view, set the time range, and view the topic monitoring data.
Viewing Shared Subscription Monitoring
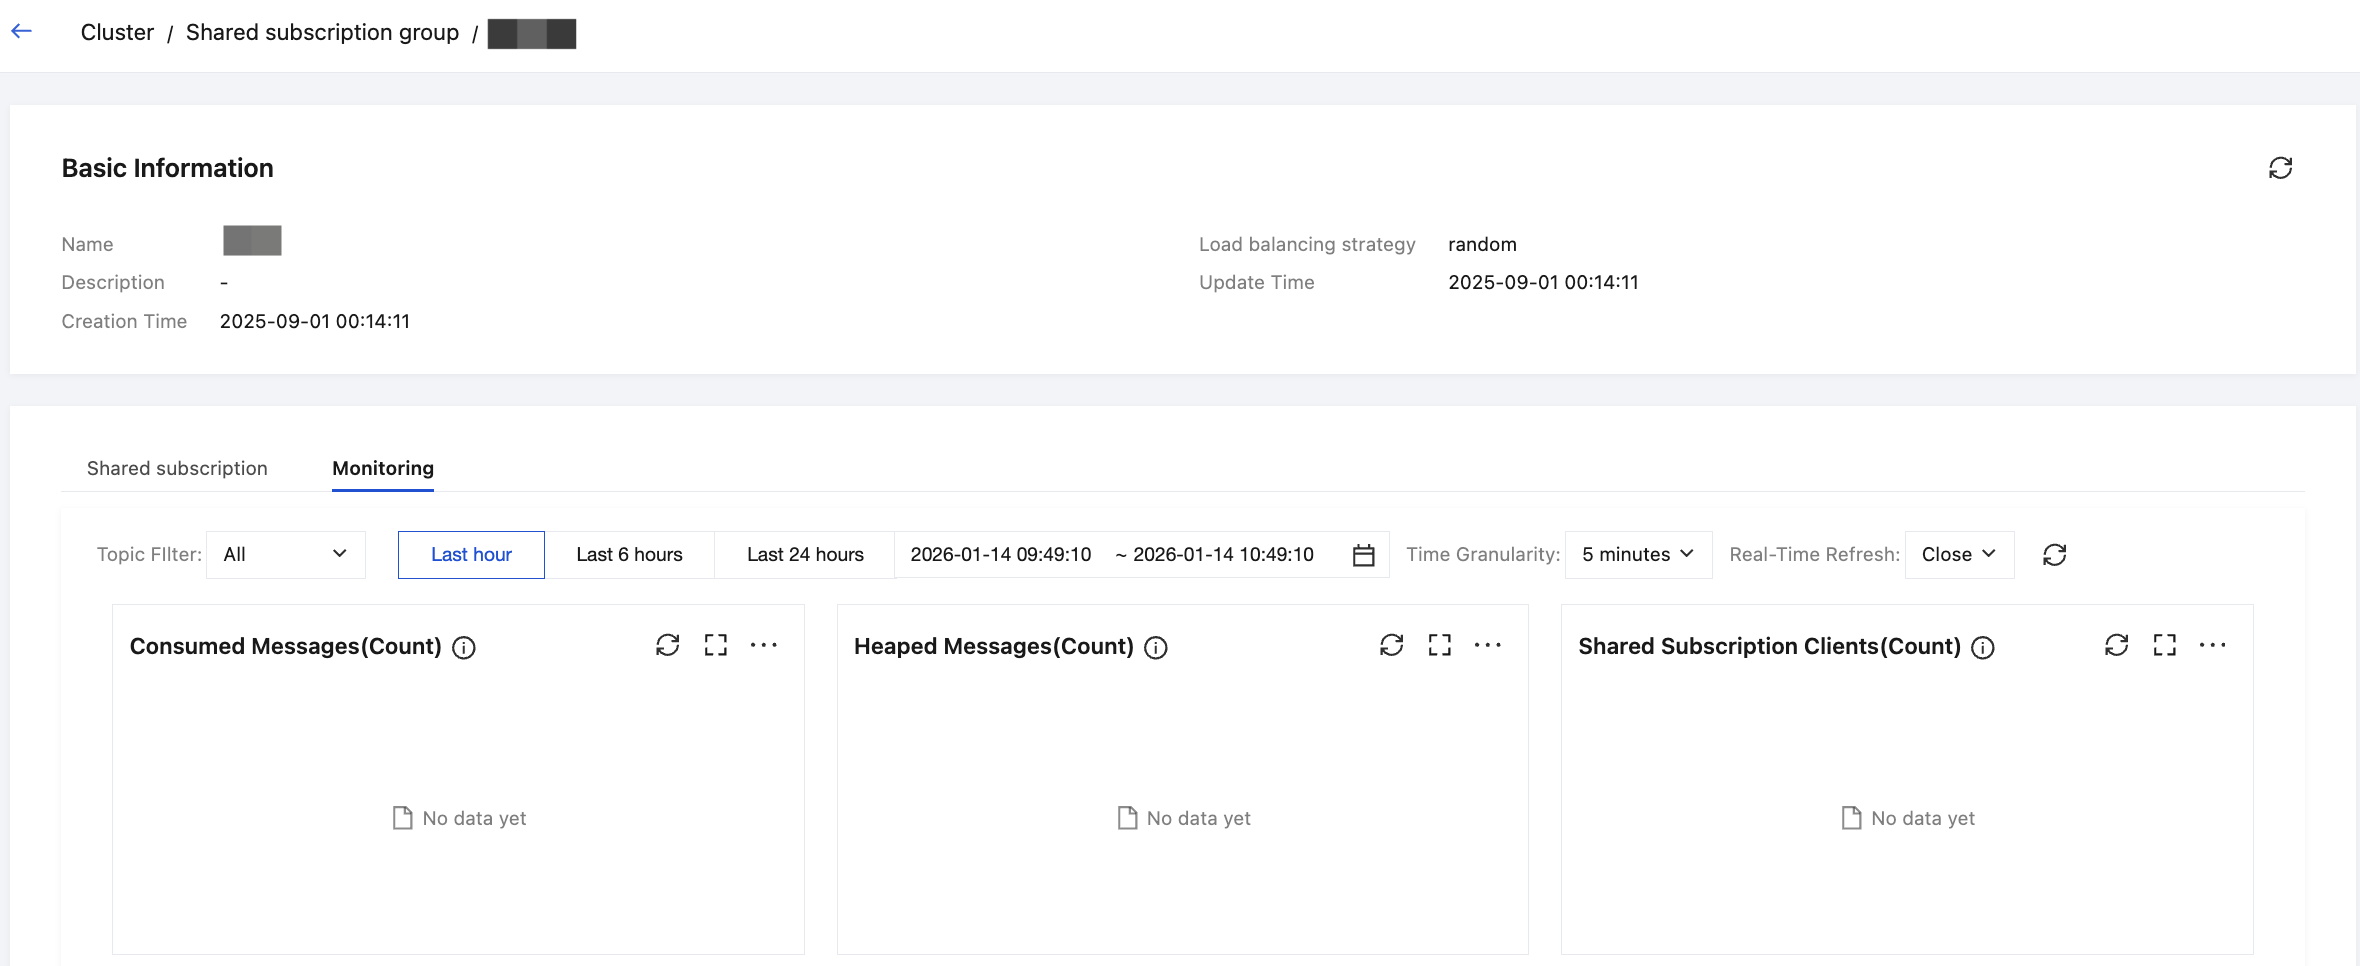
2. Choose Cluster Management > Shared Subscription Group Management and select the specified shared subscription group.
3. Select the Monitoring tab, choose the subscription pattern you want to view from the dropdown, specify the time range, and view the monitoring data.
Time Selector
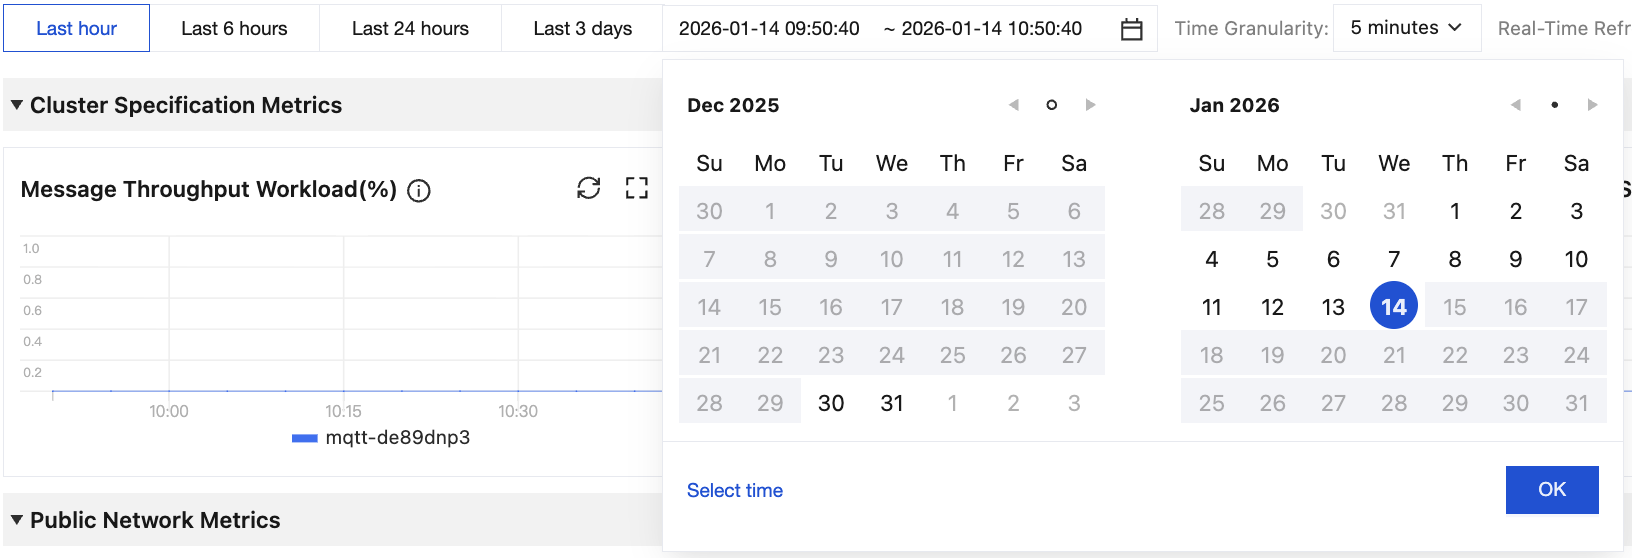
You can flexibly control monitoring data display through the following features: free time range selection, time granularity adjustment, and refresh frequency adjustment.
|
Time Range Selection |
| Time selection box. Click to select the monitoring time range for chart display. By default, data from the last hour is displayed. Select a specified time interval quickly via the time values at the top. Select a broader time range via the calendar. Select a time range accurate to the second via Select Time in the lower-left corner. |
Time Granularity | | Time granularity. Click to select 1 minute or 5 minutes. |
Real-Time Refresh | | Real-time refresh interval. Click the dropdown on the right to set the overall auto-refresh interval for the chart. Supported intervals: 30 seconds, 1 minute, 5 minutes, or off. |
Chart Icons
For each monitoring chart provided by MQTT, you can perform the following operations:
Operation | Icon | Description |
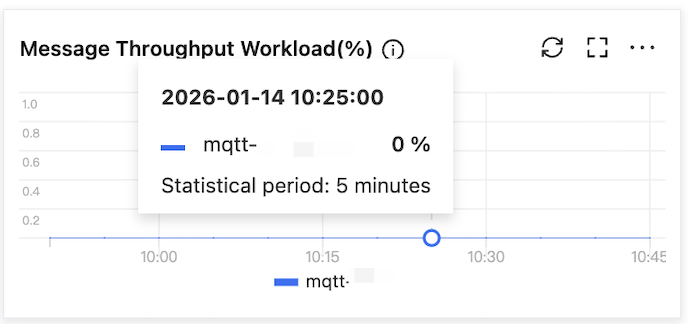
Viewing Data | | Hover over the chart to view data details at the corresponding time point. |
Refreshing Data | | Click to refresh the monitoring chart with the latest data. |
Full-Screen Display | | Click to display the corresponding chart in full screen. Press Esc or click the close icon in the upper-right corner to exit full-screen mode. |
Data Export | | Click to export chart data in CSV format or chart content in PNG format. |