解读报告
Download
聚焦模式
字号
概述
云压测会将一次压测的结果展示在压测报表中。压测报表分为实时报表和历史报表两种状态,前者供您在压测过程中实时查看数据,后者供您在压测结束后查看历史数据。
说明:
云压测历史报表保留期限为45天,45天后将自动清理过期报告。您可以在报告过期前下载 PDF 格式压测报告作为备份。
实时报表
当您触发运行您的压测场景,PTS 经过一些资源准备步骤后,会为您创建出一个压测任务,在控制台动态展示该任务的压测数据,并以一定的频率实时刷新。
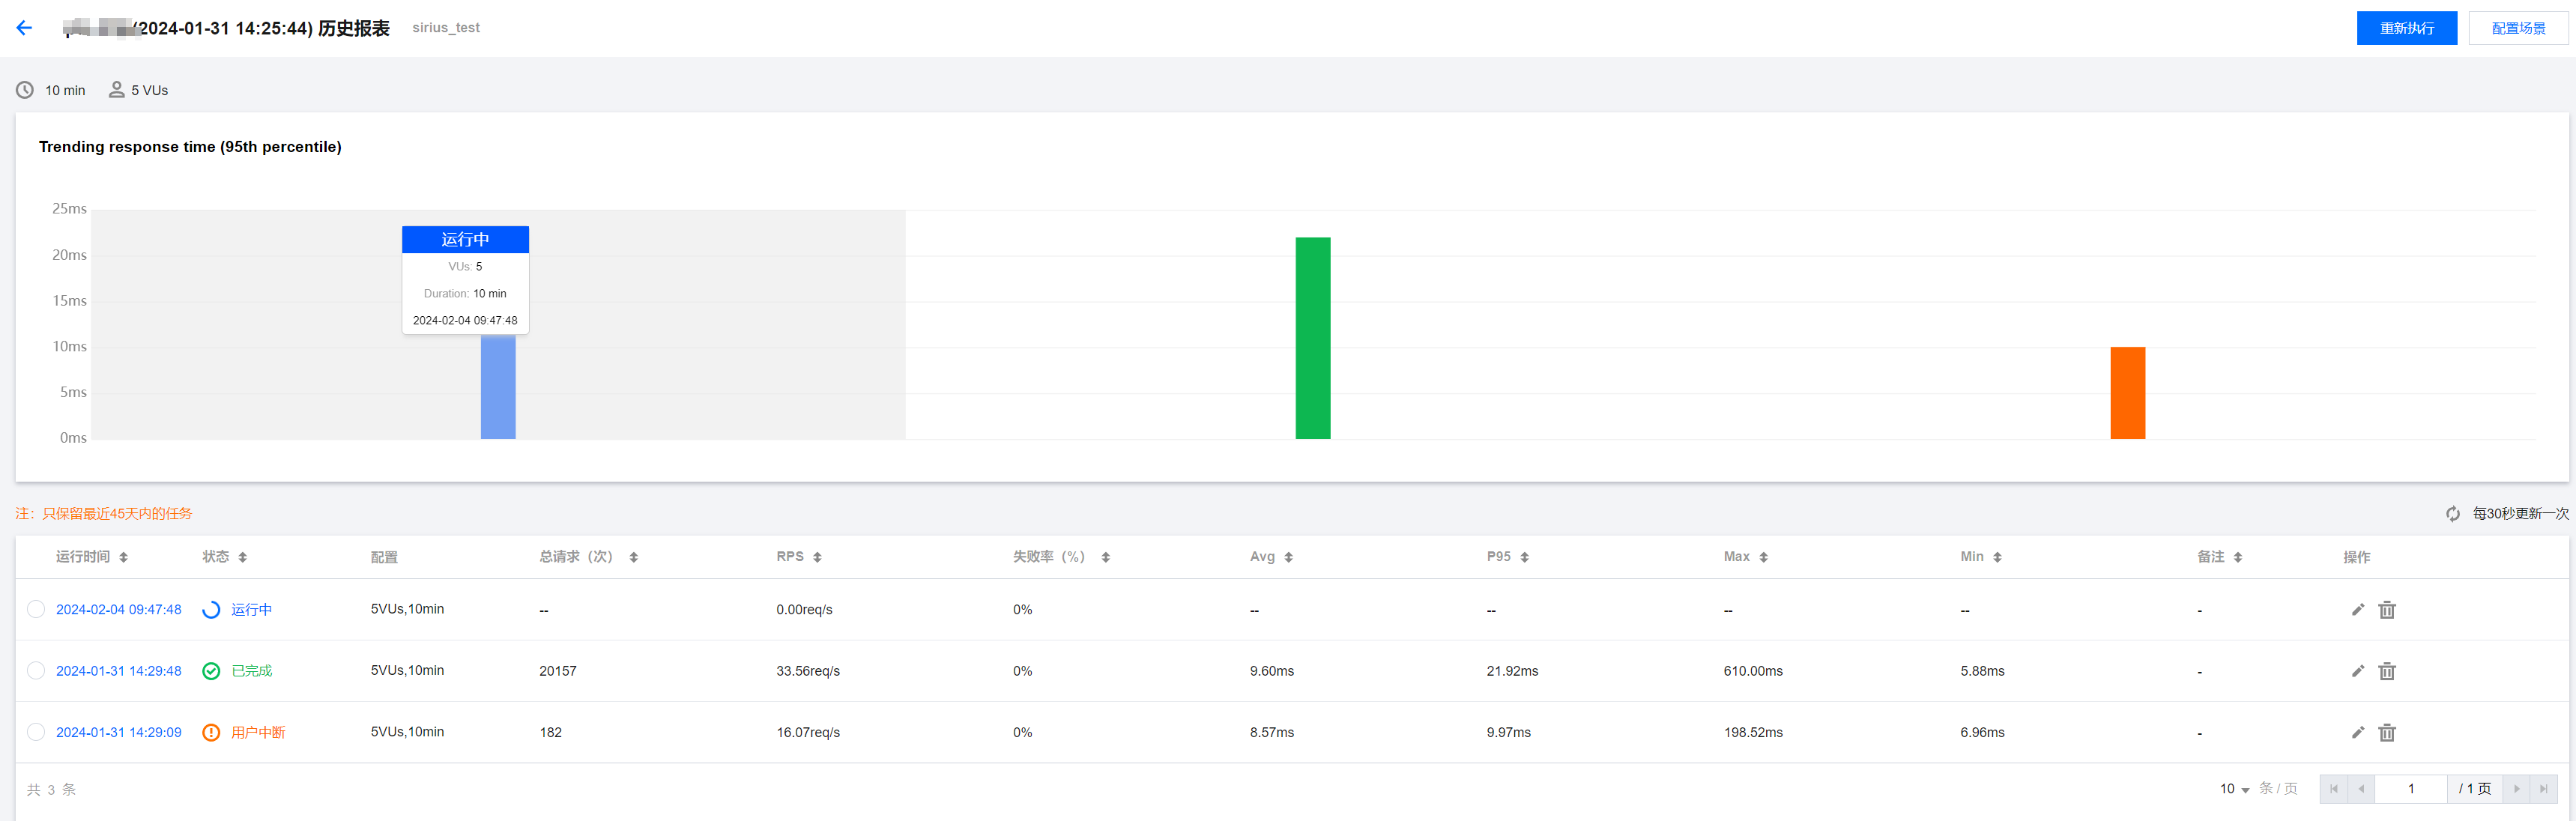
历史报表
当您的压测场景的一次压测任务完成后,您可从该场景的历史报表总览页面,找到该历史报表,并可单击进入,查看历史数据。
报表数据
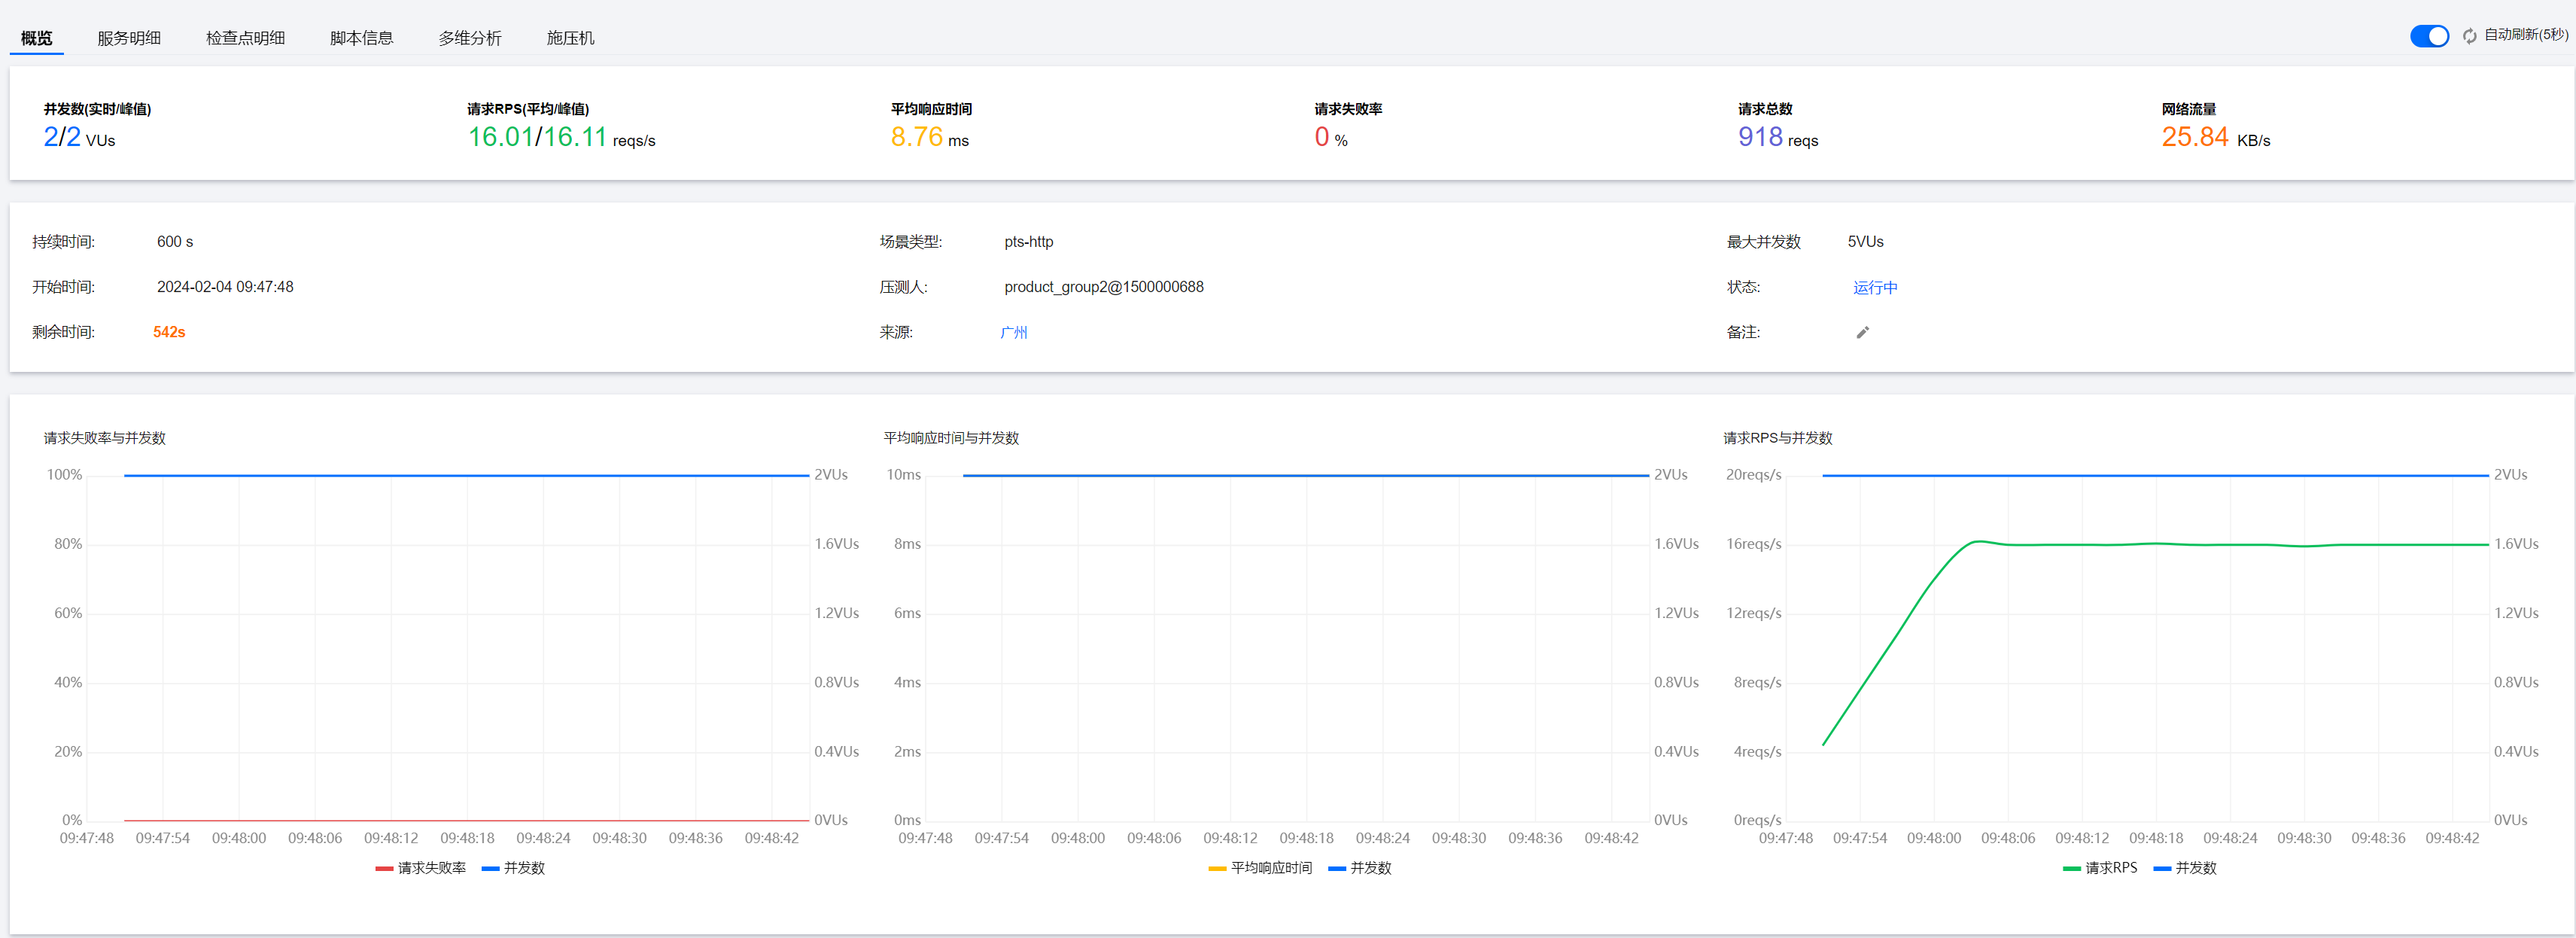
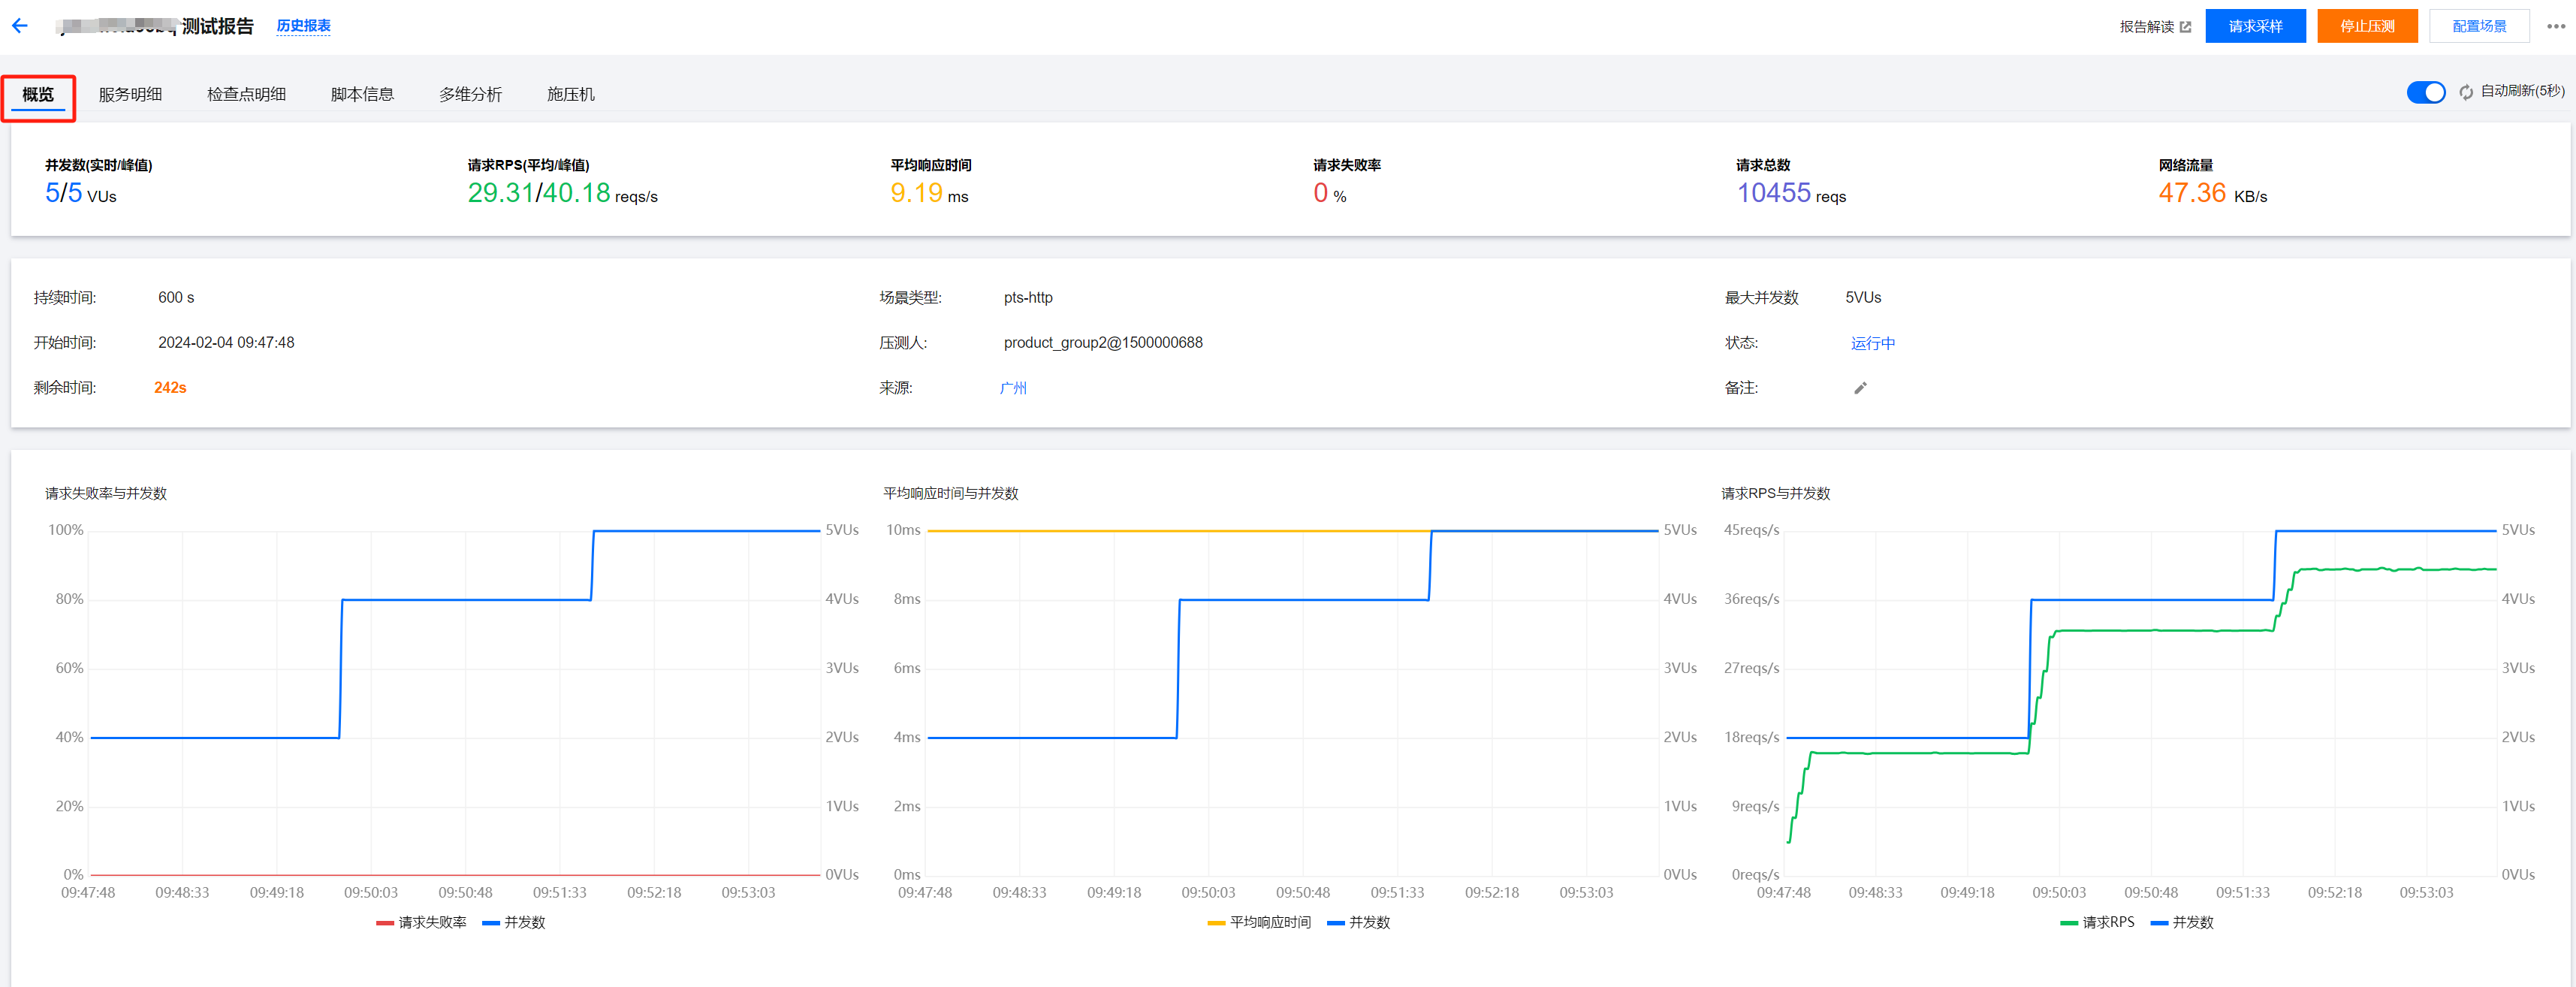
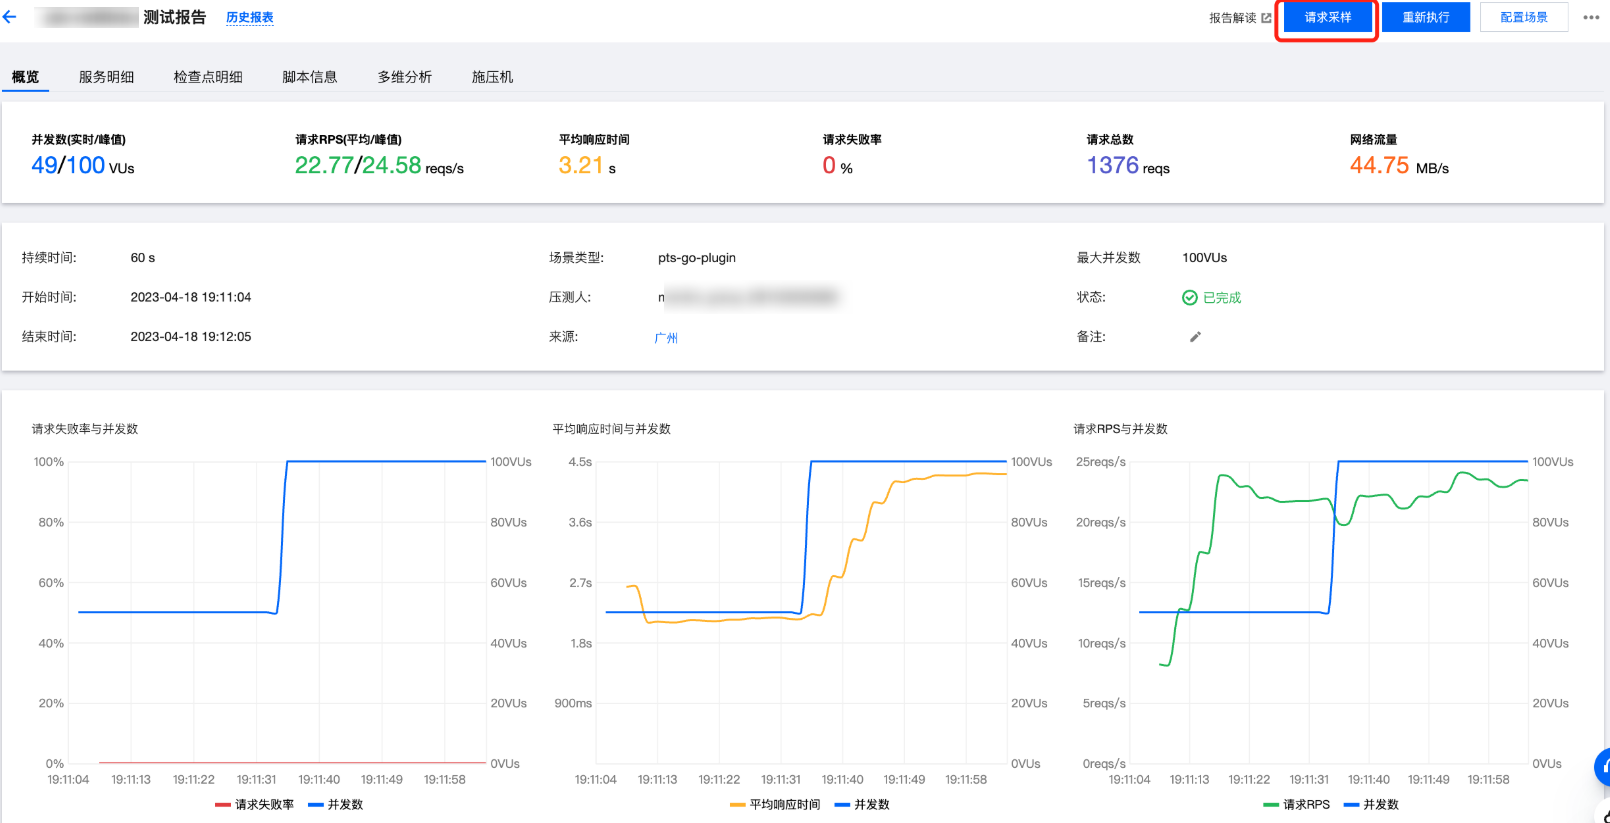
概览
概览页展示一些最核心的概览数据,如压测任务本身的元数据及压测结果里最常用的指标及其图表(如 VU、RPS、平均响应时间)。
概览页最上方一栏,为压测任务的总览数据,其中:
并发数、请求总数,为压测任务运行时刻的瞬时值。
RPS、平均响应时间、失败率、网络流量,为压测任务运行期间的平均值。
概览页中间一栏,为压测任务的持续时间、压测人、状态等元数据。
概览页最下方一栏,为压测任务的实时曲线,展示各指标在各时间点的瞬时值。
说明
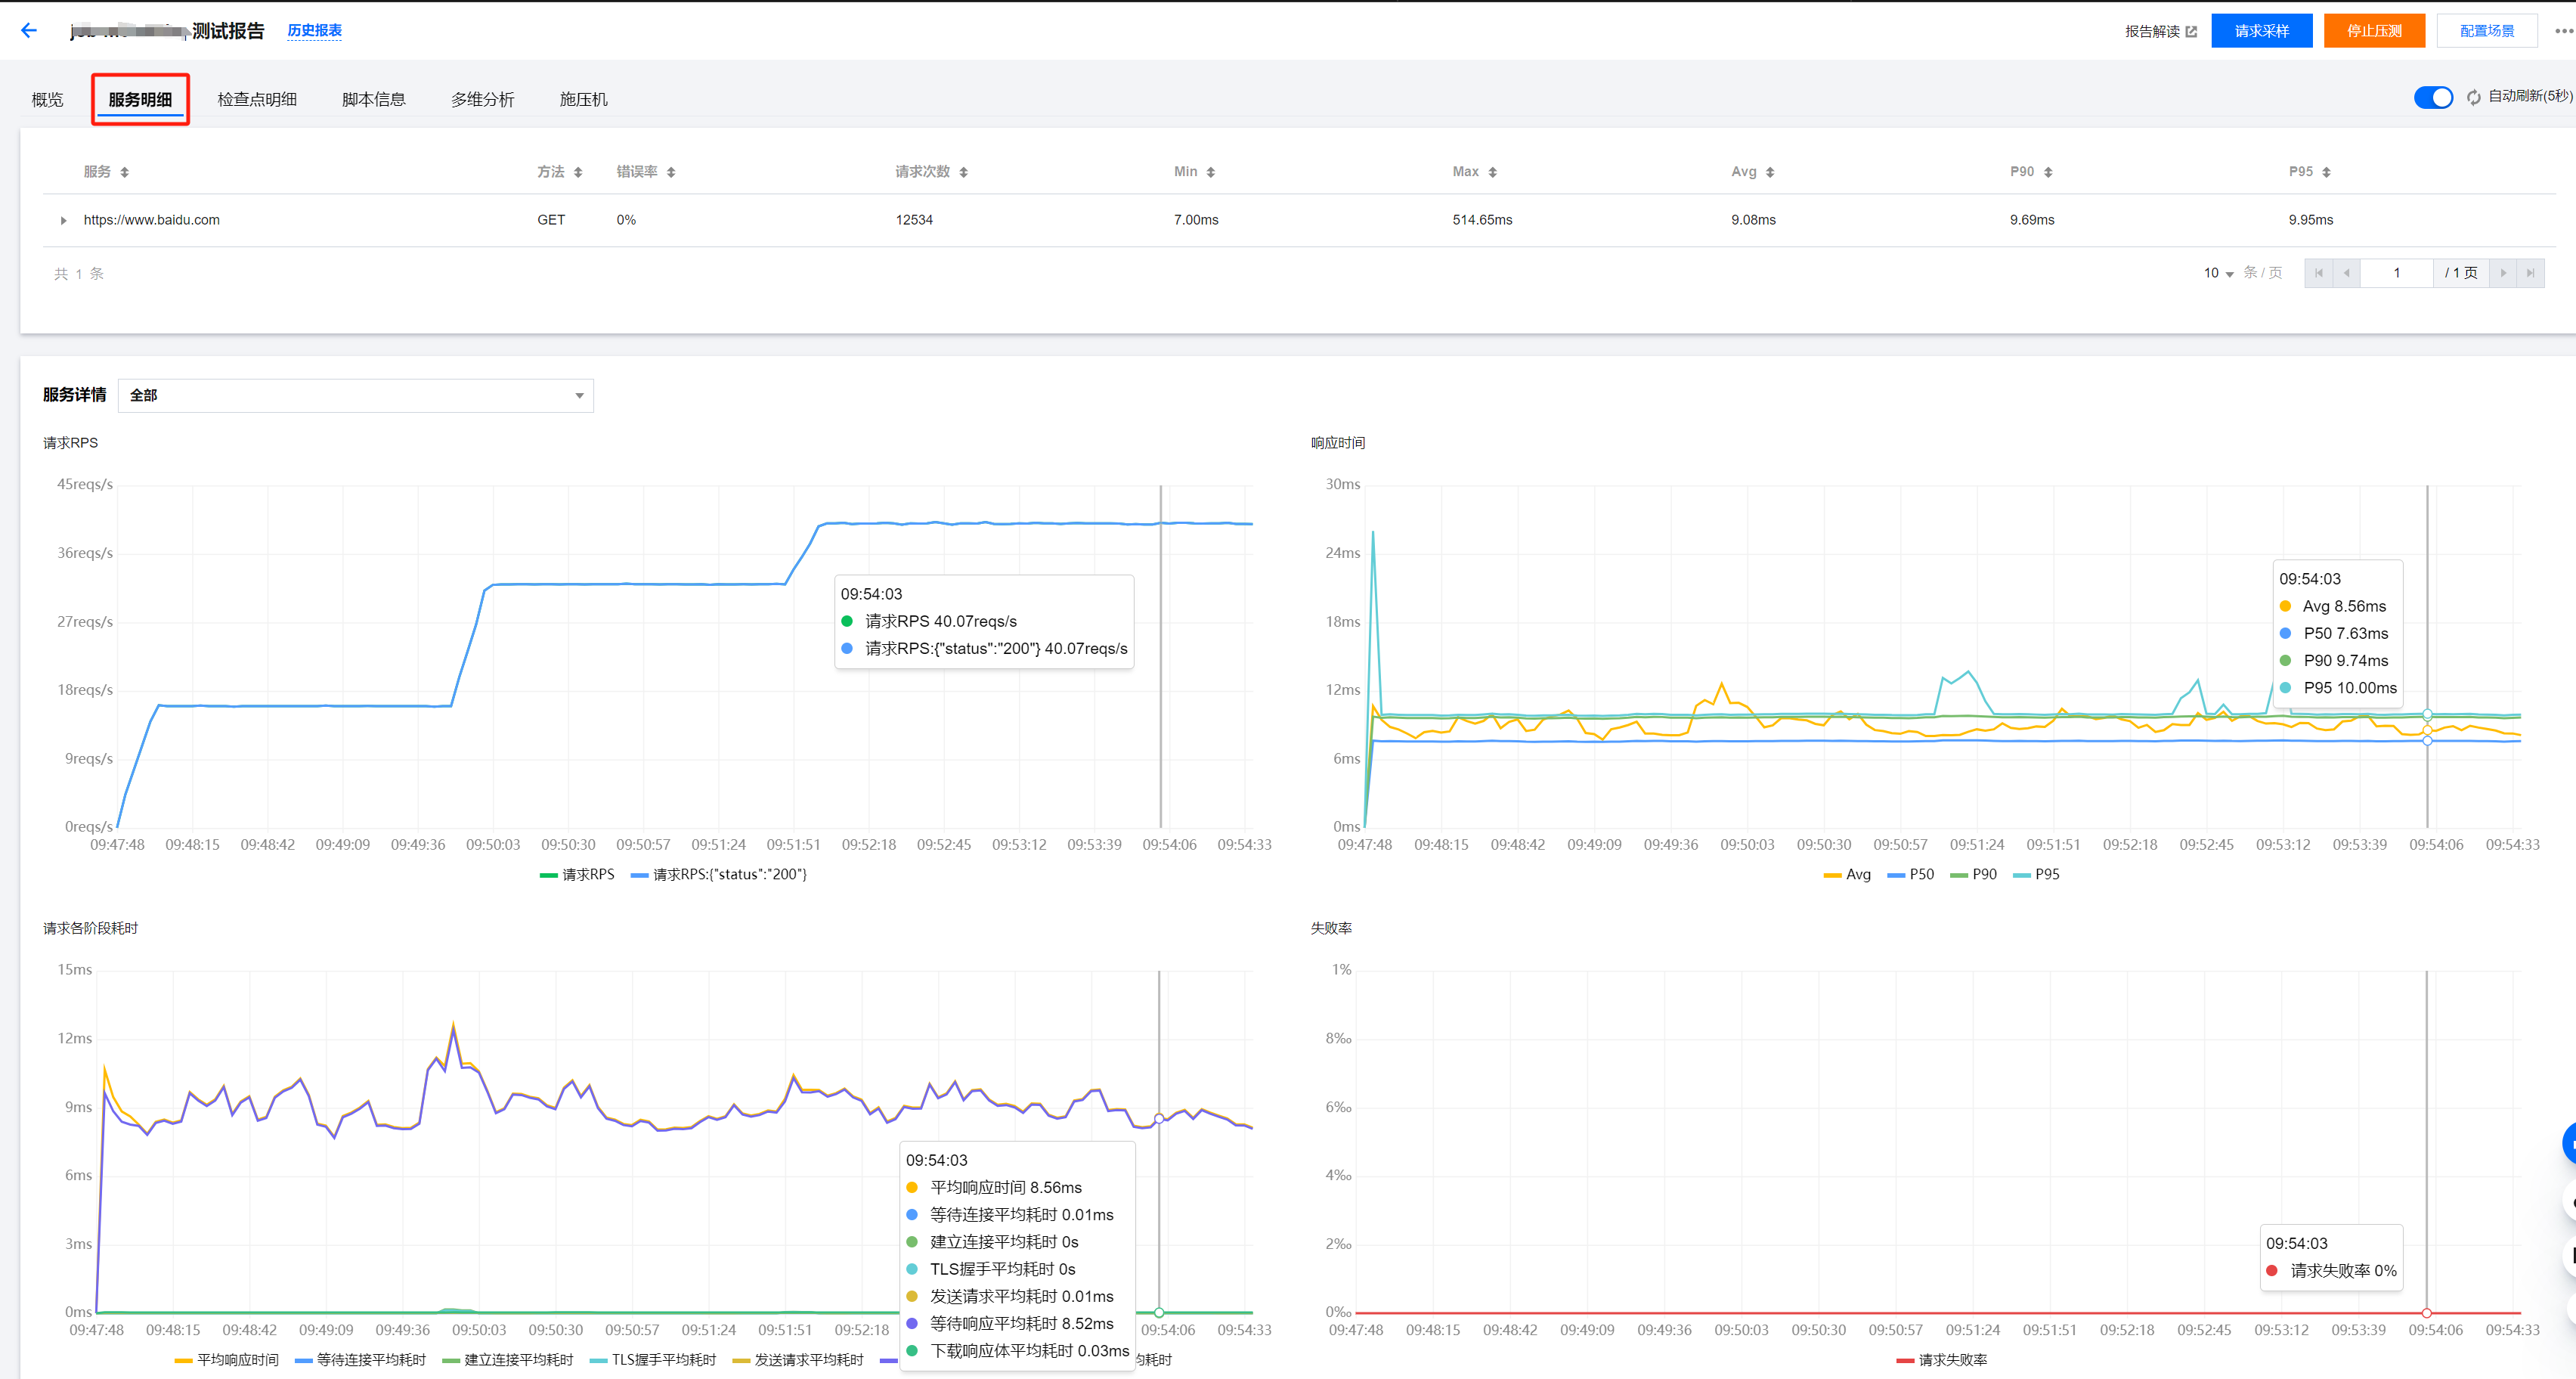
服务明细
服务明细页默认将每个 URL 归类为一个“服务”,展示压测期间发送的所有请求的明细信息。
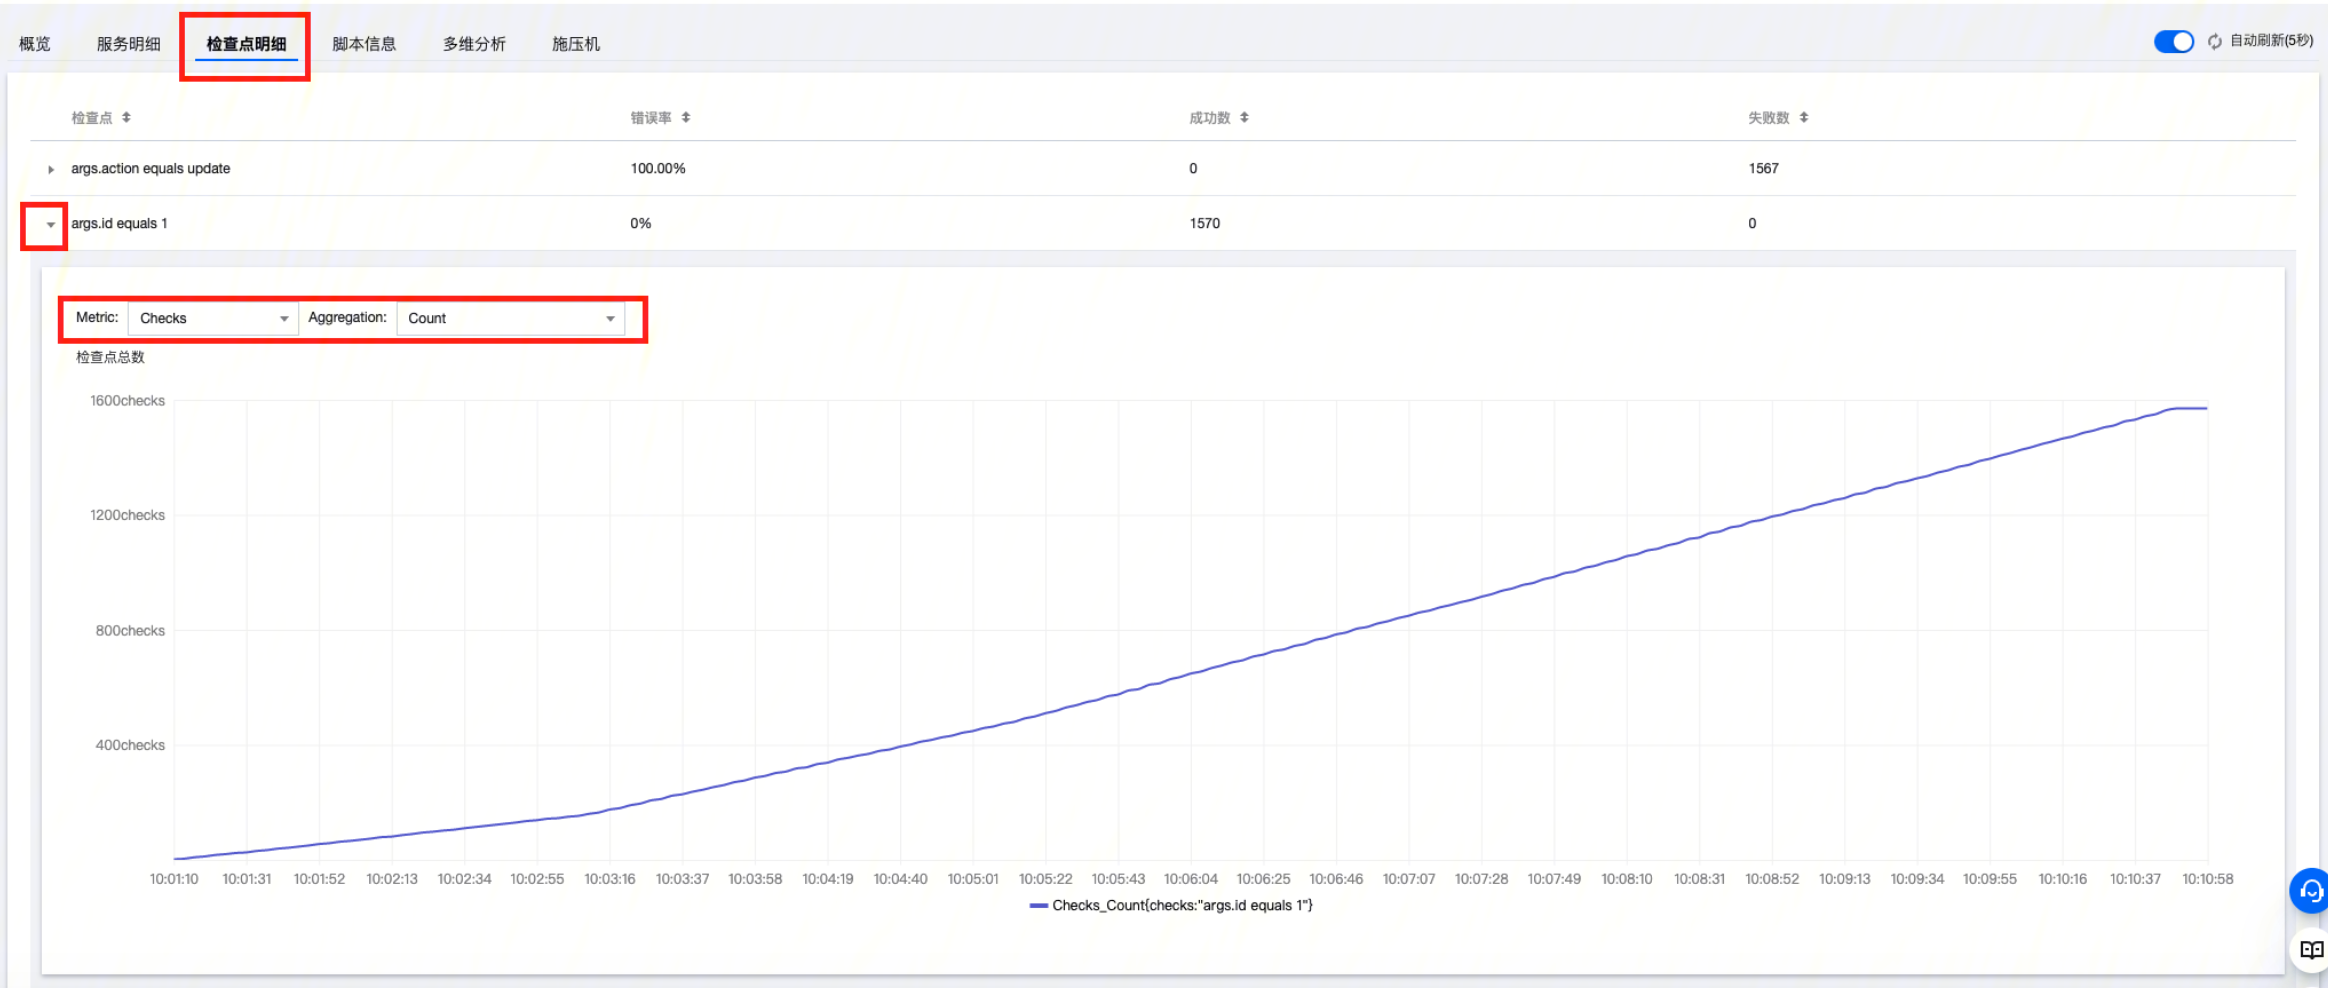
您可单击展开每个服务的详情,查看其数据及图表。在图表中,您可点击切换指标名(Metric)或聚合方式(Aggregation),来切换查看。
说明
在 PTS 中,不同服务默认是按照不同的 URL 来归类的。若您需要自定义服务归类,可在脚本模式的场景中,指定
http.Request 中的 service 属性。请参见 JavaScript API 列表。检查点明细
在检查点明细页面,您可查看您在场景中所设置的检查点的结果明细。
说明
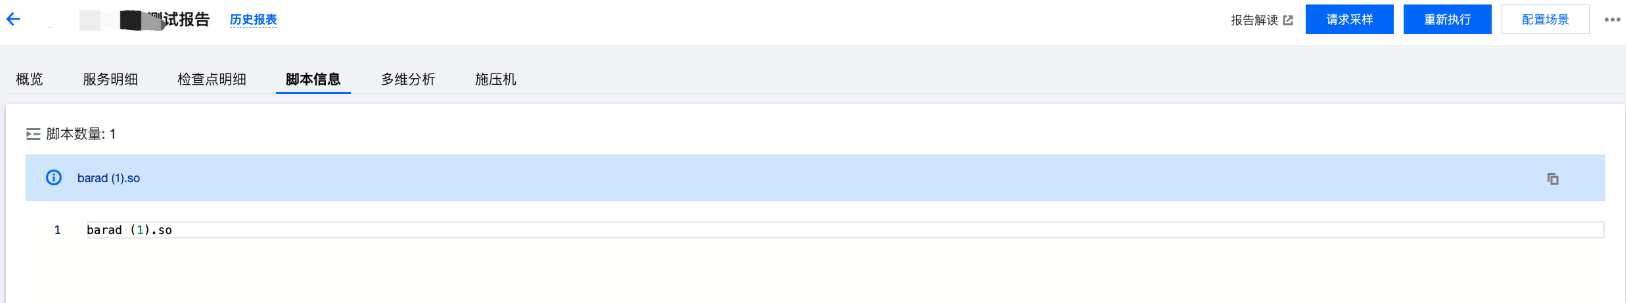
脚本信息
在脚本信息页面,您可查看压测任务执行时所使用的场景脚本的快照。
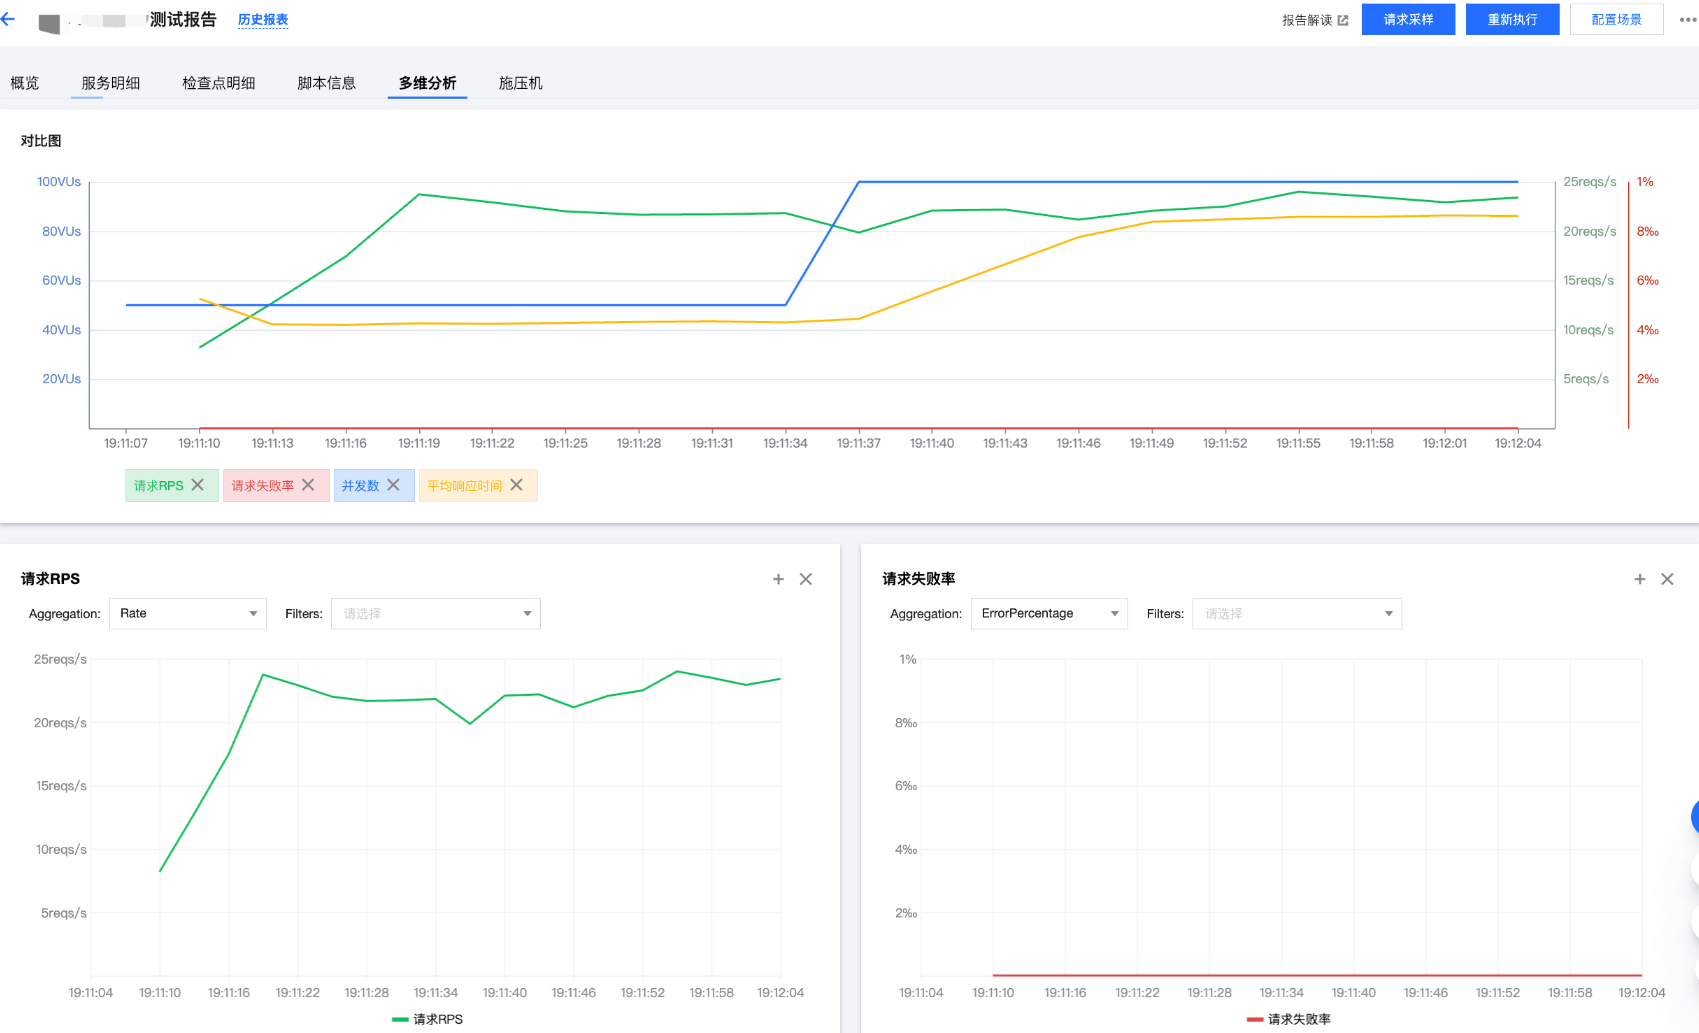
多维分析
在多维分析页面,您可交互式地切换查看多种压测结果数据的图表组合。
您可单击切换指标名(Metric)或聚合方式(Aggregation),来切换查看不同图表。
您还可单击页面下方添加指标,新建您所需的数据图表。
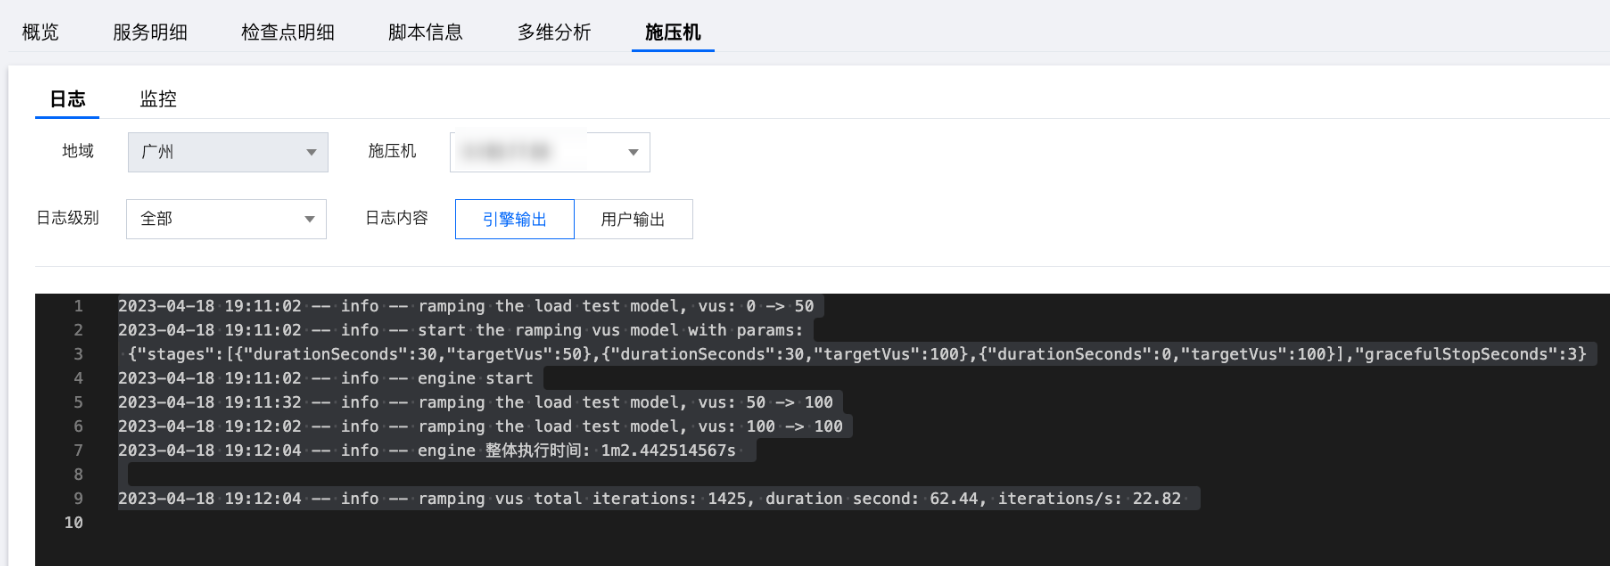
施压机
在施压机页面,您可查看该压测任务的施压机的基本信息、在压测过程中输出的日志、施压机本身的资源使用状况。
其中,压测日志可按日志级别(debug/info/error)和日志内容(用户输出/引擎输出)分类,您可在下拉列表中切换。
您自行打印的日志,将展示在用户输出标签页。
PTS 打印的通用日志,将展示在引擎输出标签页。
请求采样
单击请求采样,您可查看施压端采样选取的部分请求的详细信息。
您可输入相应条件,筛选所需请求。在请求列表中,您可单击详情,展开单条请求的详情页。
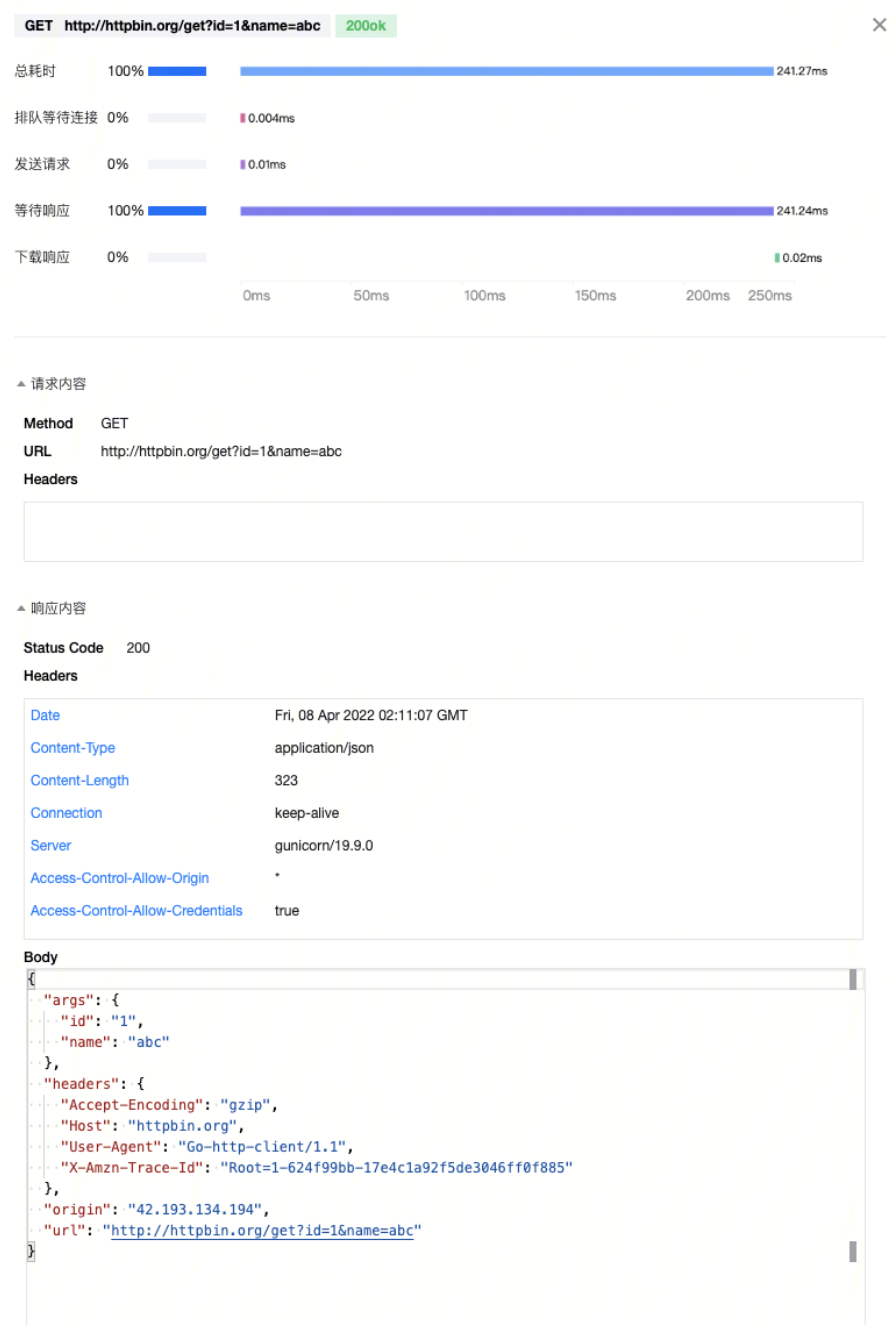
在单条请求的详情页中,您可查看它的请求和响应的详细信息,以及请求耗时分布的瀑布图。
文档反馈