Querying Service Logs
Unduh
Mode fokus
Ukuran font
This document describes how to enable service logs in EdgeOne Edge Inference and deliver the runtime logs of service containers to Tencent Cloud CLS for troubleshooting service call exceptions and locating issues.
Introduction
Edge Inference runs in containers, and the logs generated during service runtime are essential for troubleshooting call exceptions and locating issues. After you enable service logs, EdgeOne collects the standard output (stdout) and standard error (stderr) of business containers and delivers them to Tencent Cloud CLS. You can view the logs directly on the service details page or go to the CLS console for more complex search and analysis.
Note:
1. Service logs collect only the standard output and standard error of containers. Make sure that your image outputs logs to stdout or stderr, as log content that is not output will not be collected.
2. CLS is an independently billed Tencent Cloud product. After you enable it, the incurred fees will be settled in your Tencent Cloud account. For billing details, see CLS Billing Overview.
Prerequisites
You have created and started the Edge Inference service, and the service status is Running. If you have not created a service, see Quick Start to create one.
User Guide
Step 1: Enabling Service Logs
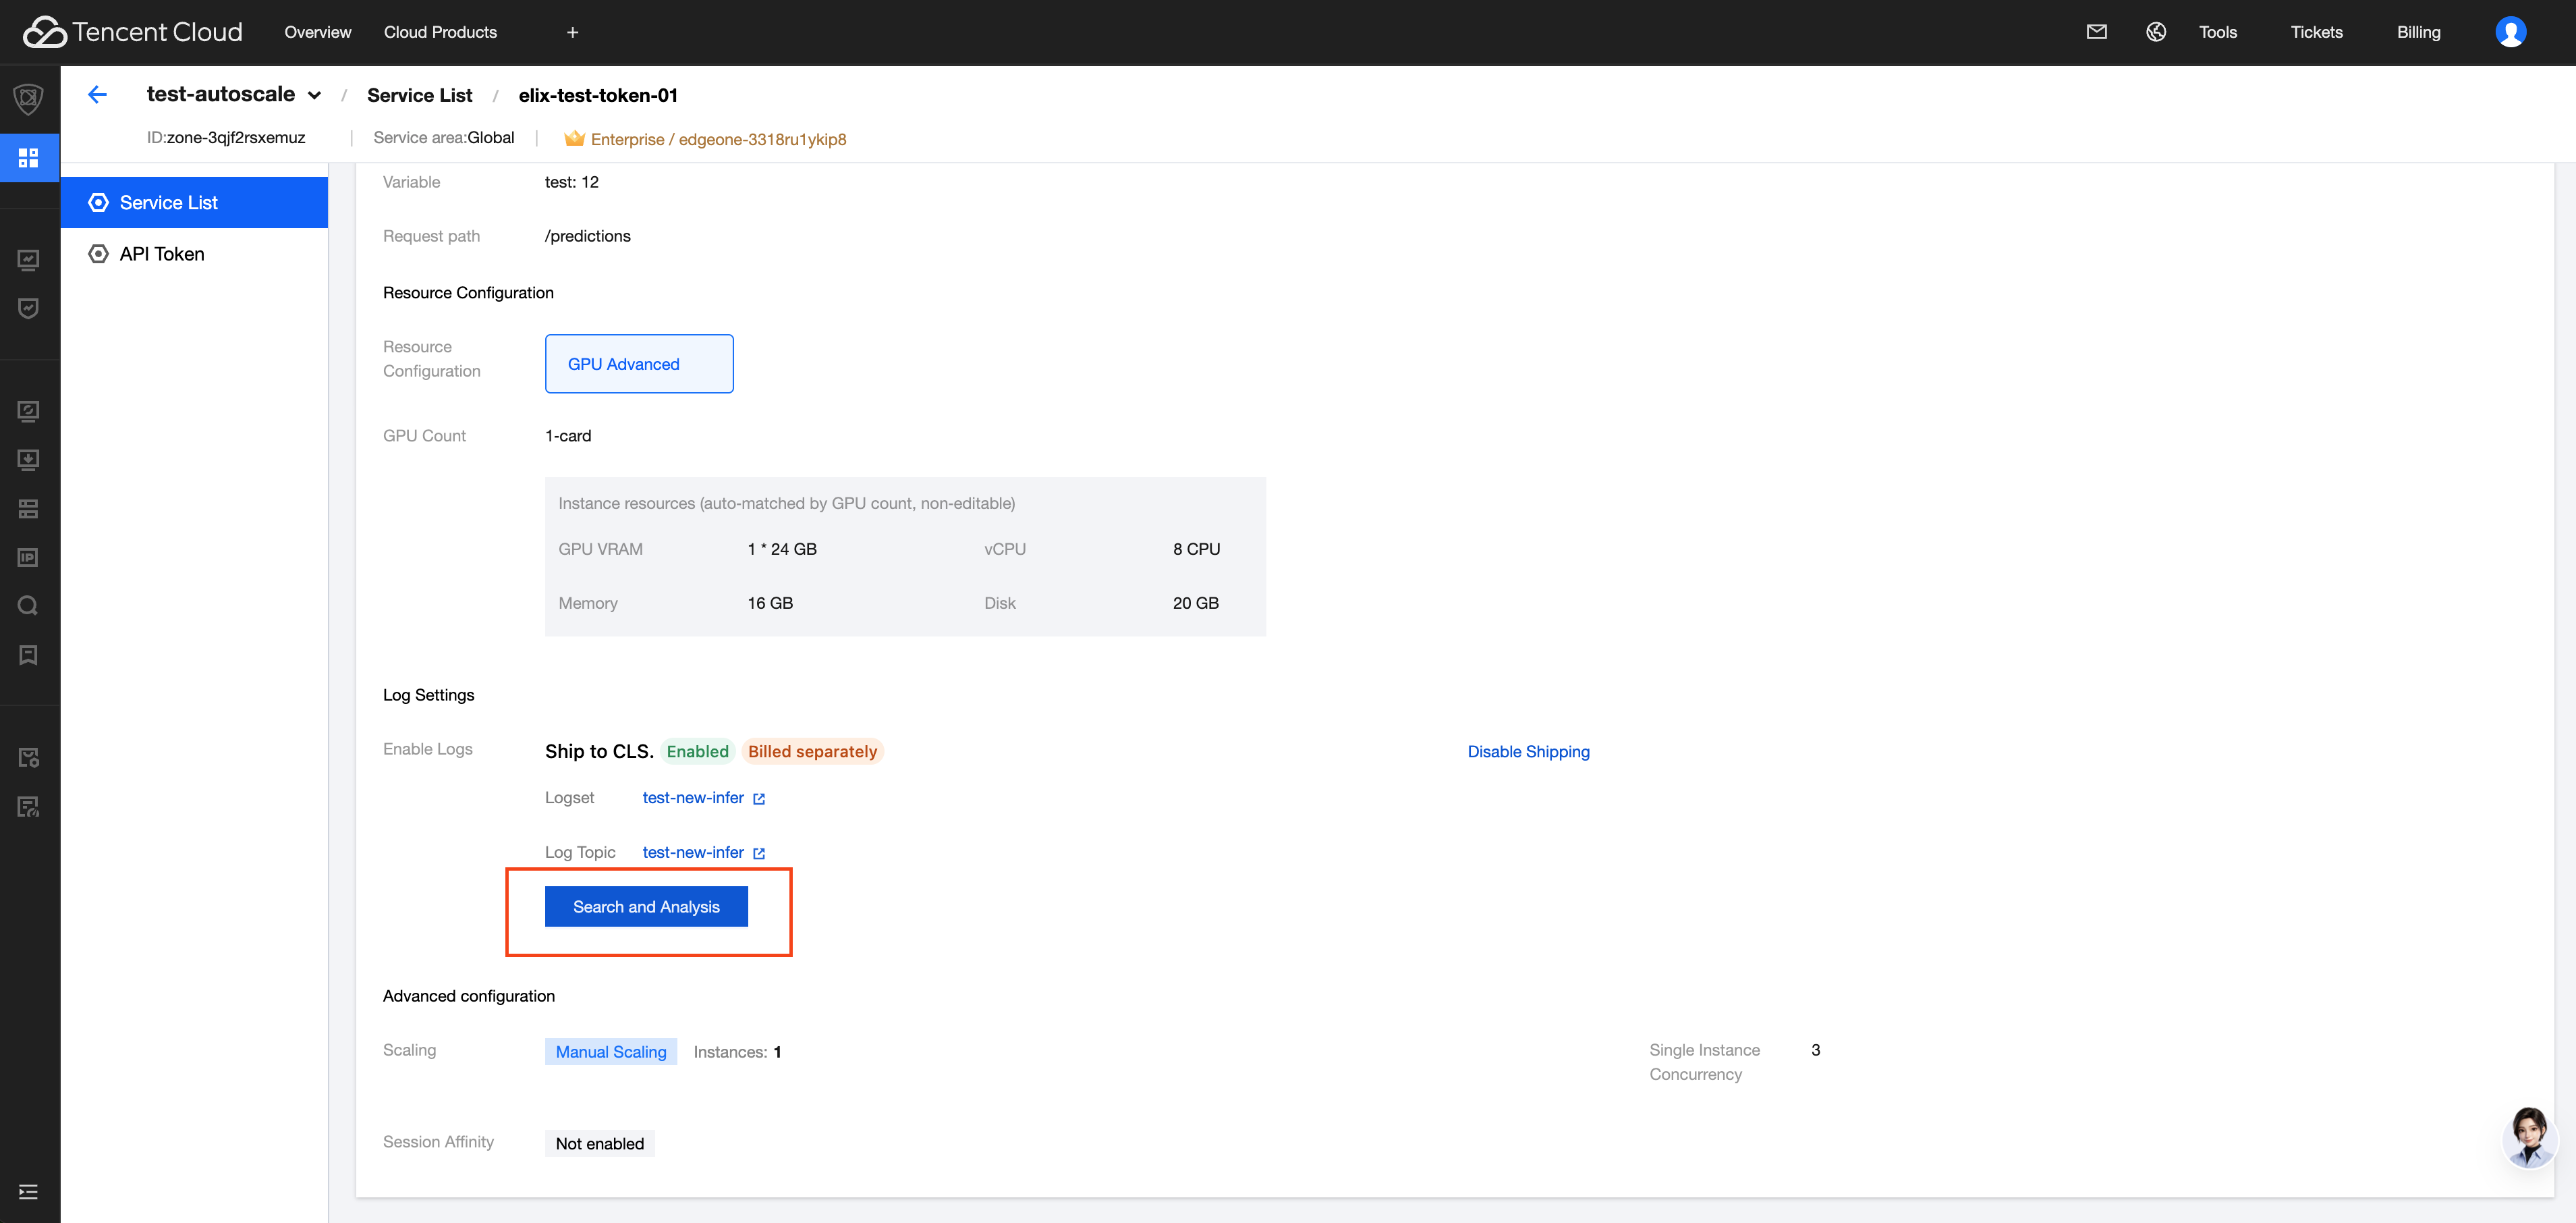
1. On the service details page, under the Basic Information tab, locate the Log Settings section.
2. Click Enable Now.
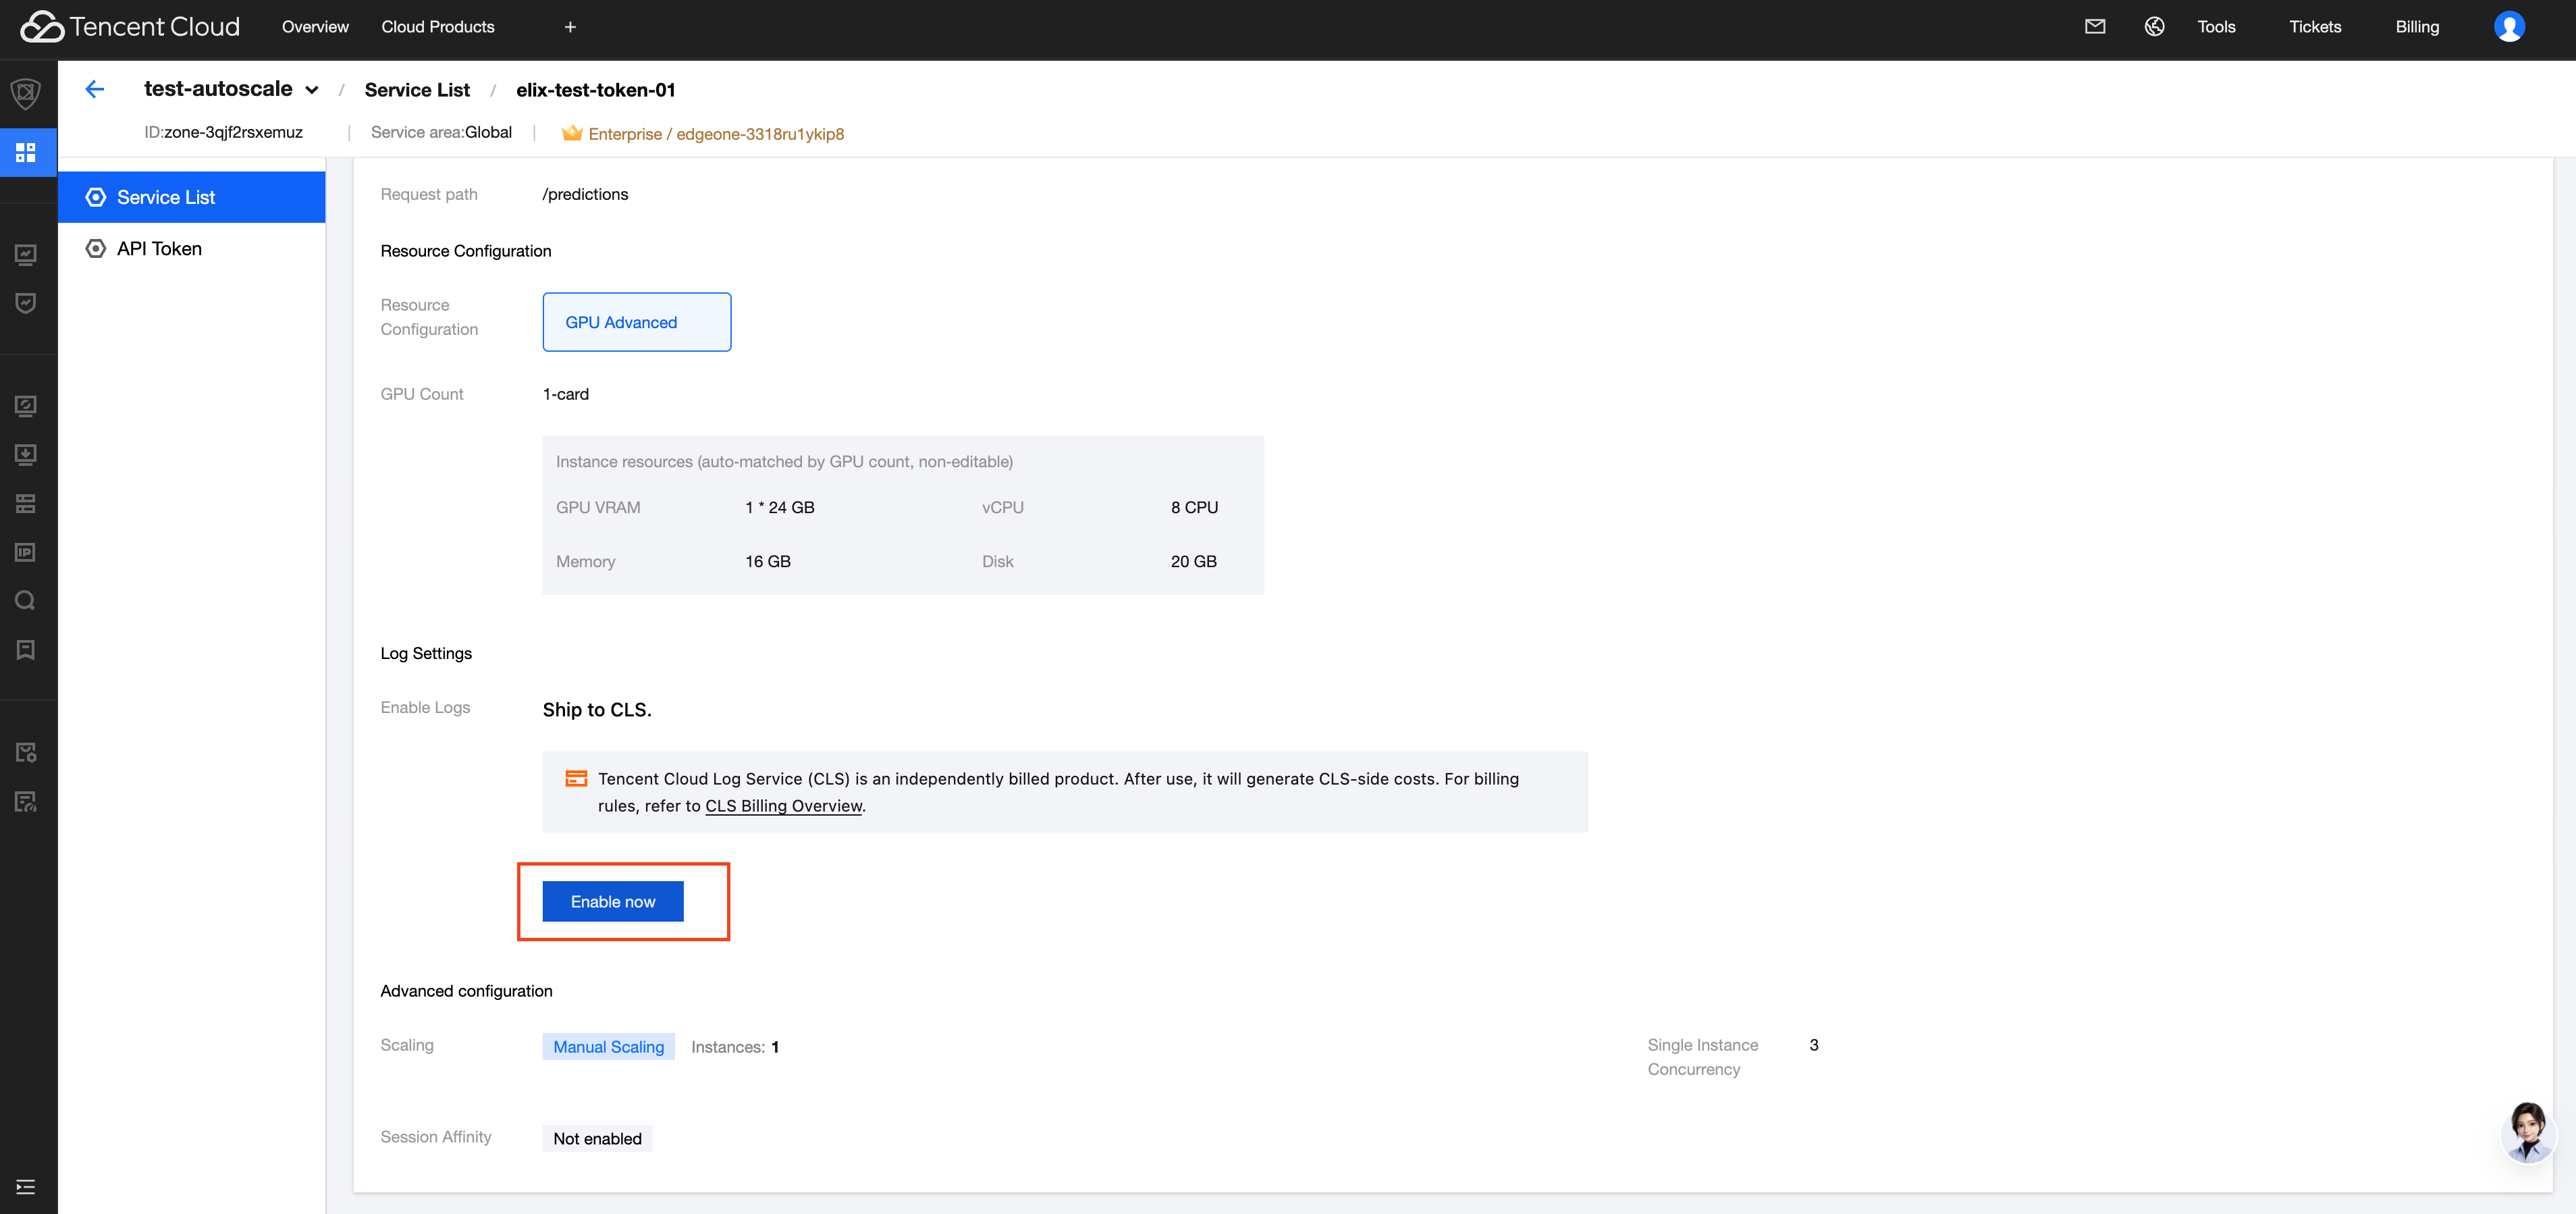
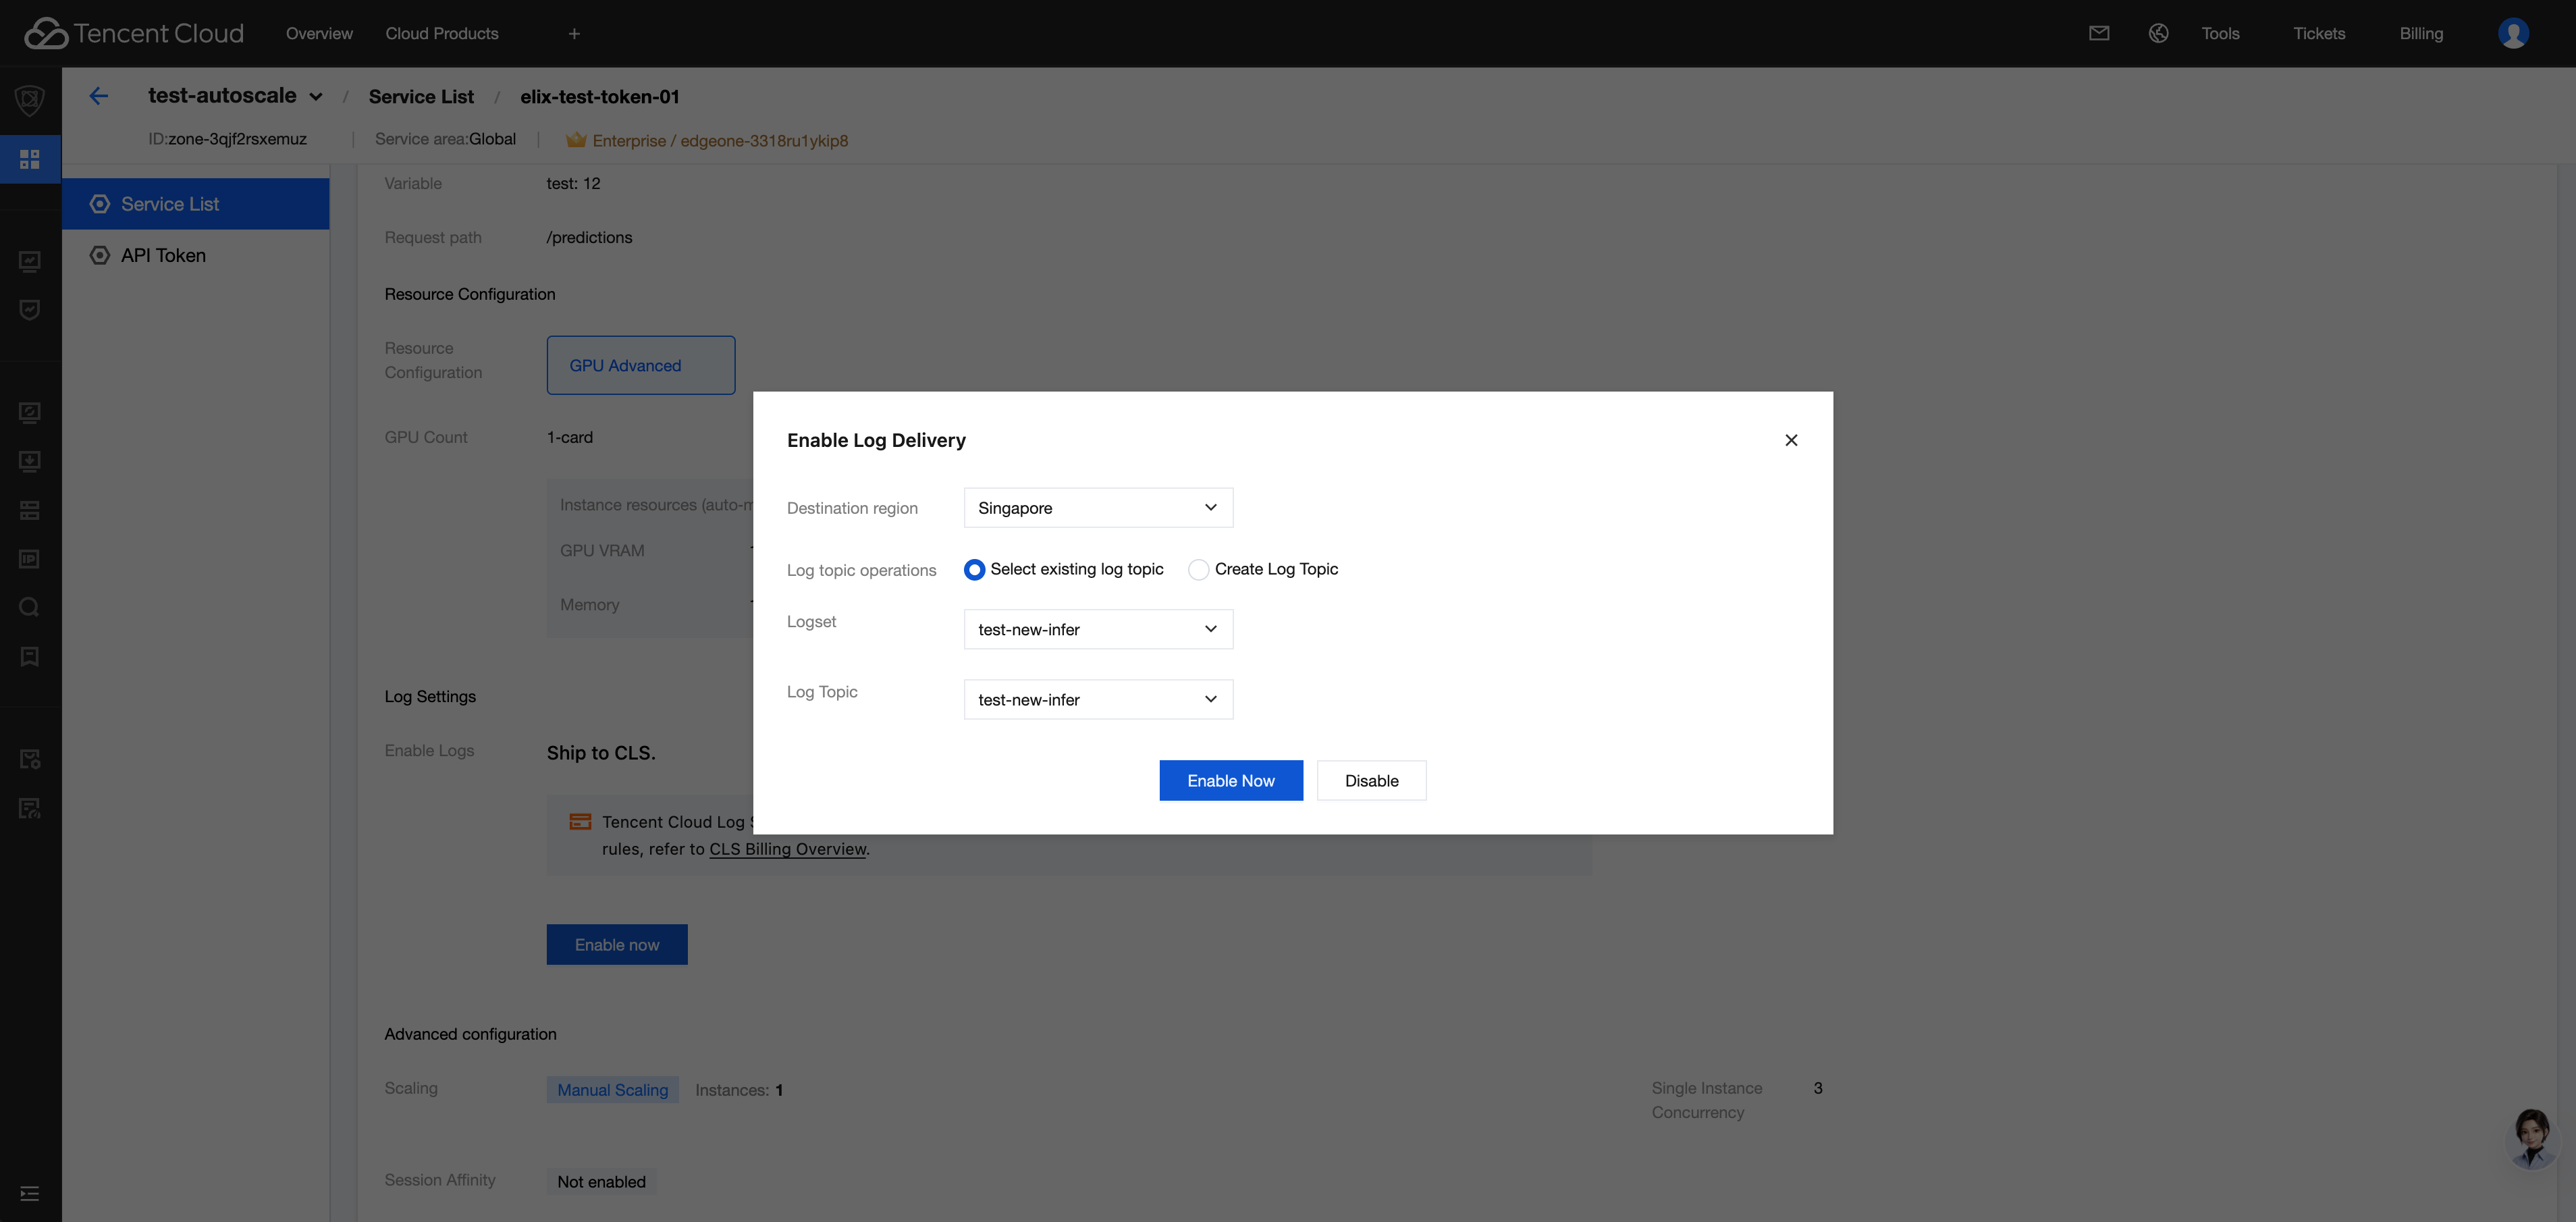
3. In the Enable Log Delivery pop-up window, complete the configuration and click Enable Now:
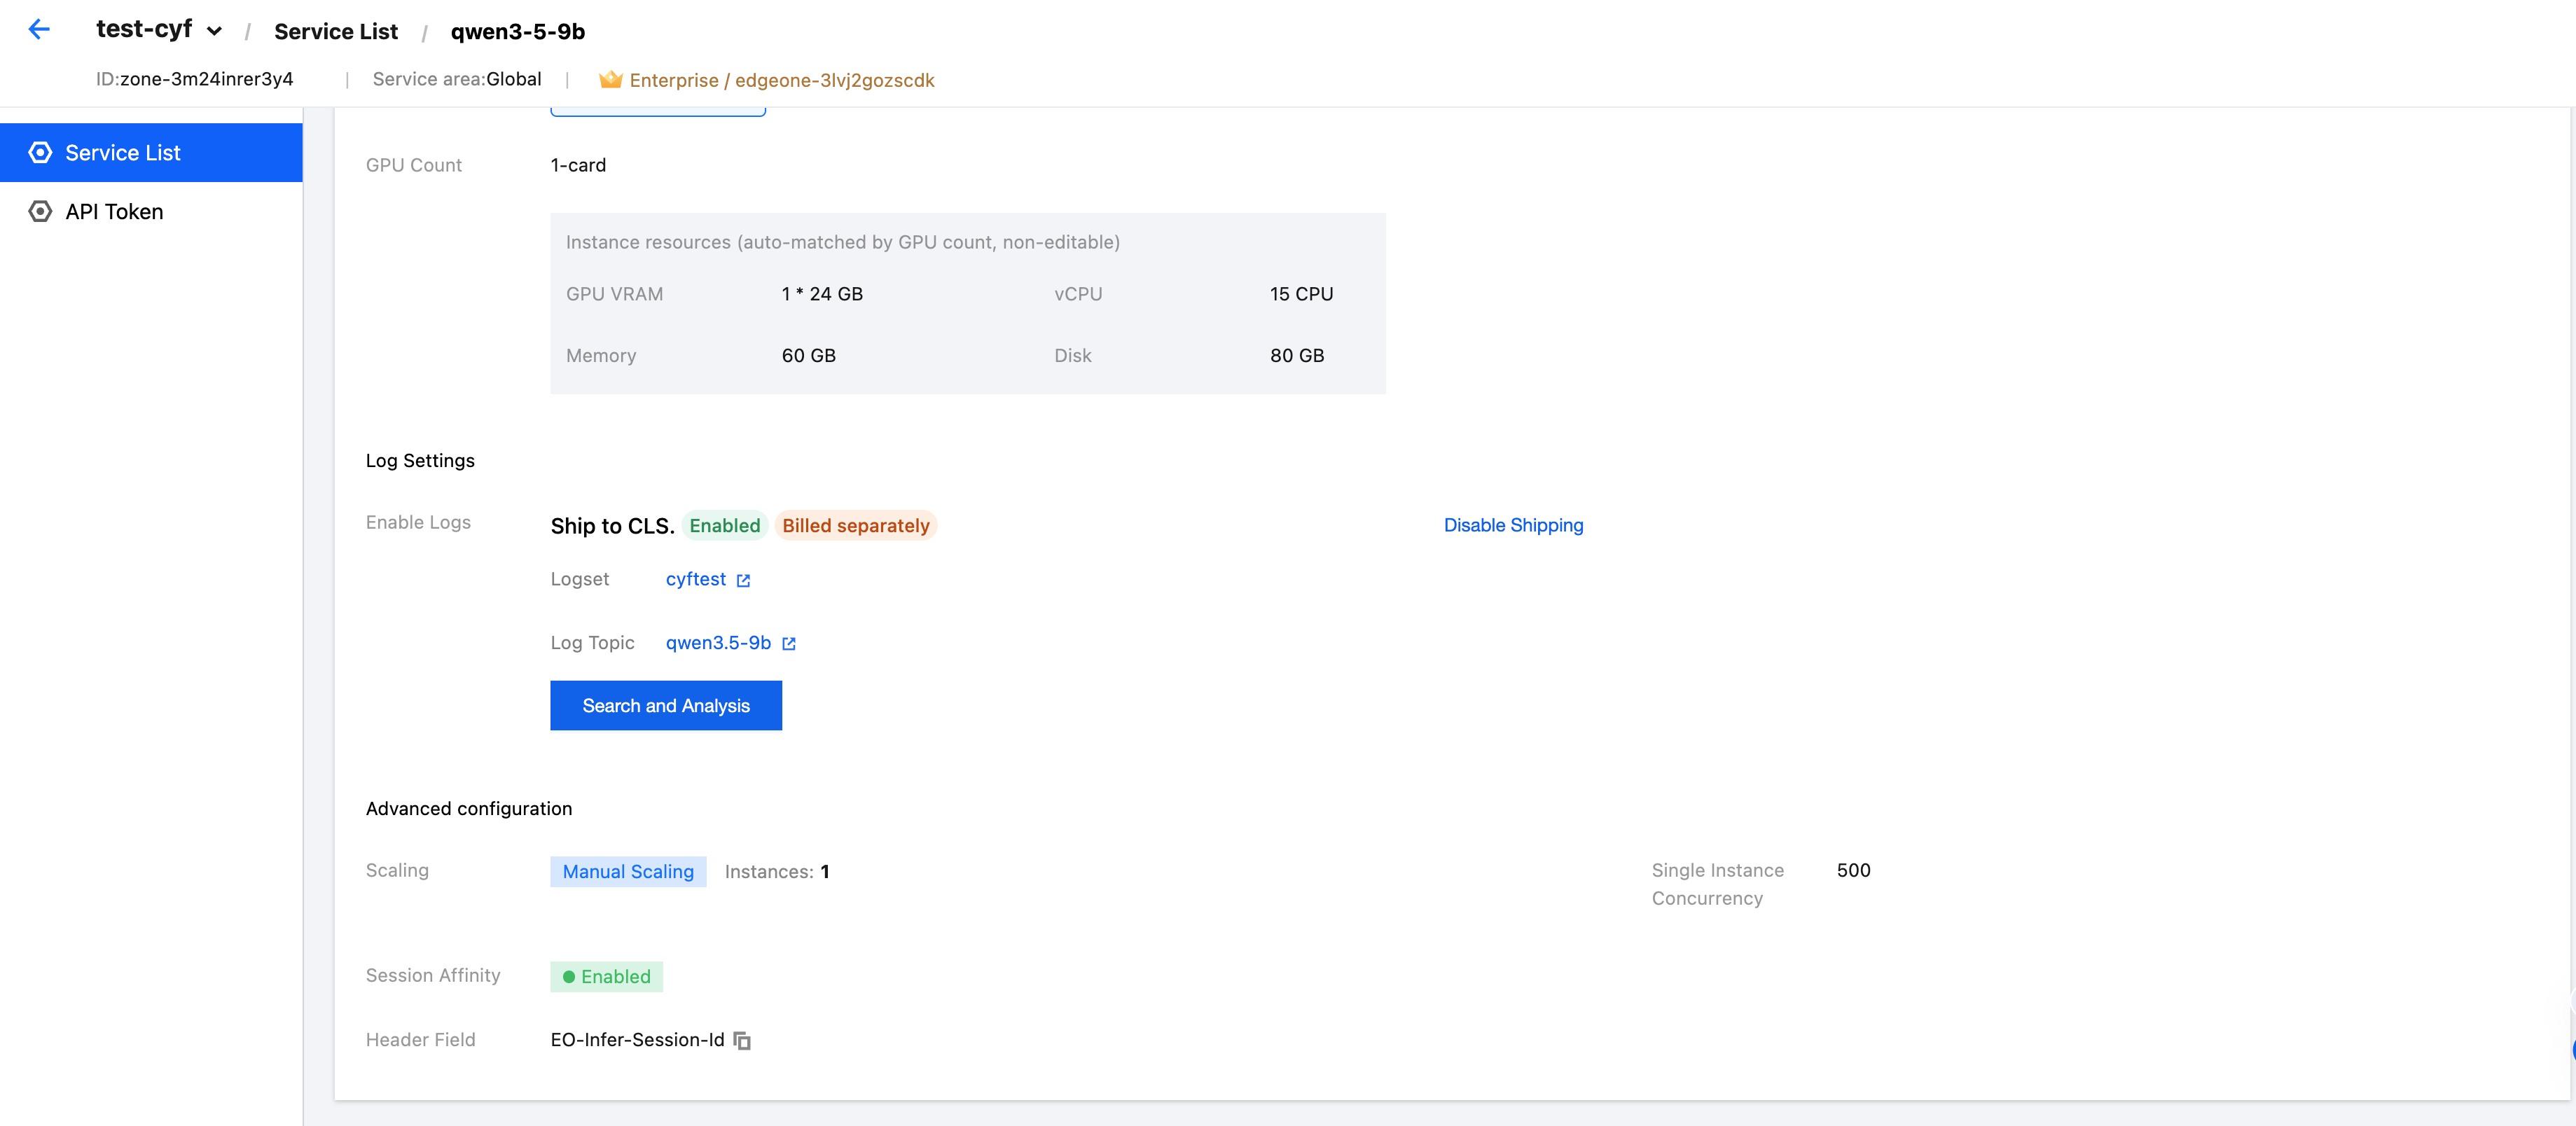
After the service log is enabled, the Log Settings section displays the current status as Enabled and Independent Billing, along with the delivered logset and log topic. To stop log delivery, click Disable Delivery in the upper-right corner of the section.
Step 2: Viewing Logs
After service logs are enabled, two viewing entries are provided for different troubleshooting scenarios.
Entry 1: Service Logs Tab on the Service Details Page
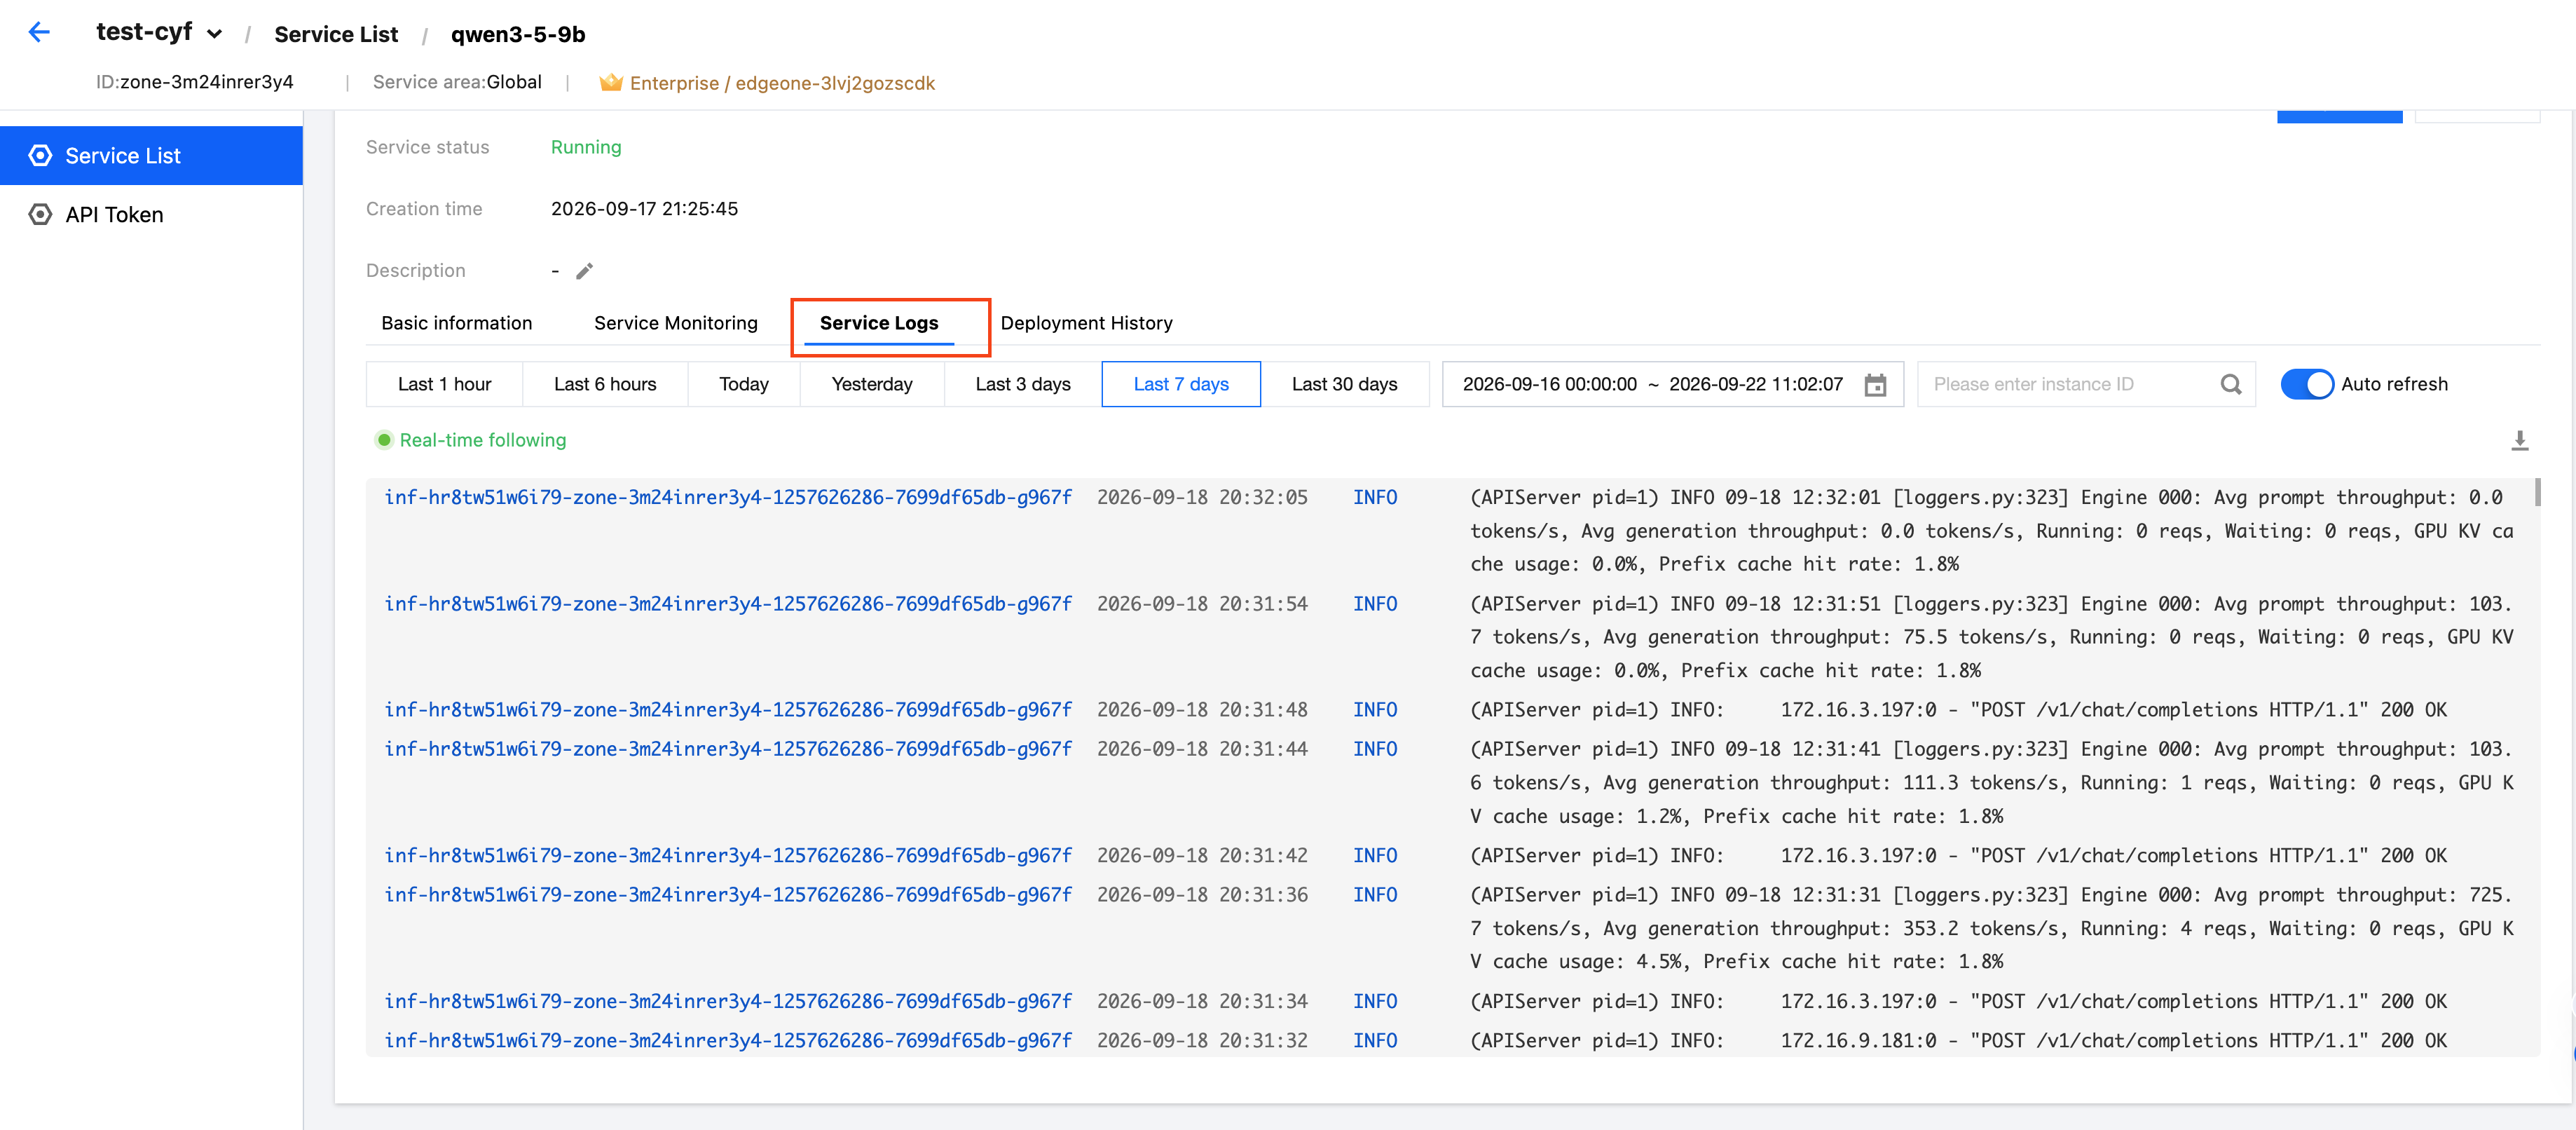
On the service details page, click the Service Logs tab to view the runtime logs of all instances under the service. The log list displays four fields from left to right: instance ID, time, level, and log content. Click an instance ID to quickly filter the logs of that instance. The level is typically INFO (normal information), WARN (warning), or ERROR (error). The log content is the specific runtime log output by the inference engine.
Entry 2: Search and Analysis on the Basic Information Tab
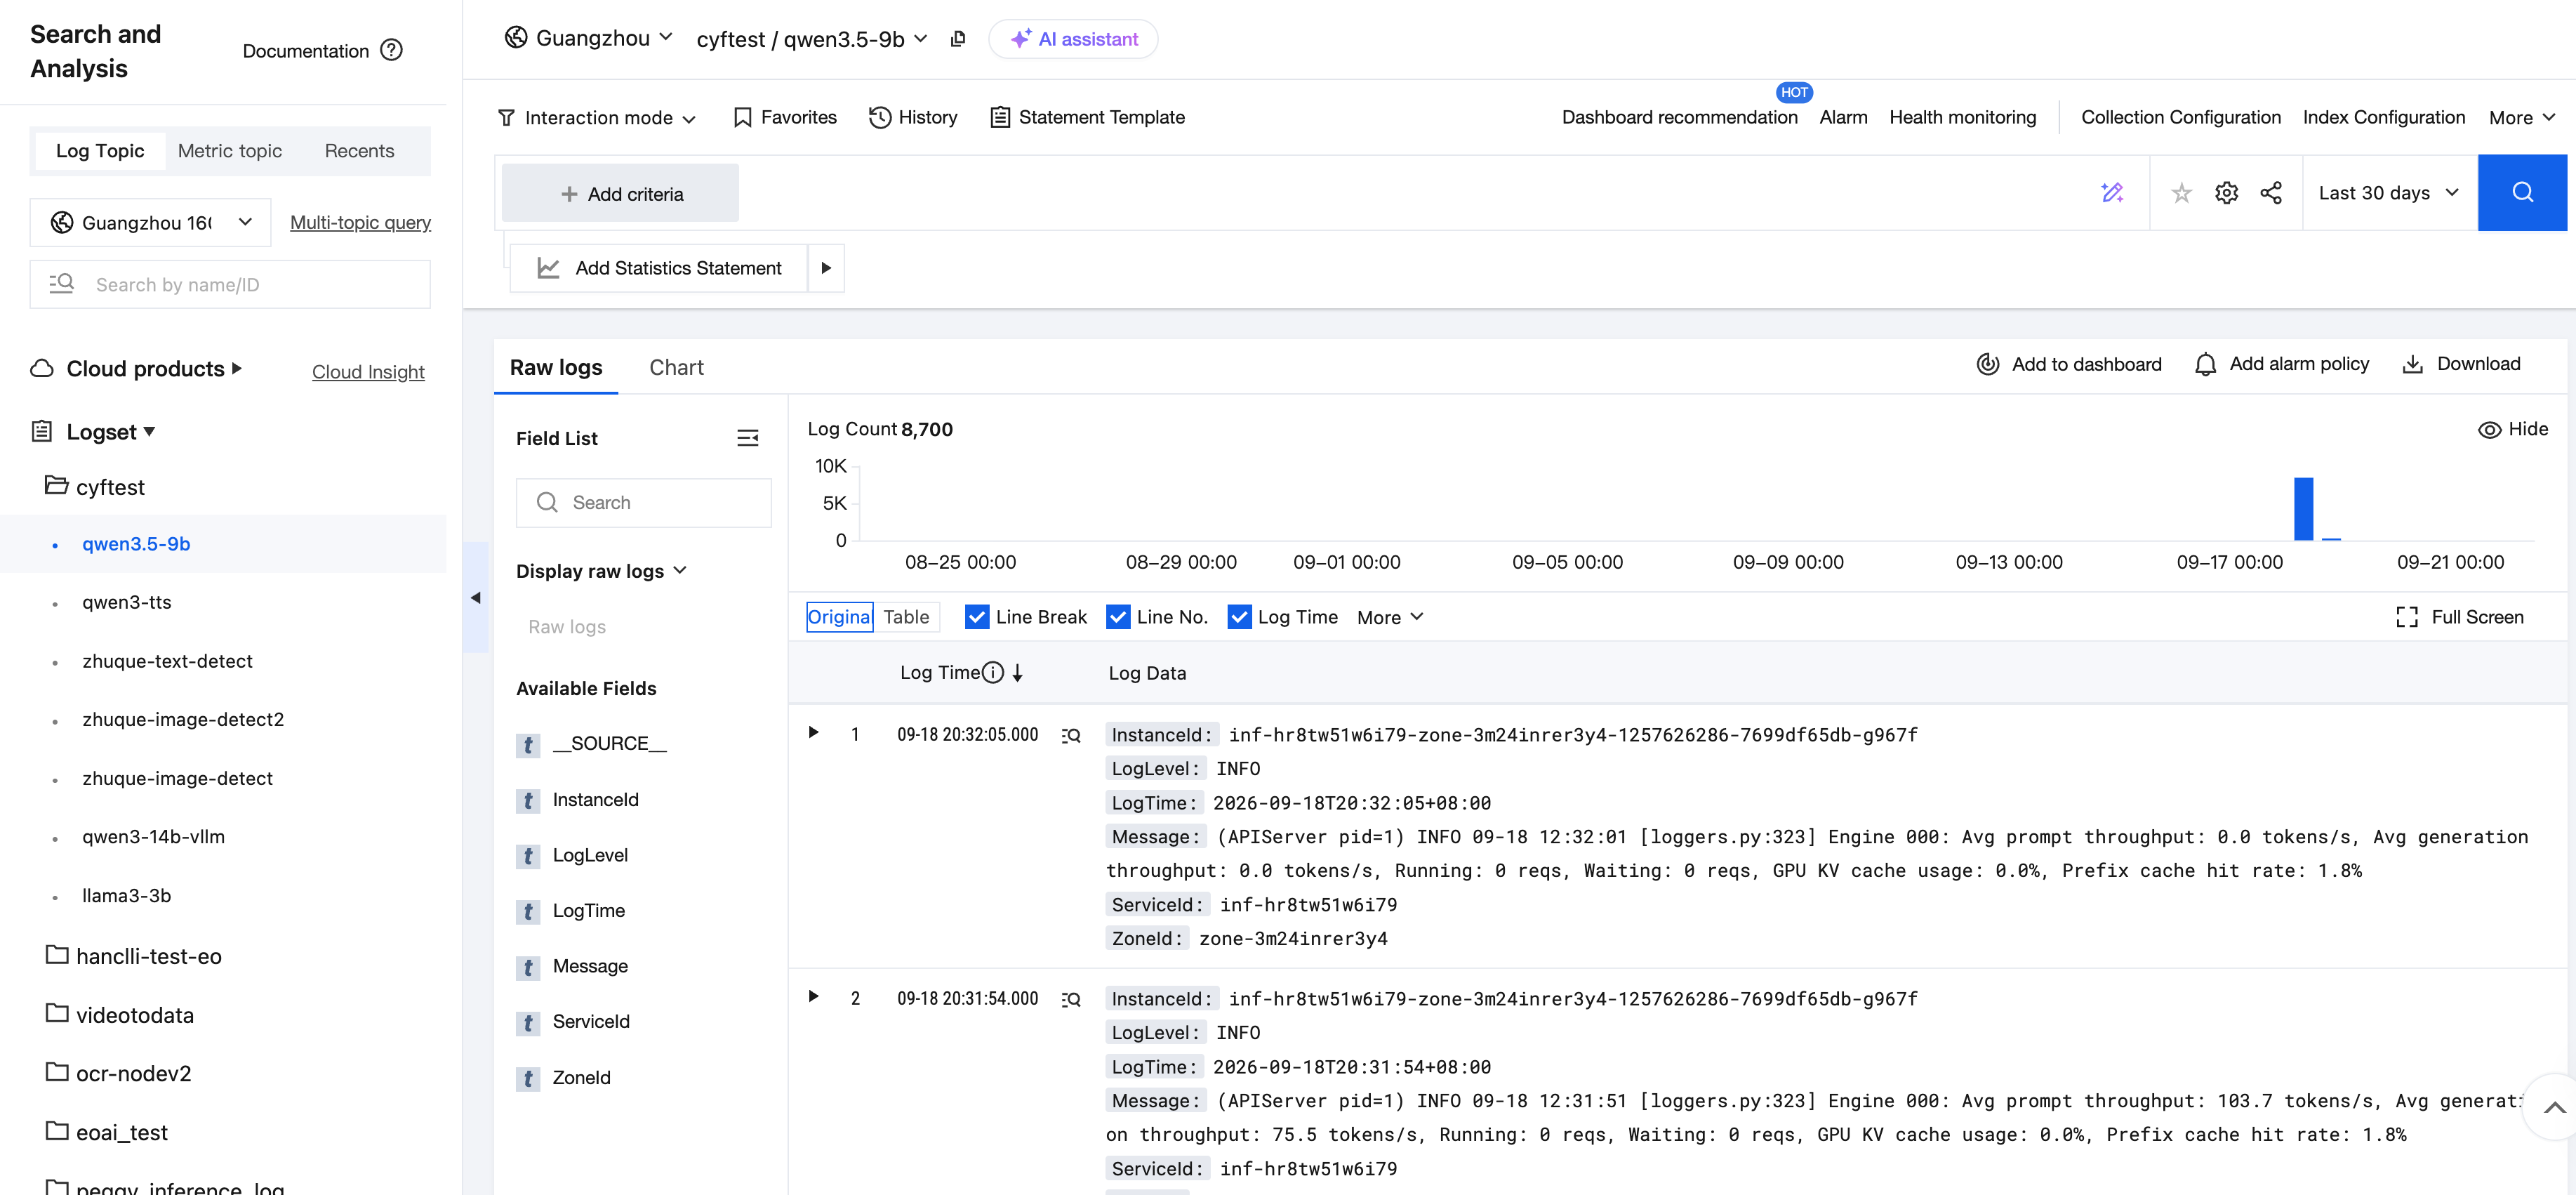
On the service details page, under the Basic Information tab, click Search Analysis in the Log Settings section to go to the corresponding log topic in the CLS console.
The CLS console provides two views: raw logs and statistical charts. It supports searching by field name in searchable fields, and you can also customize the time range for the search.
Bantuan dan Dukungan
Apakah halaman ini membantu?
Anda juga dapat Menghubungi Penjualan atau Mengirimkan Tiket untuk meminta bantuan.
masukan