How to Address High CPU Utilization Issues in Distributed Cache Instances
Download
Mode fokus
Ukuran font
High CPU utilization in a Tencent Cloud Distributed Cache instance can impact the throughput of the entire instance cluster, potentially leading to application congestion and timeout interruptions. If the average CPU usage exceeds 60%, or if the average peak CPU usage exceeds 90% for more than 5 minutes, it is essential to promptly troubleshoot the root cause and implement targeted solutions to ensure business stability and availability.
Phenomenon Description
Symptom 1: receiving alarms about high CPU utilization.
Symptom 2: high CPU usage metrics in monitoring metrics.
Symptom 3: decreased overall throughput and slower response times.
Possible Causes, Troubleshooting and Solutions
Possible Causes | Cause Analysis | Troubleshooting Methods | Solution |
Frequent Non-Persistent Connections | Excessive resources are consumed on frequent non-persistent connections, leading to high CPU utilization and a high number of connections, while the QPS (queries per second) does not meet expectations. | Use the Performance Optimization > Real-Time Session feature to analyze the real-time session statistics view and data of the database instance to confirm whether there is a sudden increase in connection count. For detailed troubleshooting methods, see Non-Persistent Connection Troubleshooting and Optimization. | Emergency Action: Kill sessions. Recommended solution: Convert non-persistent connections to persistent connections, such as using the JedisPool connection pool. For example code, see Jedis Client. |
High Time Complexity Commands (such as sort, sunion, and zunionstore) | Tencent Cloud Distributed Cache executes commands in a single-threaded manner, meaning that high-complexity commands can potentially block the execution of other commands. The higher the time complexity of a command, the more resources it consumes during execution, which can result in slow logs and an increase in CPU utilization. | Use the Performance Optimization > Slow Log Analysis feature to check for complex commands in the slow log information list. For detailed troubleshooting methods, see Troubleshooting Complex Commands. | When using high-complexity commands, avoid retrieving too much data at once. Try to operate on a small amount of data to allow Tencent Cloud Distributed Cache to process and return data promptly. |
Frequent Access to Hot Keys | Hot keys refer to keys with very high access frequencies within a specific period. Business scenarios such as trending news, popular live streams, or flash sale events may generate significant traffic to a single instance, reaching its processing limit and increasing CPU utilization. | Use the Performance Optimization > Latency Analysis > Hot Key Analysis feature to quickly identify frequently accessed hot keys. For detailed troubleshooting methods, see Troubleshooting High Access Frequency Hot Keys. | Split complex data structures by dividing the hotspot key into multiple smaller keys distributed across different Redis nodes to reduce the load. For example, if the hotspot key is of hash type, which is a nested data structure with a potentially large number of elements, consider breaking the current hash into smaller segments. |
Large Keys | A large key refers to a key with a large value that occupies significant Tencent Cloud Distributed Cache space. Operations involving large keys (read or delete) can severely impact bandwidth and CPU utilization. | Use the Performance Optimization > Memory Analysis > Big Key Analysis feature to monitor and analyze the memory usage of large keys in the database. For detailed troubleshooting methods, see Troubleshooting Large Keys. | For excessively large values, you can split the object into multiple key-value pairs and distribute the pressure across multiple Tencent Cloud Distributed Cache instances. For too many keys, consider using hash structures to store them in a single hash. |
High Read/Write Load | The read load is excessively high, reaching the resource limit. The write load is excessively high, exceeding the memory capacity. | Use the Performance Optimization > Performance Analysis feature to analyze the read and write request metrics to verify if high CPU utilization is due to excessive read or write load. For detailed troubleshooting methods, please seeTroubleshooting High Read/Write Load. | High read load: Distribute the read load by increasing the number of replicas. Enable read-only replicas to redirect the current instance's read requests to the read-only replica nodes, achieving elastic scalability of reading capacity and enhancing read/write performance. For specific operations, see Toggle Read-Write Separation. High write load: Distribute the write load by increasing the number of shards. If the instance is in a standard architecture, prioritize upgrading from a standard to a cluster architecture to enhance CPU processing capability. For specific operations, see Upgrade Instance Architecture. Before upgrading, compatibility checks are required. See Standard Architecture to Cluster Architecture Migration Check. |
Frequent DB Switching (Frequent SELECT Commands) | Frequent DB switching leads to excessive resource overhead. | Use the Performance Optimization > Latency Analysis > Command Word Analysis feature to monitor and confirm if there are many SELECT requests. For detailed troubleshooting methods, please see Troubleshooting Frequent SELECT Commands. | If different businesses are being stored, it is recommended to separate storage for tasks involving frequent DB switching. If the same business is being stored, consider storing the data in the same DB to reduce the number of select operations, provided that the Key names do not conflict. |
Non-Persistent Connection Troubleshooting and Optimization
Troubleshooting Steps
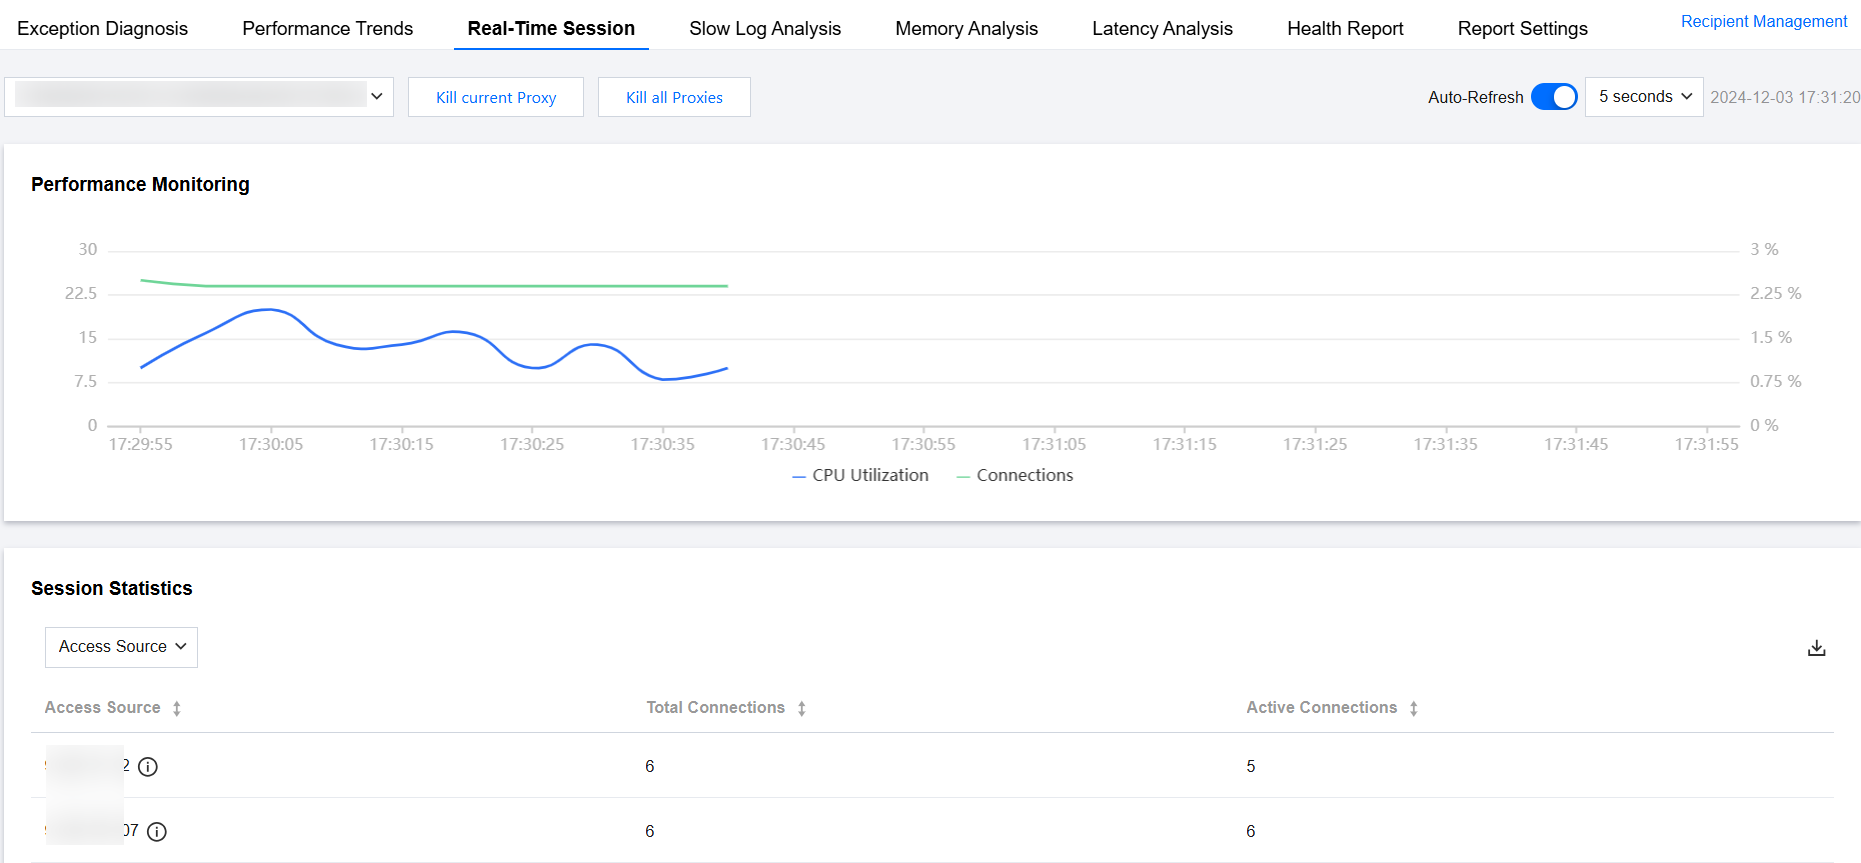
1. Log in to the DBbrain Console and select Performance Optimization on the left sidebar.
2. At the top of the page, select Database Type as Distributed Cache and specify the instance ID, then select Real-Time Session tab.
3. In the dropdown list at the top left of the Performance Monitoring trend chart, select the Proxy ID to be analyzed.
4. In the performance monitoring trend chart, check for high CPU utilization and a high number of connections.
Solution:
Emergency Actions
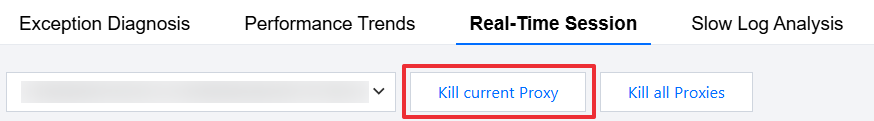
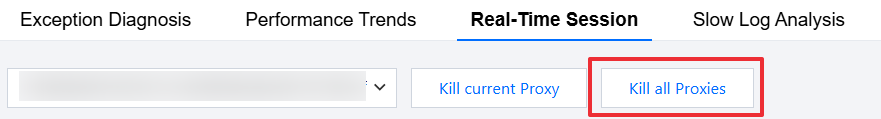
Kill sessions. DBbrain supports killing client connections of the selected Distributed Cache instance's current Proxy or all Proxies.
Note:
Killing sessions will interrupt ongoing operations and may cause data loss. Use with caution. Before using, back up data and assess risks.
At the top of the page, click Kill current Proxy. In the pop-up dialog box, click OK.
At the top of the page, click Kill all Proxies. In the pop-up dialog box, click OK.
Recommended Solutions
Convert non-persistent connections to persistent connections, such as using the JedisPool connection pool. For example code, see Jedis Client.
Troubleshooting Complex Commands
Troubleshooting Steps
1. Log in to the DBbrain Console and select Performance Optimization on the left sidebar.
2. At the top of the page, select Database Type as Distributed Cache and specify instance ID, and select Slow Log Analysis tab.
3. Select to view instance-level or Proxy node slow logs.
Click Instance to view the instance dimension's slow log statistics trend chart.
Click Proxy Node, and select the Proxy ID to analyze from the dropdown list. You can select the Proxy ID to analyze based on the trend chart of CPU utilization or slow log quantity change.
4. At the top of the page, select the time period. Options include today, last 5 minutes, last 10 minutes, last hour, last 3 hours, last 24 hours, last 3 days, and custom time periods.
If this instance has slow SQL during the selected time period, SQL statistics will display the time points and quantity of slow SQL in a bar graph. Click the bar graph to show all corresponding slow SQL information (SQL after template aggregation) in the slow log list below, and the right side will display the execution time distribution of SQL within that period.
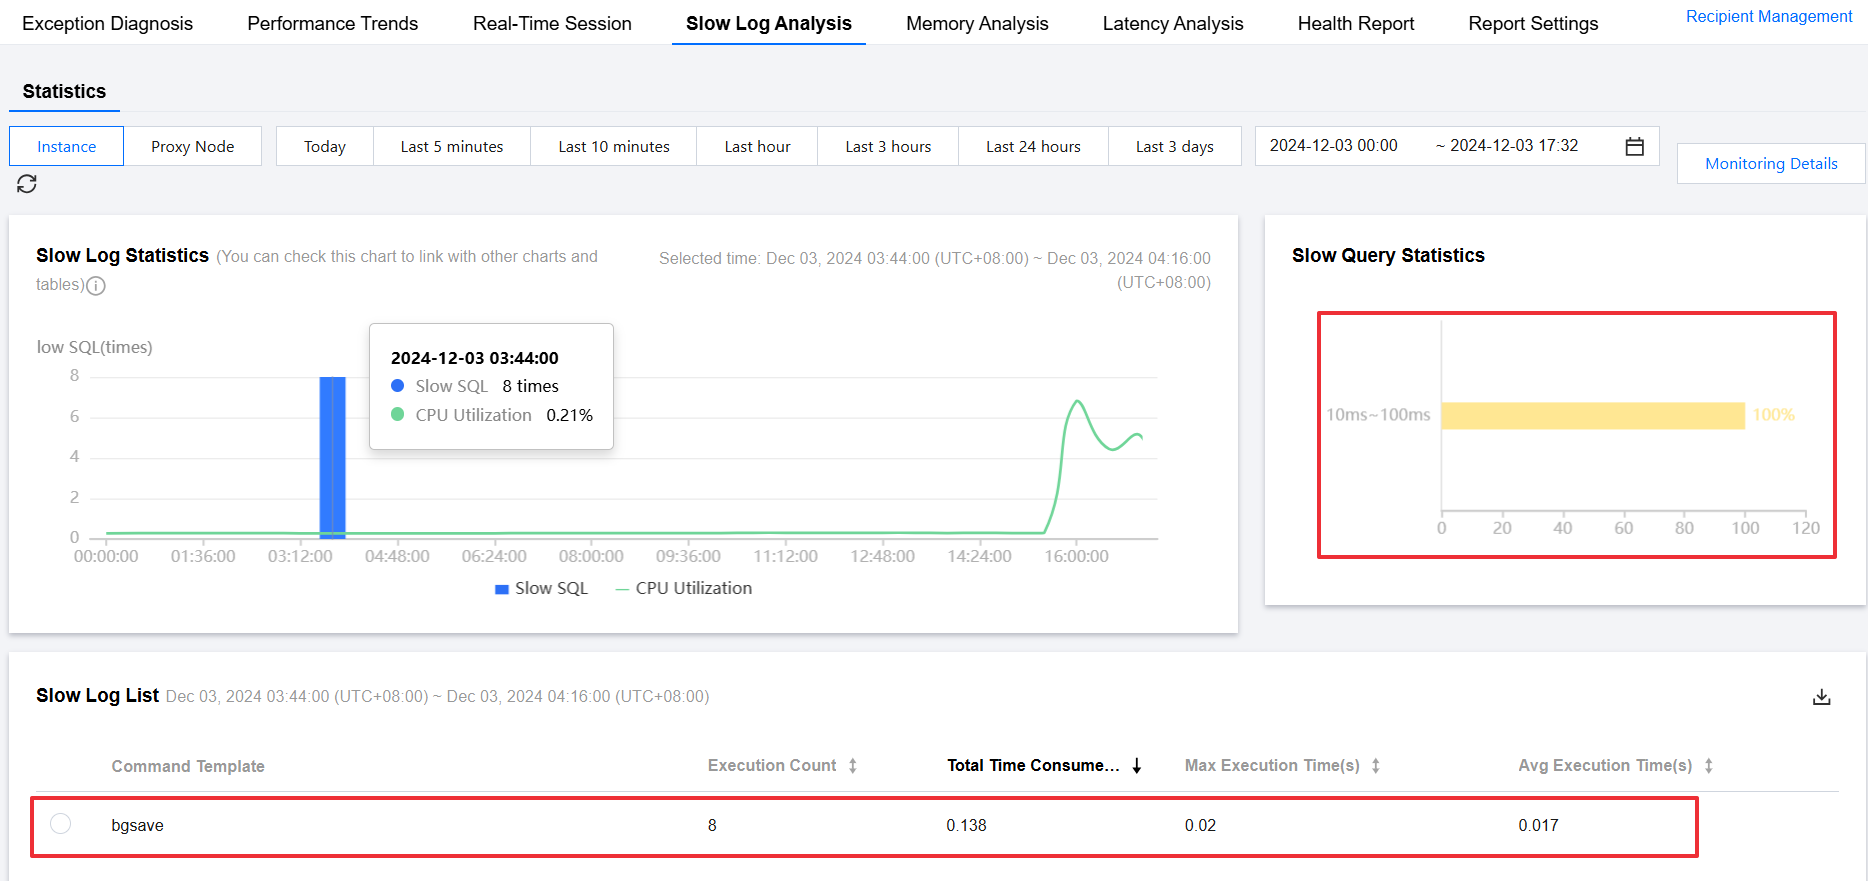
5. In the slow log list, you can find complex commands like sort, sunion, and zunionstore.
Solution:
When using high-complexity commands, avoid retrieving too much data at once. Try to operate on a small amount of data to allow Tencent Cloud Distributed Cache to process and return data promptly.
Troubleshooting High Access Frequency Hot Keys
Troubleshooting Steps
1. Log in to the DBbrain Console and select Performance Optimization on the left sidebar.
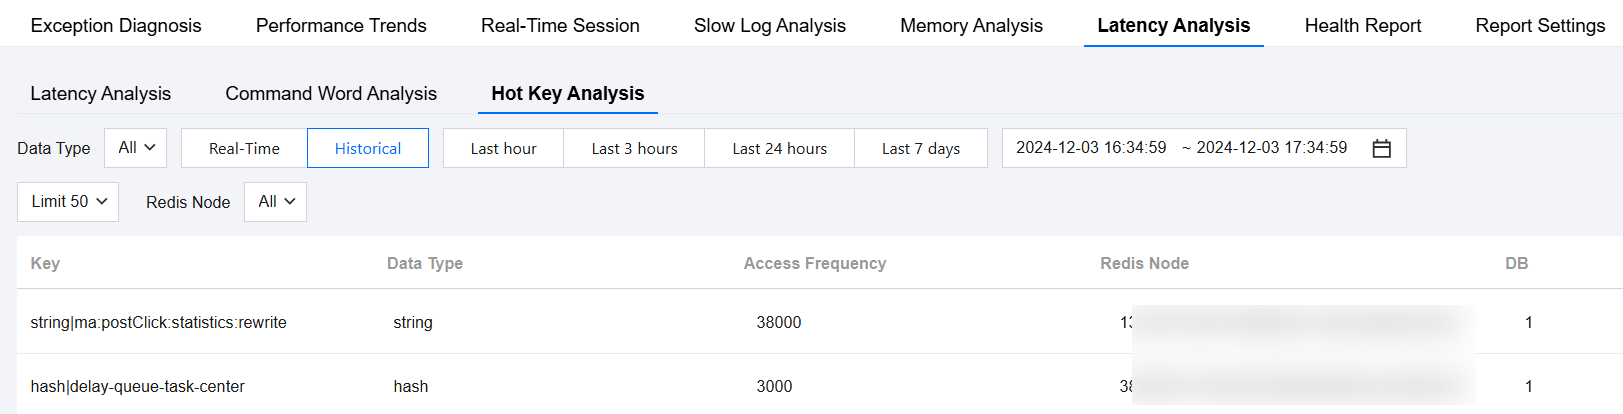
2. At the top of the page, select Database Type as Distributed Cache and specify the instance ID. Select Latency Analysis > Hot Key Analysis.

3. On the Hot Key Analysis page, select Database Type as All. If you know the specific Redis node, select the Specific Node; if not, select All Nodes.
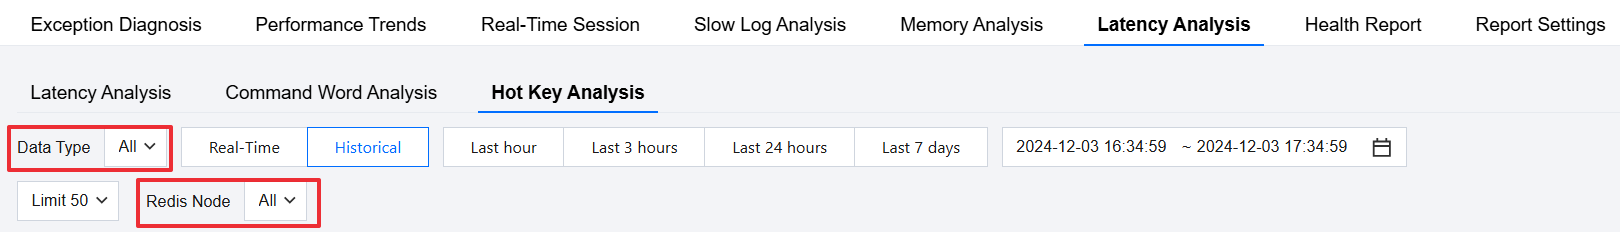
4. Select real-time or historical view, select the time period to view, and view the high access frequency hot keys.
Solution:
Split complex data structures by dividing the hotspot key into multiple smaller keys distributed across different Redis nodes to reduce the load. For example, if the hotspot key is of hash type, which is a nested data structure with a potentially large number of elements, consider breaking the current hash into smaller segments.
Troubleshooting Large Keys
Troubleshooting Steps
1. Log in to the DBbrain Console and select Performance Optimization on the left sidebar.
2. At the top of the page, select Database Type as Distributed Cache and specify the instance ID. Select Latency Analysis > Ad Hoc Analysis of Big Key.

3. Click Create Task, select a delimiter and shard ID in the pop-up dialog box, and click OK.
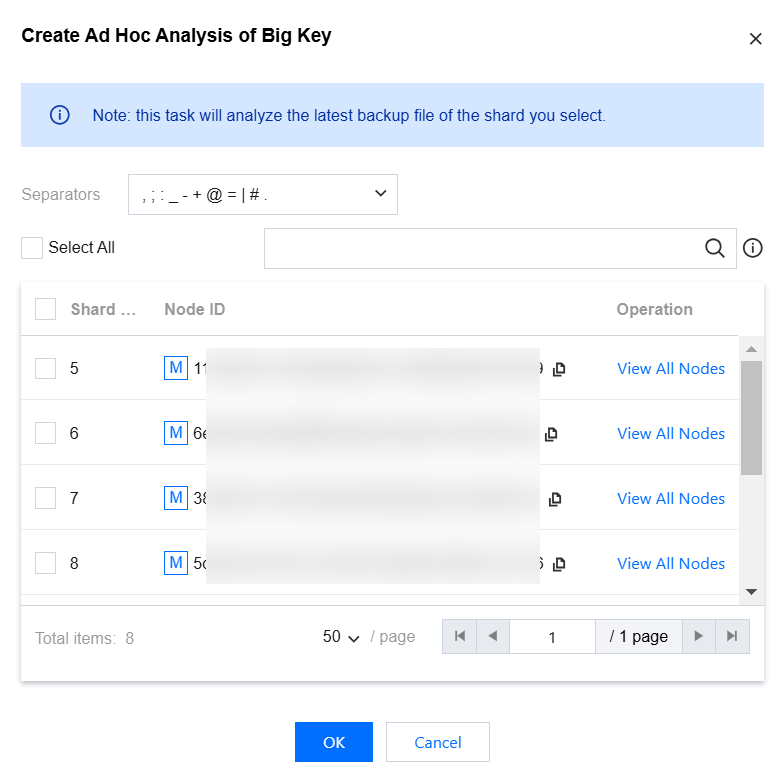
You can click View All Nodes in the Operation column to view all node IDs.
Once the task is created, DBbrain will automatically generate a backup and perform automated analysis.
4. In the task list, when the task progress reaches 100%, click View in the Operation column to view the analysis results in a pop-up on the right.
The task analysis results display the Top 100 Large Key (by memory), Top 100 Large Key (by quantity), and Top 100 Key Prefixes in three dimensions, and allow viewing results from both instance and shard dimensions.
If you need to perform daily large key analysis periodically during routine Ops, enable the Instance Large Key Analysis feature. For specific operations, see Memory Analysis (Large Key Analysis).
Solution:
For excessively large values, you can split the object into multiple key-value pairs and distribute the pressure across multiple Tencent Cloud Distributed Cache instances. For too many keys, consider using hash structures to store them in a single hash.
Troubleshooting High Read/Write Load
Troubleshooting Steps
1. Log in to the DBbrain Console and select Performance Optimization on the left sidebar.
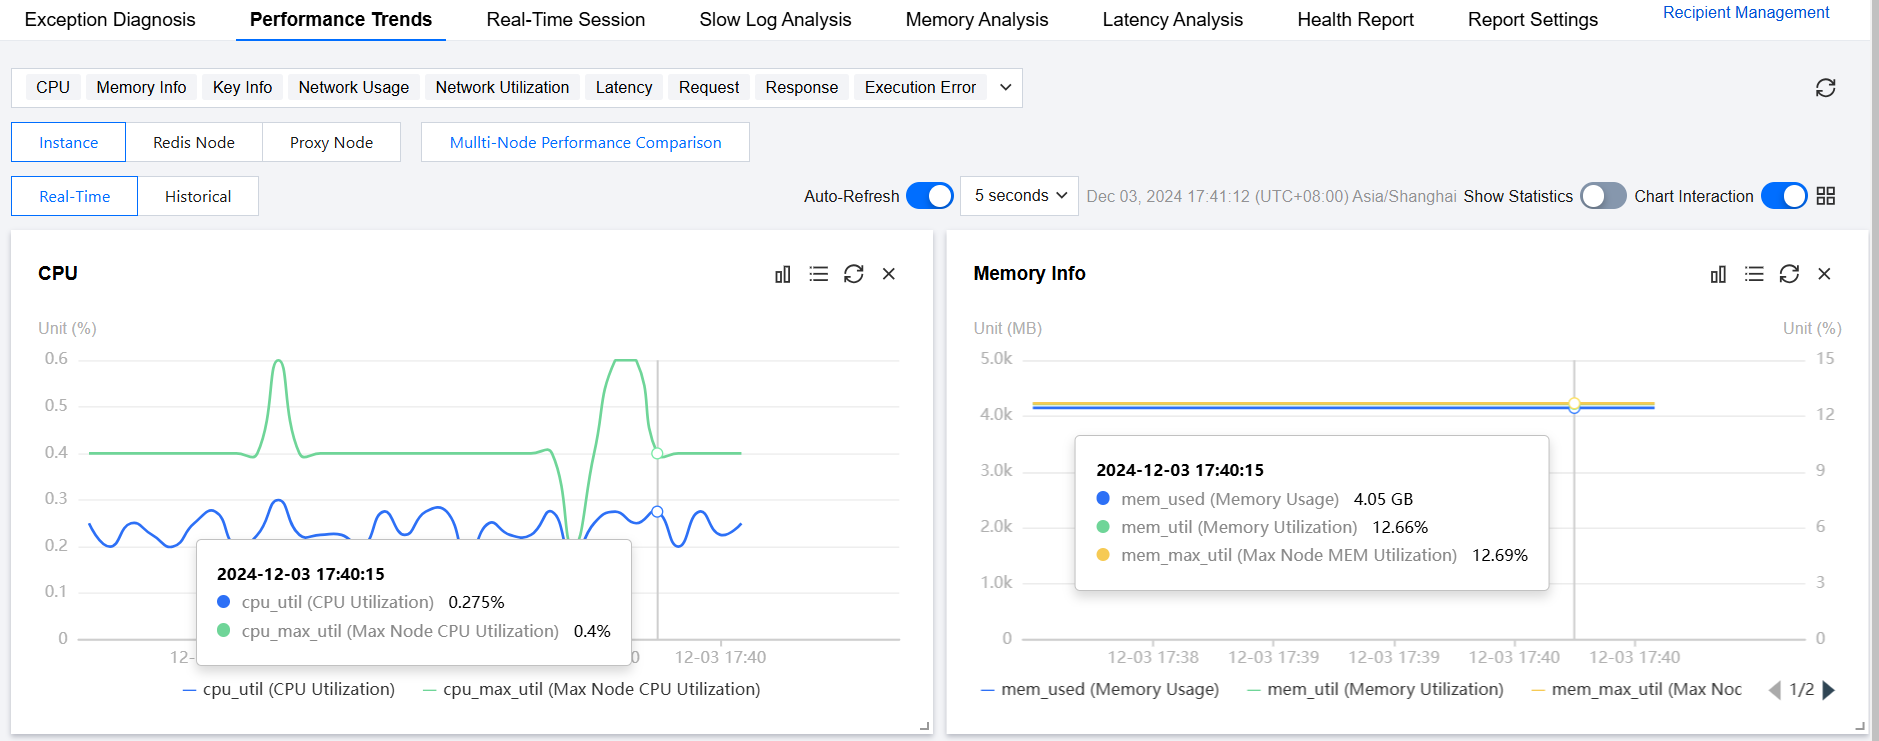
2. At the top of the page, select Database Type as Distributed Cache and specify the Instance ID, then select Performance Trends.
3. Select the instance, Redis node, or Proxy node you want to view.
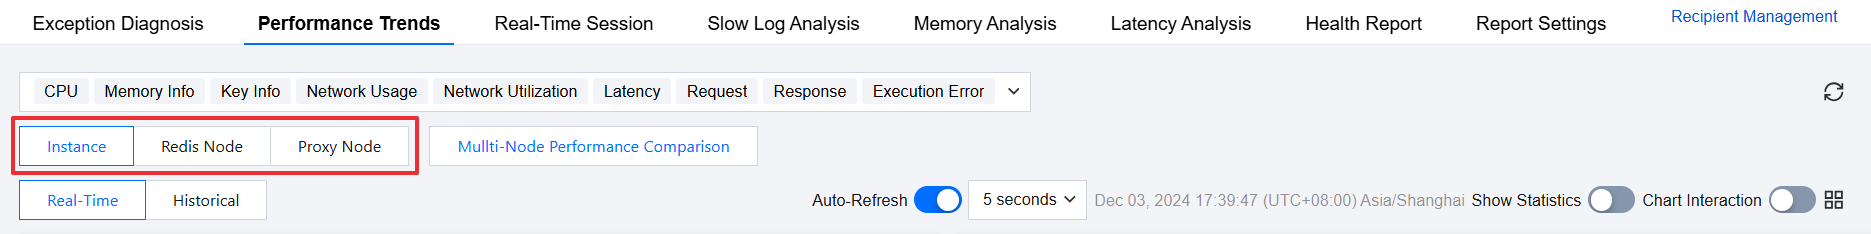
4. Click the Performance Metrics drop-down list and select CPU Monitoring and Request Monitoring performance metrics.
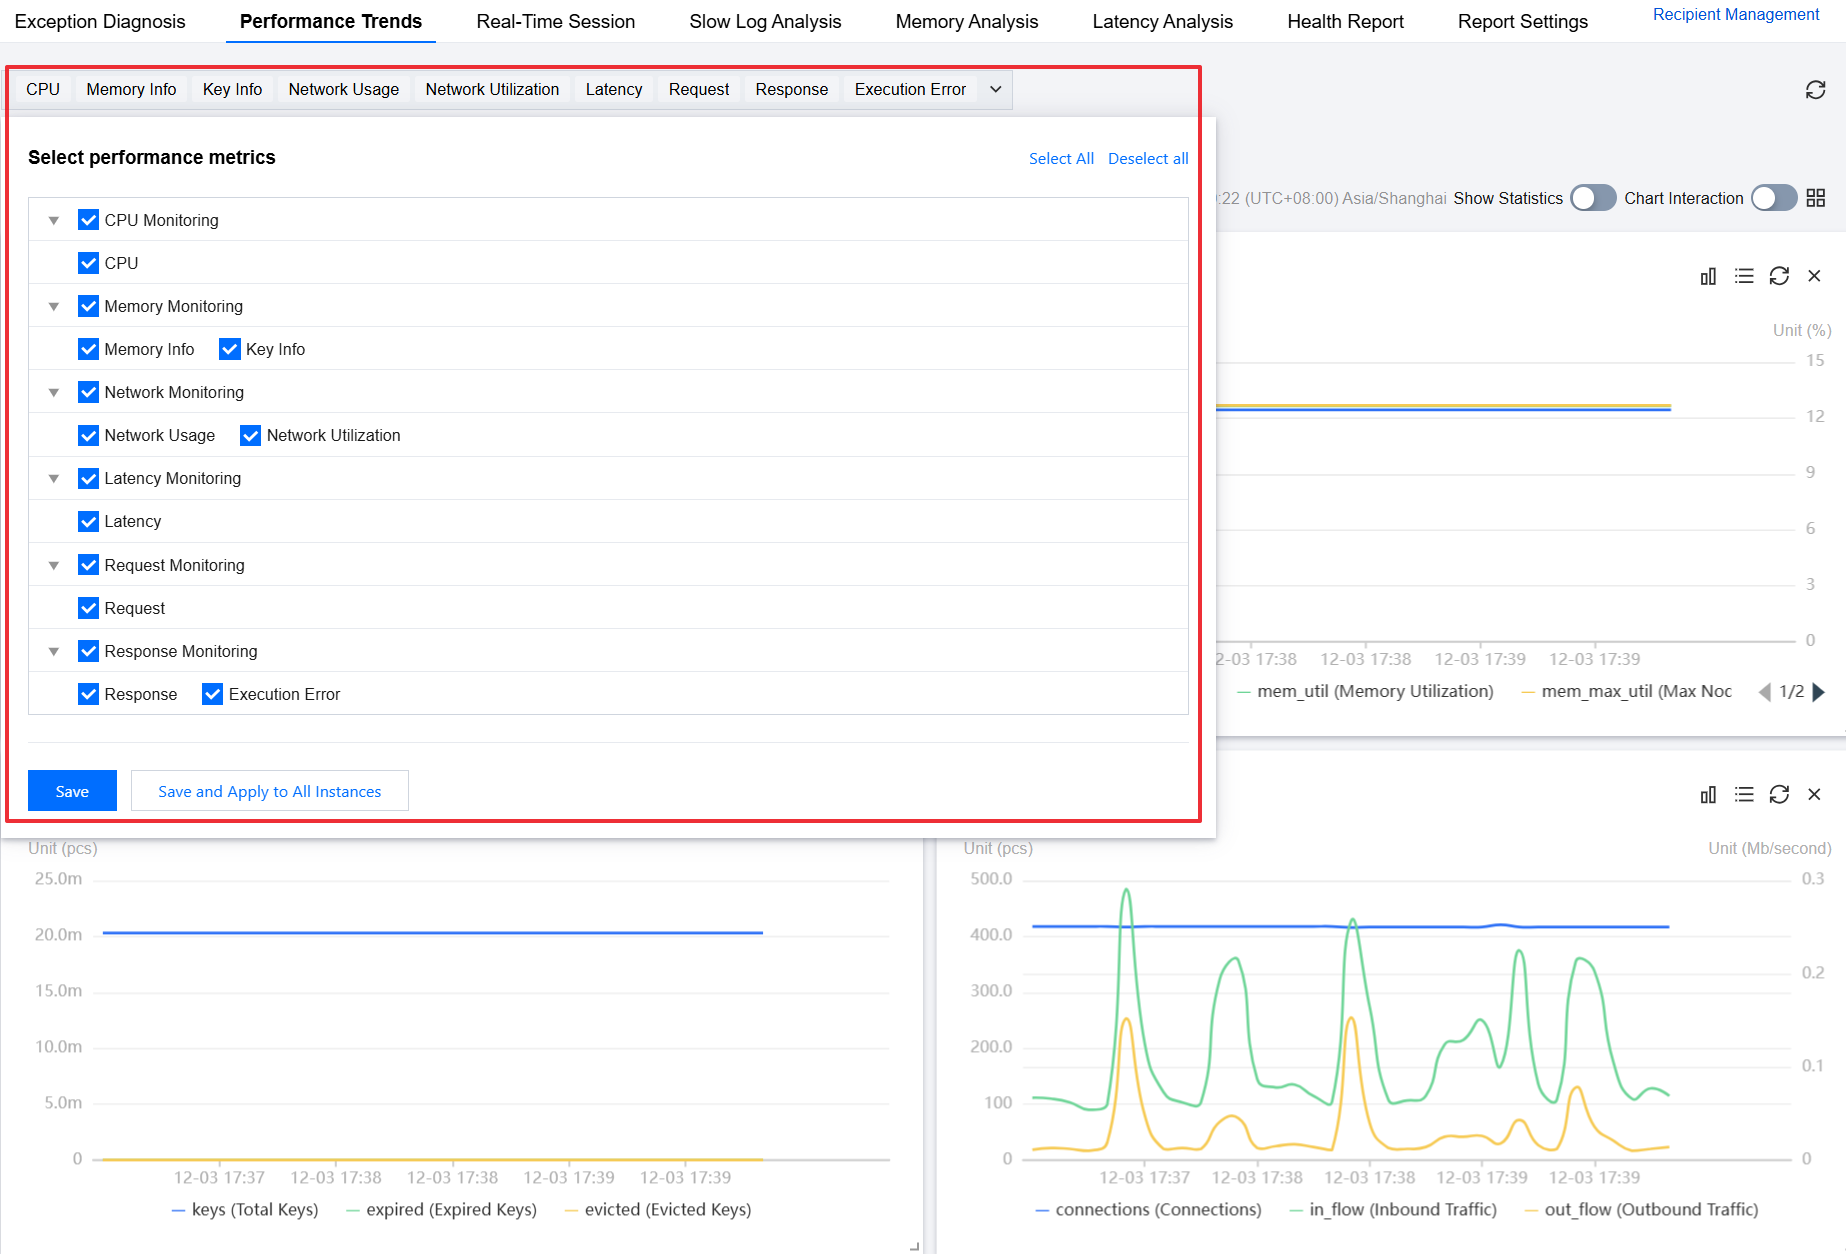
5. Enable chart linkage at the top right of the page to view if the read and write requests are high when the CPU utilization is high on the performance trend chart.
Solution:
High read load: Distribute the read load by increasing the number of replicas. Enable read-only replicas to redirect the current instance's read requests to the read-only replica nodes, achieving elastic scalability of reading capacity and enhancing read/write performance. For specific operations, see Toggle Read-Write Separation.
High write load: Distribute the write load by increasing the number of shards. If the instance is in a standard architecture, prioritize upgrading from a standard to a cluster architecture to enhance CPU processing capability. For specific operations, see Upgrade Instance Architecture. Before upgrading, compatibility checks are required. See Standard Architecture to Cluster Architecture Migration Check.
Troubleshooting Frequent SELECT Commands
Troubleshooting Steps
1. Log in to the DBbrain Console and select Performance Optimization on the left sidebar.
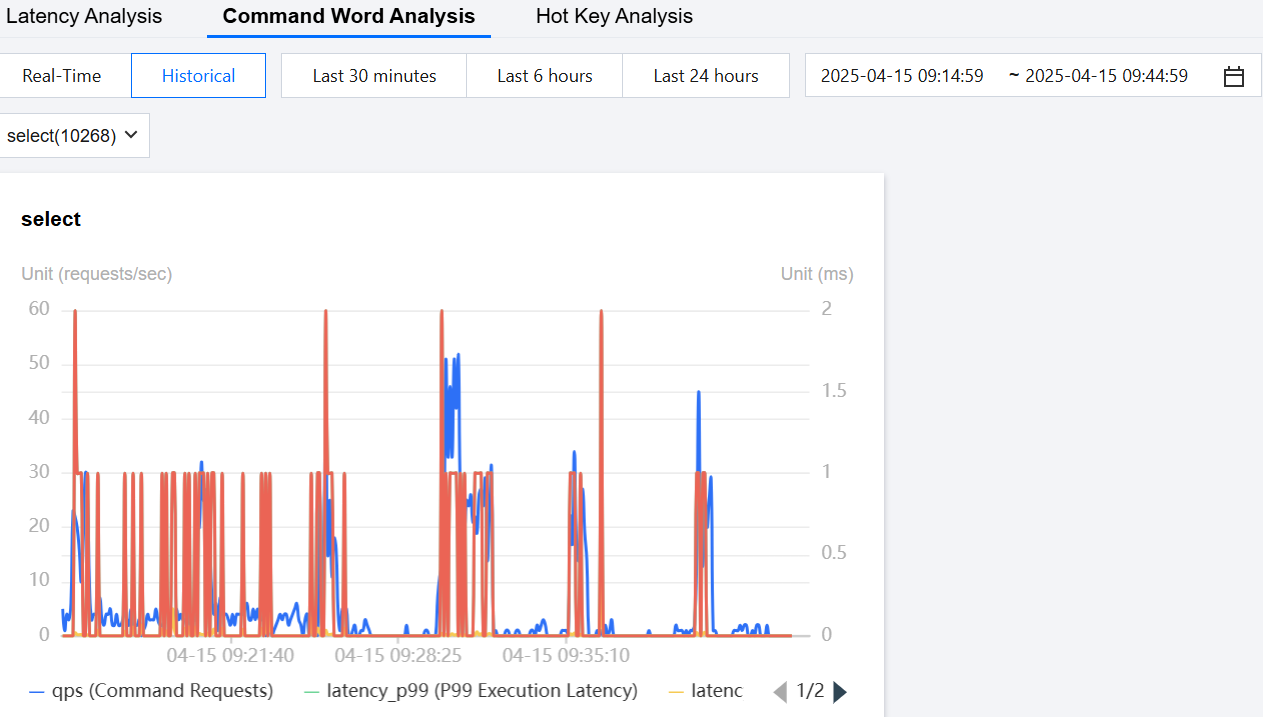
2. At the top of the page, select Database Type as Distributed Cache and specify the instance ID. Select Latency Analysis > Command Word Analysis.

3. On the Command Word Analysis page, select real-time or historical data.
4. Select Select Command Type, and click OK.
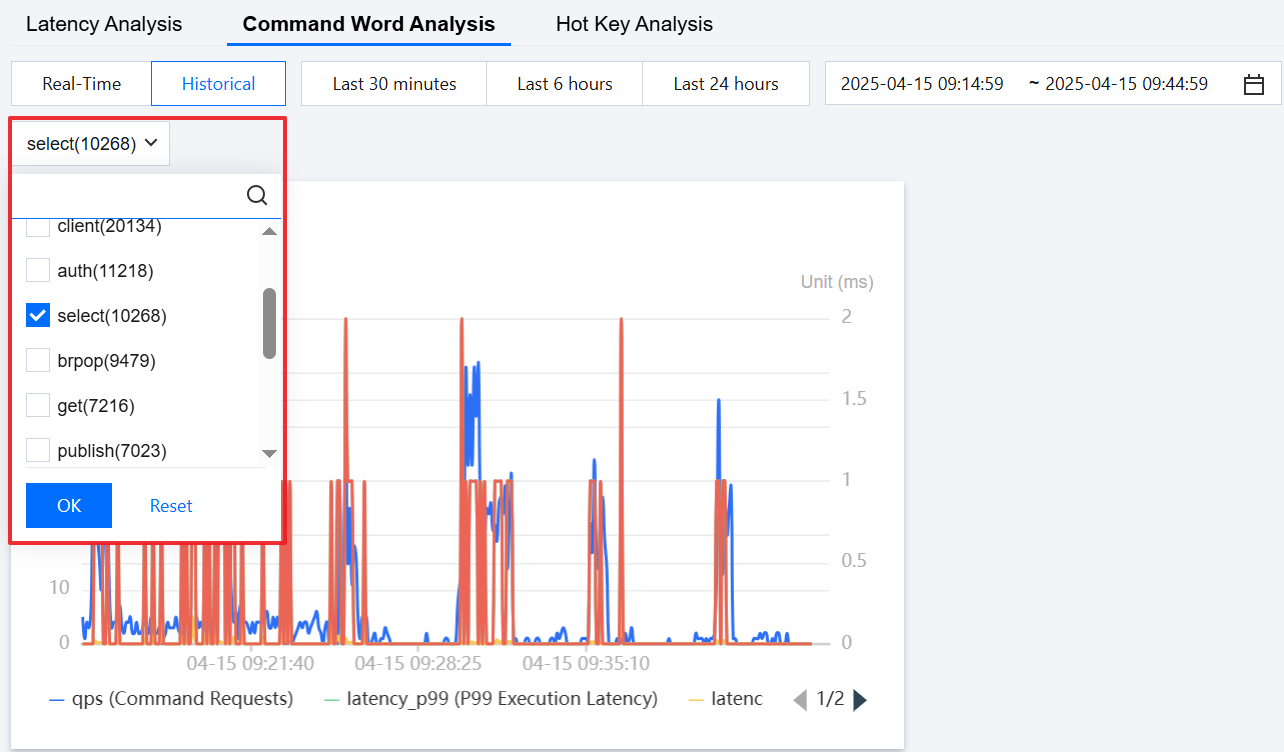
5. Check if there is a phenomenon of frequent select requests.
Solution:
If different businesses are being stored, it is recommended to separate storage for tasks involving frequent DB switching.
If the same business is being stored, consider storing the data in the same DB to reduce the number of select operations, provided that the Key names do not conflict.
Bantuan dan Dukungan
Apakah halaman ini membantu?
Anda juga dapat Menghubungi Penjualan atau Mengirimkan Tiket untuk meminta bantuan.
masukan